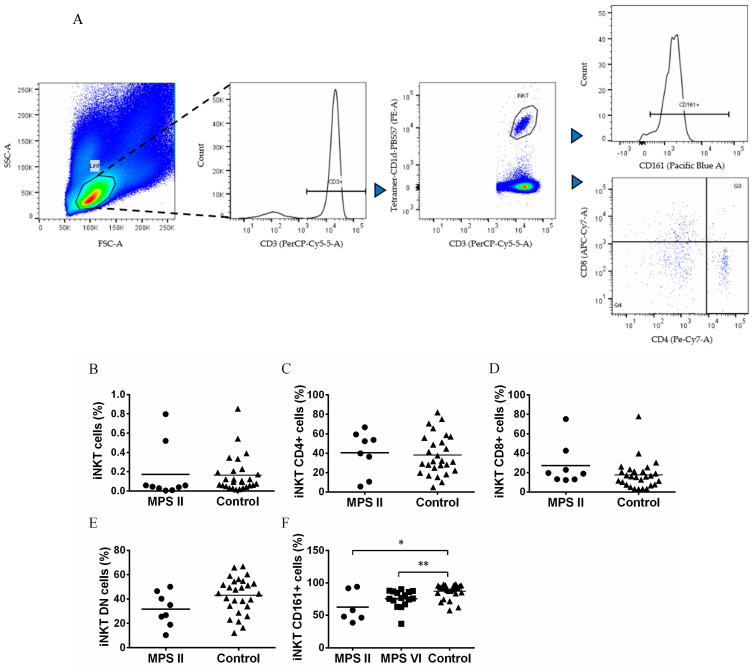
Figure 3.
Percentage and phenotype of iNKT cells in MPS disease patients, and control subjects. (A) Gating strategy to characterize iNKT cells by the expression of CD4, CD8 and CD161 among total T cells. (B) Percentage of iNKT cells in total T cells of MPS II disease patients and controls, (C) CD4+CD8− cells in iNKT cells of MPS II disease patients and controls, (D) CD4−CD8+ cells in iNKT cells of MPS II disease patients and controls, (E) CD8−/double negative (DN) cells in iNKT cells of MPS II disease patients and controls and (F) CD161+ cells in iNKT cells of MPS II and VI disease patients and control group. Horizontal bars represent mean values. * p < 0.05; ** p < 0.01.

