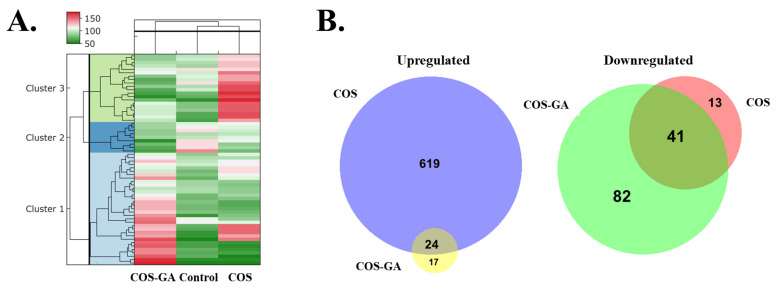
Figure 3.
LC-MS/MS analysis of differentially expressed proteins of SW620 cells treated with COS, COS–GA, and the control for 24 h. Data are represented as heat map protein profiles (A) and Venn diagrams comparing the number of upregulated proteins and downregulated proteins between COS and COS–GA groups ((B) left and right panels, respectively).

