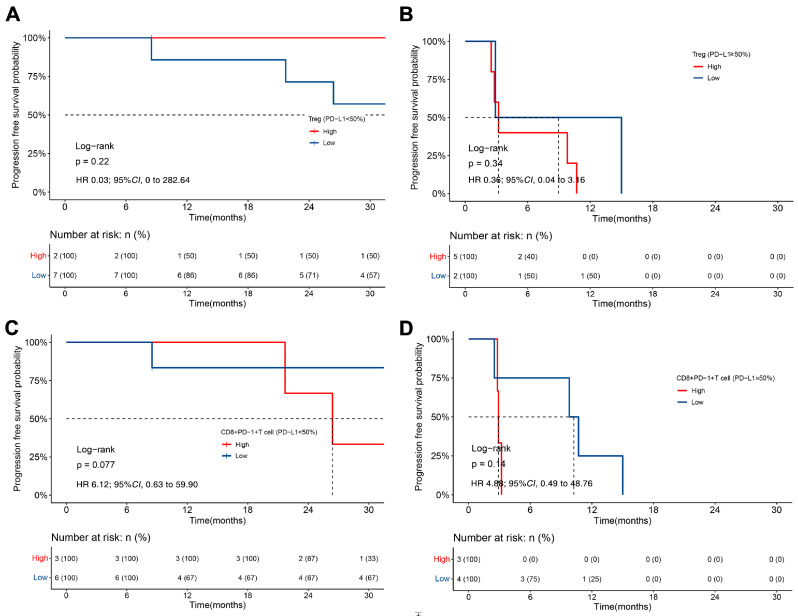
Figure 6.
Kaplan–Meier analysis of PFS based on TME in patients treated with crizotinib. (A,B) The difference in PFS between patients with high and low levels of tumour-infiltrating Tregs in the PD-L1lo group (A) and PD-L1hi group (B). (C,D) The difference in PFS between patients with high and low levels of tumour-infiltrating exhausted CD8+ T cells in the PD-L1lo group (C) and PD-L1hi group (D).

