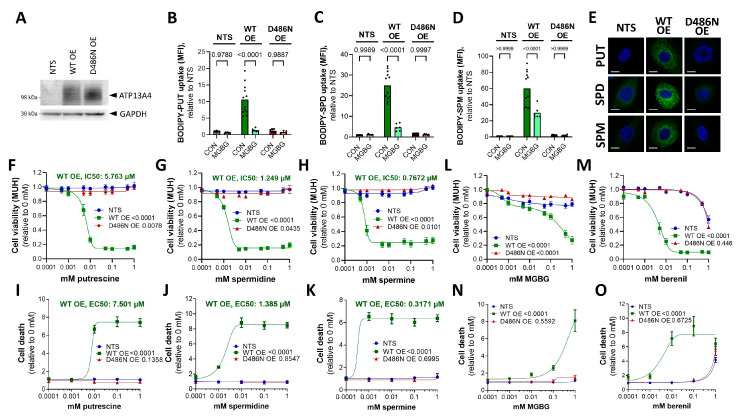
Figure 4.
Overexpression of ATP13A4 WT in MCF10A cells induces an MCF7 polyamine phenotype. (A). Immunoblot depicting ATP13A4 overexpression levels in MCF10A cells (non-transduced, NTS; ATP13A4 WT overexpression, WT OE; ATP13A4 D486N mutant overexpression, D486N OE). Cellular uptake of BODIPY-labeled putrescine (BODIPY-PUT) (B,E), spermidine (BODIPY-SPD) (C,E) and spermine (BODIPY-SPM) (D,E) (1 µM, 2 h) was assessed via flow cytometry (B–D) or confocal microscopy (E). Representative confocal microscopy images are shown of three independent experiments. Scale bar, 10 μm. MFI, mean fluorescence intensity. Cells were treated for 24 h with indicated concentrations of putrescine (F,I), spermidine (G,J), spermine (H,K), MGBG (L,N) or berenil (M,O) prior to cell viability (MUH; (F–H,L,M)) or cell death (Toxilight; (I–K,N,O)) assays. Data were normalized to untreated controls for each cell line and are presented as the mean of at least three independent experiments, with individual data points shown (B–D), or ± s.e.m. (F–O). Statistical significance was determined by one-way ANOVA with Šídák’s multiple comparisons test (B–D) or by two-way ANOVA with Dunnett’s multiple comparisons test ((F–O), compared to NTS). p values are depicted in the graphs.

