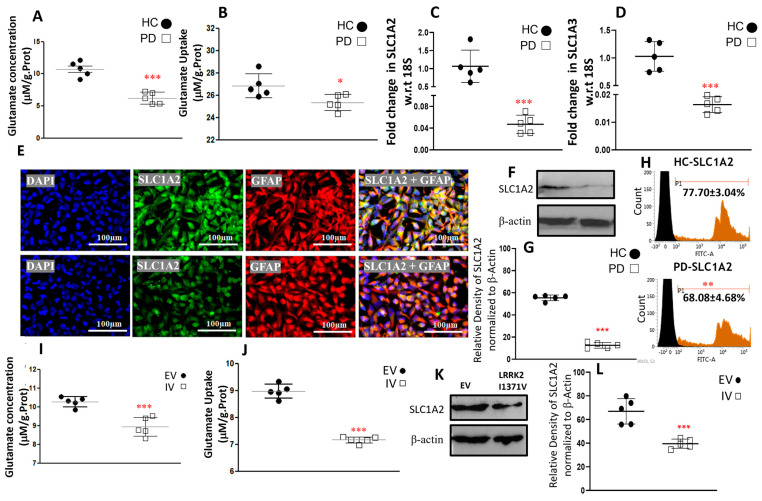
Figure 6.
Glutamate content and uptake along with the expression of genes and proteins associated with its uptake. (A) Glutamate content in HC and PD astrocytes. (B) Glutamate uptake capacity in HC and PD astrocytes. (C,D) qPCR analysis of mRNA levels of (C) excitatory amino acid transporter 2 (SLC1A2) and (D) excitatory amino acid transporter 1 (SLC1A3); w.r.t, with respect to. (E) ICC images of SLC1A2 (Alexa Fluor® 488; green) and GFAP (Alexa Fluor® 647; red) coimmunostained HC and PD astrocytes; nucleus counterstained with DAPI. (F) Western blot analysis using antibodies targeting SLC1A2 and β−actin (HC, healthy control; PD, Parkinson’s disease LRRK2−I1371V). (G) Densitometric analysis of the bands obtained via Western blotting. (H) Flow cytometry histogram of SLC1A2 in HC and PD astrocytes. (I) Glutamate content in EV and IV transfected U87 cells. (J) Glutamate uptake capacity in EV and IV transfected U87 cells (K) Western blot analysis using antibodies targeting SLC1A2 and β−actin (EV, U87 cells transfected with empty vector; IV, U87 cells transfected with LRRK2−I1371V). (L) Densitometric analysis of the bands obtained via Western blotting. n = 5; mean ± SD; *—p < 0.05 (HC versus PD); **—p < 0.01; ***—p < 0.001 (HC versus PD or EV versus IV).

