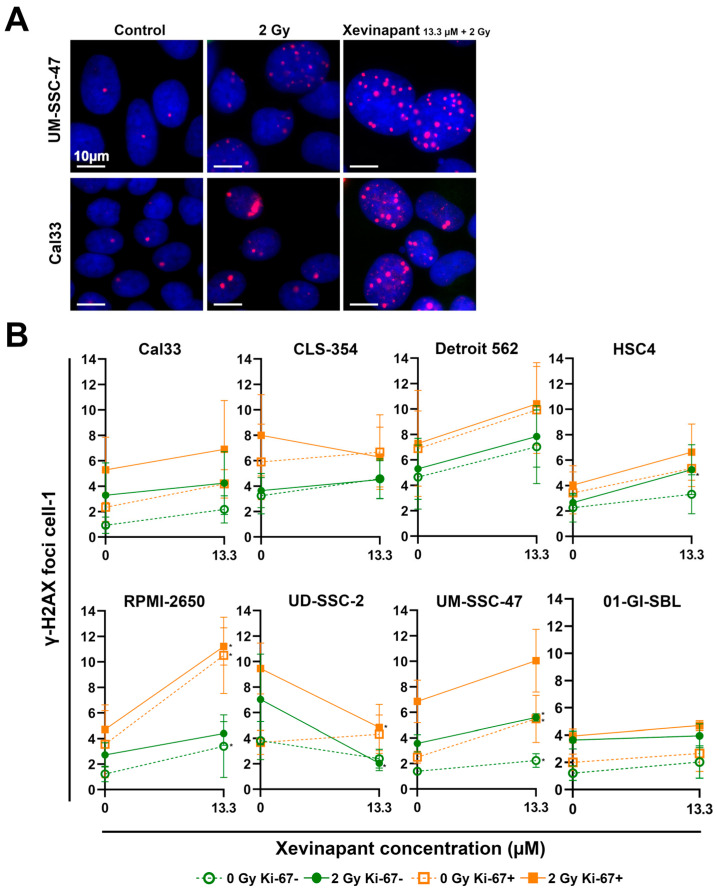
Figure 5.
Analysis of remaining DNA DSBs after 48 h using γH2AX immunostaining assay: (A) Representative images of γH2AX foci in HNSCC cells Cal33 and UM-SSC-47 in untreated cells (control) 48 h after treatment with IR (2 Gy) alone or after combined treatment with IR and Xevinapant (13.3 µM). γH2AX foci are red and localized in the blue nucleus. (B) Number of foci per cell in each cell line after treatment with Xevinapant (13.3 µM) alone (dashed line) and in combination with IR dose of 2 Gy (straight line). Green line represents foci in Ki-67 negative cells, and orange line represents foci in Ki-67 positive cells. The average of the foci of all cells (n > 400) counted was determined in each experiment. Each value in the graph represents the total mean ± SD of at least 3 independent experiments. Significance of DNA DSBs between Xevinapant-treated cells and the untreated control and between Xevinapant-treated cells with IR and IR alone was determined by Mann–Whitney U test * p ≤ 0.05. * means that the values were compared with those of the same group (0 Gy or 2 Gy) at 0 µM.

