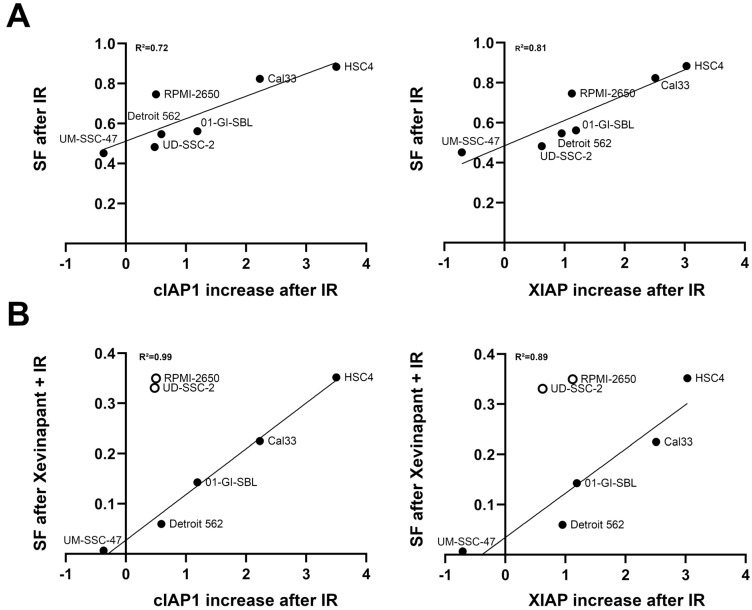
Figure 8.
Association between upregulation of cIAP1 and XIAP levels and clonogenic survival: (A) Increase in cIAP1 and XIAP levels after IR plotted against the survival fraction (SF) after IR and (B) after the combination of IR and Xevinapant, measured by colony formation assay. Line represents linear regression analysis. An open circle means that the cell line was excluded from the regression.

