

ABSTRACT
Background:
Sepsis is a major cause of death in hospitalised patients worldwide. Most studies for assessing outcomes in sepsis are from the western literature. Sparse data from Indian settings are available comparing the systemic inflammatory response syndrome (SIRS), Sequential Organ Failure Assessment (SOFA) and quick SOFA (qSOFA) (sepsis 3 criteria) for assessing outcomes in sepsis. In this study, we aimed to compare the SIRS criteria and sepsis 3 criteria to assess disease outcome at day 28 (recovery/mortality) in a North Indian tertiary care teaching hospital.
Methods:
A prospective observational study was performed in the Department of Medicine from 2019 to early 2020. Patients admitted to the medical emergency with clinical suspicion of sepsis were included. Systemic inflammatory response syndrome, qSOFA and SOFA scores were calculated at the time of presentation to the hospital. Patients were followed through the course of their hospital stay.
Results:
Out of 149 patients, 139 were included in the analysis. Patients who died had significantly higher mean SOFA, qSOFA scores and mean change in SOFA score than patients who survived (P value <0.01). There was no statistical difference between recovery and deaths at similar SIRS scores. A 40.30% fatality rate was recorded. Systemic inflammatory response syndrome had low Area Under Curve (AUC) (0.47) with low sensitivity (76.8) and specificity (21.7). SOFA had the maximum AUC (0.68) compared to qSOFA (0.63) and SIRS (0.47). SOFA also had the maximum sensitivity (98.1) while the qSOFA score had the maximum specificity (84.3).
Conclusion:
SOFA and qSOFA scores had superior predictive ability as compared to the SIRS score in assessing mortality in sepsis patients.
KEY WORDS: Quick sequential Organ Failure Assessment, sequential organ failure assessment, systemic inflammatory response syndrome
INTRODUCTION
Sepsis is an immunological response to an infection that is dysregulated and results in organ dysfunction.[1] Sepsis remains one of the significant causes of death in hospitalised patients with mortality being reported as high as 35.3% worldwide[2] and 60% in Indian hospitals[3] and poses a significant healthcare cost.
There have been multiple attempts to define sepsis. A 1991 consensus conference developed an initial definition that focused on the host’s systemic inflammatory response syndrome (SIRS) to infection.[4] Sepsis was defined as a combination of infection and SIRS. A 2001 task force expanded the definition of sepsis but did not provide any alternative explanation for the pathophysiology.[5]
The Third International Consensus Definitions for Sepsis and Septic Shock (Sepsis-3) Task Force recently redefined sepsis.[6] Sepsis has been defined as life-threatening organ dysfunction caused by a dysregulated host response to infection. For clinical operationalisation, organ dysfunction can be represented by an increase in sequential organ failure a assessment (SOFA) score of 2 points or more. Patients with septic shock can be clinically identified by a vasopressor requirement to maintain a mean arterial pressure of 65 mmHg or greater and serum lactate level greater than 2 mmol/L (>18 mg/dL) in the absence of hypovolemia. Adult patients with suspected infection can be rapidly identified as being more likely to have poor outcomes typical of sepsis if quick SOFA (qSOFA) is more than equal to 2.
The new sepsis definition was determined from a retrospective cohort of both intensive care unit (ICU) and non-ICU patients in North America and Germany. We aimed to compare the SIRS criteria and sepsis 3 criteria to access the outcomes, i.e., disease outcome at day 28 (recovery/mortality) in patients admitted with suspected sepsis in North Indian tertiary care teaching hospital.
MATERIALS AND METHODS
We performed a prospective observational study in the Department of Medicine, Maulana Azad Medical College and Lok Nayak Hospital from 2019 to early 2020. Study subjects included adult patients admitted to the medical emergency with clinical suspicion of sepsis based on clinical/radiological or laboratory findings such as presentation with fever with/without accompanying signs/symptoms—chills/rigour, cough, burning micturition, diarrhoea/dysentery, altered behaviour, musculoskeletal pain or administration of antimicrobials within 24 hours of presentation to the hospital. We excluded patients who presented with haemodynamic instability at the time of presentation. Patients with trauma, burns, immunocompromised status, anaphylaxis and suspected adrenal insufficiency were also excluded. The outcome of the study was status on day 28 of admission (recovery/mortality). The study was approved by the Institutional Ethics Committee of Maulana Azad Medical College on 26/10/2018 vide letter no. 17/IEC/MAMC/2018/16.
Systemic inflammatory response syndrome, qSOFA and SOFA scores were calculated at the time of presentation to the hospital. The study subjects were followed through the course of their hospital stay.
The comparison of SIRS and sepsis 3 criteria for diagnosis of sepsis was done and these were analysed to see the outcome.
Statistical analysis
The data were analysed on the SPSS 25 software. The quantitative data were analysed using mean, standard deviation (SD) while the qualitative data were analysed using proportions. The association between two qualitative variables was done using Chi-square while the association between two quantitative variables was done using the Pearson correlation test. Based on the results of this univariate analysis, the factors which were found to be significant in association with mortality were taken as input variables in the logistic regression model. This model was used to find out independent predictors for mortality.
RESULTS
A total of 149 patients presented to the medical emergency with suspicion of infection, 10 patients left against medical advice and 139 patients were included for statistical analysis.
The age ranged from 18 to 90 years with the mean being 52.13 ± 17.37. The maximum number of patients (50 subjects) was in the range of 41–60 years. Males comprised 60.4% (84/139) of the patient population. The respiratory tract (53.9%; 75/139) was the most common source of infection in our study followed by the urinary tract (18.7%; 26/139). The characteristics of the patients are tabulated in Table 1.
Table 1.
Characteristics of study population
| Parameter | Mean | SD |
|---|---|---|
| Age | 52.13 | 17.37 |
|
| ||
| Frequency (n) | Percentage (%) | |
|
| ||
| Gender | ||
| Male | 84 | 60.4 |
| Female | 55 | 39.6 |
| Source of infection | ||
| Respiratory tract | 75 | 54 |
| Urinary tract | 26 | 18.7 |
| Bloodstream | 23 | 16.5 |
| Other/Mixed | 15 | 10.8 |
| Outcome | ||
| Discharge | 83 | 59.7 |
| Death | 56 | 40.3 |
Out of the 139 patients, 79 patients (56.8%) were determined to be in need of intensive care. The need for intensive care was determined by the attending clinician’s judgement during the first 24 hours of the presentation. Major determinants of the need for intensive care were the requirement of ventilatory support (non-invasive/invasive), inotropic support and poor Glasgow Coma Scale (GCS). We were able to transfer only 20 patients to ICUs. Eighty-three (59.7%) patients were discharged, and 56 (40.3%) patients succumbed to the illness. Out of the 56 patients who expired, 34 patients expired within 7 days while 22 patients expired from day 8 onwards.
SIRS as a marker of sepsis
The mean SIRS score was 2.36 ± 1.01 in patients who were discharged and 2.30 ± 0.98 in patients who expired [Table 2]. There was no statistical difference between the mean of the two groups. Also, there was no statistical difference between recovery and deaths at similar SIRS scores [Table 3].
Table 2.
Mean SIRS, qSOFA, SOFA and change in SOFA scores in patients who were discharged and patients who expired
| Discharge | Death | P | |||
|---|---|---|---|---|---|
|
|
|
||||
| Mean | SD | Mean | SD | ||
| SIRS score | 2.36 | 1.01 | 2.30 | 0.98 | 0.64 |
| qSOFA Score | 0.93 | 0.62 | 1.32 | 0.78 | <0.01 |
| SOFA score | 3.96 | 2.17 | 5.52 | 2.45 | <0.01 |
| Change in SOFA score | 3.24 | 2.01 | 5.21 | 2.64 | <0.01 |
Table 3.
Association of SIRS, qSOFA, SOFA and change in SOFA score with mortality
| Discharge | Death | P | |||
|---|---|---|---|---|---|
|
|
|
||||
| No. | % | No. | % | ||
| SIRS score | |||||
| 0 | 3 | 75.0 | 1 | 25.0 | |
| 1 | 15 | 55.6 | 12 | 44.4 | 0.89 |
| 2 | 23 | 51.1 | 18 | 40.0 | |
| 3 | 33 | 58.9 | 19 | 33.9 | |
| 4 | 9 | 52.9 | 6 | 35.3 | |
| qSOFA score | |||||
| 0 | 19 | 67.9 | 7 | 25.0 | |
| 1 | 51 | 58.6 | 28 | 32.2 | <0.01 |
| 2 | 13 | 43.3 | 17 | 56.7 | |
| 3 | 0 | 0.0 | 4 | 100.0 | |
| SOFA score | |||||
| 0-3 | 38 | 77.55 | 11 | 22.45 | |
| 4-6 | 32 | 54.24 | 27 | 45.76 | <0.01 |
| 7-9 | 12 | 48.00 | 13 | 52.00 | |
| 10-12 | 1 | 16.70 | 5 | 83.30 | |
| Change in SOFA score | |||||
| <2 | 12 | 85.7 | 2 | 14.3 | |
| ≥2 | 71 | 56.8 | 54 | 43.2 | 0.04 |
qSOFA as a marker of sepsis
The mean qSOFA score was 0.93 ± 0.62 in patients who were discharged and 1.32 ± 0.78 in patients who expired. The difference in mean between the two groups was statistically significant (P value <0.01) [Table 2].
The mortality was significantly more with an increasing qSOFA score with 56.7% mortality in patients with a qSOFA score of two and 100% in patients with a qSOFA score of three [Table 3].
SOFA as a marker of sepsis
SOFA score was calculated for all patients at the time of presentation. If the patients had any previous record of blood investigation/physical assessment within the prior 48 hours of presentation to our emergency, a change in SOFA was also calculated. If no previous records were available, baseline SOFA was assumed to be zero with a score calculated at presentation as the change in SOFA was used to assess the outcome.
The SOFA score at the time of presentation ranged from 0 to 12 with 59 out of 139 patients (42.4%) having a score within the range of 4–6. Both mean SOFA score and mean change in SOFA score were significantly higher in patients who expired as compared to patients who survived and were discharged from the hospital (P value <0.01) [Table 2]. The mean change in SOFA scores was 3.24 ± 2.01 in patients who survived as compared to 5.21 ± 2.64 in patients who died. A higher SOFA score was associated with higher mortality. 83.3% of patients with SOFA scores >10 at the time of presentation expired, while only 19.6% of patients with scores 0–3 expired [Table 3]. This was statistically significant with a P value <0.01.
Similarly, a change in SOFA score ≥2 was associated with higher mortality. 43.2% of patients who had a change in SOFA ≥2 expired, as compared to only 14.3% of patients expired who had a change in SOFA <2. This was statistically significant with a P value of 0.04.
Receiver operating characteristic curves
Receiver Operating Characteristic curves were constructed for SIRS, qSOFA and SOFA scores to identify cut-offs that can predict mortality with optimum sensitivity and specificity [Figure 1 and Table 4].
Figure 1.
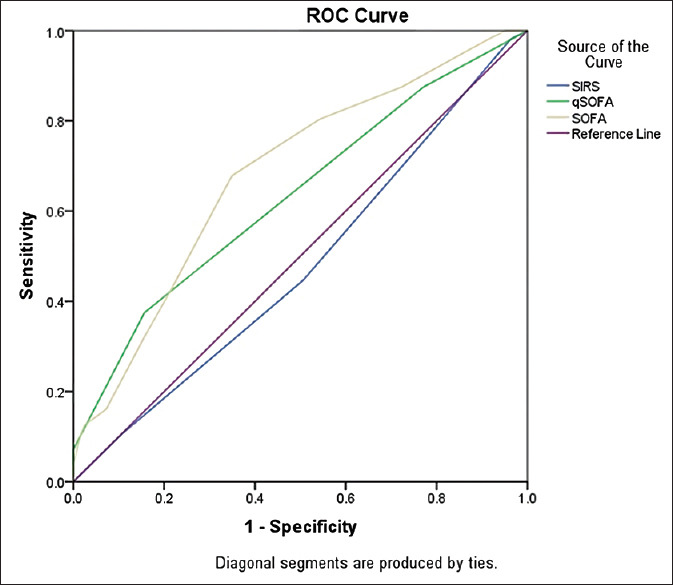
Comparison of the Receiver operating characteristic curves of SOFA scores, qSOFA and SIRS criteria to predict hospital mortality
Table 4.
AUC of SIRS, qSOFA, and SOFA score
| AUC | 95% CI | |
|---|---|---|
| SIRS score | 0.47 | 0.38-0.57 |
| qSOFA score | 0.63 | 0.53-0.73 |
| SOFA score | 0.68 | 0.59-0.77 |
Comparison of SIRS vs qSOFA vs SOFA in the need of intensive care
A comparison was made between the mean of SIRS, qSOFA and SOFA as well as a change in SOFA score with the need for intensive care. The difference in the mean of qSOFA/SOFA and change in SOFA score was significantly higher in patients who were deemed to be requiring intensive care as compared to those not requiring intensive care [Table 5].
Table 5.
Comparison of SIRS/qSOFA/SOFA with the need of intensive care
| Yes (n=79) | No (n=60) | P | |||
|---|---|---|---|---|---|
|
|
|
||||
| Mean | SD | Mean | SD | ||
| SIRS score | 2.35 | 0.95 | 2.32 | 1.08 | 0.87 |
| qSOFA Score | 1.34 | 0.69 | 0.75 | 0.60 | <0.01 |
| SOFA score | 5.14 | 2.41 | 3.87 | 2.22 | 0.01 |
| Change in SOFA score | 4.81 | 2.47 | 3.02 | 2.08 | <0.01 |
DISCUSSION
We conducted a prospective observational study and analysed 139 patients admitted to medical emergencies of a tertiary care hospital with suspected sepsis. The respiratory tract was the most common source of infection followed by the urinary tract. Sharma (35%), Chatterjee (53.3%) and Mohamed (66.25%) also reported the respiratory tract to be the most common source of infection in the Indian setting.[3,7,8]
The overall mortality rate in our study was 40.30%. There was no significant impact of age on mortality in our study. Other studies have also reported higher mortality among sepsis patients. The mortality in the retrospective analysis by Khwannimit et al. was 44.5%.[9] Desai et al.[10] in their study of sepsis in an ICU setting reported a mortality of 48%. Similar high mortality was seen in studies by Mohammed AK (67.5%)[8] and Chatterjee S (62.8%).[3] The reason for the lower rate of mortality in our study could be because of the fact the study subjects were hemodynamically stable at the time of presentation.
Our study validates that the SOFA score and qSOFA score had superior predictive ability as compared to the SIRS score in assessing the outcome in sepsis patients. SOFA score had maximum AUC compared to qSOFA and SIRS [Table 4]. SOFA also had the maximum sensitivity while the qSOFA score had the maximum specificity [Table 6].
Table 6.
Comparison of test characteristics and discriminatory performance for SIRS, qSOFA, SOFA and change in SOFA score for predicting mortality
| Sensitivity | Specificity | PPV | NPV | |
|---|---|---|---|---|
| SIRS score ≥2 | 76.8% (63.6-87.0%) | 21.7% (13.4-32.1%) | 39.8% (35.5-44.3%) | 58.1% (42.5-72.2%) |
| qSOFA score ≥2 | 37.5% (24.9-51.5) | 84.3% (74.7-91.4%) | 61.7% (46.9-74.7%) | 66.7% (61.5-71.4%) |
| SOFA score ≥2 | 98.1% (90.1-99.9%) | 8.43 (3.46-16.61%) | 41.1% (39.3-42.9%) | 87.5% (46.9-98.2% |
| Change in SOFA score ≥2 | 96.3% (87.2-99.5%) | 14.6% (7.7-23.9%) | 42.3% (39.8-44.8%) | 85.7% (58.3-96.3%) |
In our study, the mean SIRS score was 2.30 ± 0.98 in patients who expired and slightly higher in patients who were discharged (2.36 ± 1.01). The difference was not statistically significant. Systemic inflammatory response syndrome had low AUC (0.47) with low sensitivity (76.8) and specificity (21.7). Our findings are similar to other studies published. Khwannimit et al.[9] found SIRS to be having AUC of 0.587 (95% CI: 0.566–0.608). Other studies also had similar findings; Raith et al. AUC 0.589 (99% CI 0.585 to 0.593), Finkelsztein et al. AUC 0.59 (95% CI, 0.51–0.67).[11,12] The predictive mortality for SIRS in the study by Seymour et al.[13] was slightly higher (AUC = 0.64; 95% CI, 0.62–0.66).
As compared to SIRS, we found qSOFA to be significantly higher in patients who expired (1.32 ± 0.78) as compared to those who survived (0.93 ± 0.62). The AUC for qSOFA was 0.63 (95% CI 0.53-0.73). This was similar to other studies by Raith et al. AUC 0.607 (99% CI 0.603 to 0.611), Finkelsztein 0.74 (95% CI 0.66–0.81), Khwannimit et al. 0.814 (95% CI 0.798–0.829).[9,11,12] Sepsis 3 consensus considered that the qSOFA criteria should be used to identify sepsis patients in wards or emergency departments. In our study, we found that sepsis defined as qSOFA ≥2 had high specificity for mortality (84.3%) but had low sensitivity (37.5%).
As we take into consideration previous studies, qSOFA performs better over SIRS criteria in the prediction of mortality but lags behind SOFA score, as observed in our study as well. The mean SOFA score in survivors was 3.96 ± 2.17, which was significantly lower than the mean SOFA score of 5.52 ± 2.45 (P value <0.01) in the patients who expired. The AUC for the SOFA score was 0.68 (95% CI 059-0.77). It had high sensitivity which makes it suitable to use for predicting outcomes for mortality. The change in SOFA score ≥2 had a sensitivity of 96.3% (95% CI 87.2–99.5%). It was significantly associated with mortality as compared to patients who had SOFA <2 (P value <0.05). This is in line with several studies SOFA score could be useful for risk stratification or prediction of mortality in patients with sepsis. Freund et al.[14] reported in their study that for the prediction of in-hospital mortality SOFA had a sensitivity of 73% (95%CI, 61–83%) and a specificity of 70% (95%CI, 67–73%). The AUC for the SOFA score was 0.77 (95% CI, 0.71–0.82) as compared to the AUC of SIRS which was 0.65 (95% CI, 0.59–0.70). Raith et al.[11] in their study found that patients with an increase from baseline in SOFA score of two or more had a greater incremental increase in mortality across all deciles of baseline risk than patients with two or more SIRS criteria or those with a qSOFA score of two or more. Discrimination in in-hospital mortality was significantly higher using SOFA (AUC, 0.753 [99% CI, 0.750–0.757]). Khwannimit et al.[9] showed that the SOFA score within the first 24 h of ICU admission was suitable for predicting ICU mortality with an AUC of 0.879 (0.823–0.855).[9] Rivera-Fernández R et al. studied 17598 consecutive patients with sepsis, where the SOFA score was calculated daily. SOFA score on the first day was higher in non-survivors (8.4 + 4) than in survivors (3.8 + 3.3) with a P value <0.001.[15]
Our study also found that patients who were assessed to be requiring intensive care had higher qSOFA, SOFA and change in SOFA scores at presentation. Similar findings of higher AUC for qSOFA as compared to SIRS (0.74 vs 0.69) were reported by Moskowitz et al.[16] Higher change in SOFA score was also associated with increased length of stay for patients who were discharged in our study.
Another limiting factor in the usage of the SOFA score at the time of presentation is the lack of baseline values to assess the change in the score. sepsis 3 guidelines suggest that the baseline SOFA score can be assumed to be zero in patients not known to have preexisting organ dysfunction. SOFA and SIRS have an advantage in this regard in that no baseline data is required to calculate them. This may be one of the reasons for almost 89.9% of patients in our study to be having a change in SOFA score ≥2, with high sensitivity of 96.3% (95% CI 87.2–99.5%), but low specificity of 14.6% (7.7–23.9%) for predicting mortality. Similarly, Garbero et al.[17] in their study of 184 patients with suspected infection reported that 84.24% of patients had SOFA score ≥2, and had higher sensitivity than qSOFA in predicting unfavorable outcomes.
Another limitation of the usage of the SOFA score is that it requires six different parameters including ABG, Liver function test (LFT) and KFT Arterial Blood Gas (ABG), Liver Function Test (LFT) and Kidney function test (KFT), which may not be readily available in resource-poor settings. Whereas, qSOFA can be calculated bedside which helps in rapid assessment of the patients.
Limitations
The sample size of the present study was small; therefore, the statistical power of the study was low. Only patients who were presenting to the medical emergency were recruited. As a result, the validity of the recommendation was not examined in patients with surgical causes of sepsis. Only patients whose hemodynamic stability was steady at the time of presentation were included in the data set. Hence, our findings may not valid in patients with more severe diseases. We were able to transfer only 20 of the patients to ICUs requiring intensive support. Of the remaining 59 patients who were managed in wards, 42 patients (71.2%) expired as compared to 11 patients out of 20 (55%) who expired in ICUs. Although the difference was not statistically significant (P value - 0.18), still it may have affected the study outcome. This is a major limitation of our study.
CONCLUSION
Both qSOFA score ≥2 and change in SOFA score ≥2 had better ability than SIRS ≥2 in predicting mortality in sepsis patients. Our study confirms the sepsis 3 guidelines and our findings support the use of qSOFA and SOFA scores in defining sepsis.
Financial support and sponsorship
Nil.
Conflicts of interest
There are no conflicts of interest.
REFERENCES
- 1.Lelubre C, Vincent JL. Mechanisms and treatment of organ failure in sepsis. Nat Rev Nephrol. 2018;14:417–27. doi: 10.1038/s41581-018-0005-7. [DOI] [PubMed] [Google Scholar]
- 2.Vincent JL, Marshall JC, Ñamendys-Silva SA, François B, Martin-Loeches I, Lipman J, et al. Assessment of the worldwide burden of critical illness: The intensive care over nations (ICON) audit. Lancet Respir Med. 2014;2:380–6. doi: 10.1016/S2213-2600(14)70061-X. [DOI] [PubMed] [Google Scholar]
- 3.Chatterjee S, Bhattacharya M. Epidemiology of adult-population sepsis in India: A single center 5 year experience. Indian J Crit Care Med. 2017;21:573–7. doi: 10.4103/ijccm.IJCCM_240_17. [DOI] [PMC free article] [PubMed] [Google Scholar]
- 4.Bone RC, Balk RA, Cerra FB, Dellinger RP, Fein AM, Knaus WA, et al. Definitions for sepsis and organ failure and guidelines for the use of innovative therapies in sepsis. Chest. 1992;101:1644–55. doi: 10.1378/chest.101.6.1644. [DOI] [PubMed] [Google Scholar]
- 5.Levy MM, Fink MP, Marshall JC, Abraham E, Angus D, Cook D, et al. 2001 SCCM/ESICM/ACCP/ATS/SIS international sepsis definitions conference. Crit Care Med. 2003;31:1250–6. doi: 10.1097/01.CCM.0000050454.01978.3B. [DOI] [PubMed] [Google Scholar]
- 6.Singer M, Deutschman CS, Seymour CW, Shankar-Hari M, Annane D, Bauer M, et al. The third international consensus definitions for sepsis and septic shock (sepsis-3) JAMA. 2016;315:801–10. doi: 10.1001/jama.2016.0287. [DOI] [PMC free article] [PubMed] [Google Scholar]
- 7.Sharma Z, Bale C, Kakrani A, Dabadghao V. Sequential organ failure assessment score as prognostic marker in critically ill patients in a tertiary care intensive care unit. Int J Med Public Health. 2013;3:155. [Google Scholar]
- 8.Mohamed AS, Mehta A, James P. Predictors of mortality of severe sepsis among adult patients in the medical intensive care unit. Lung India. 2017;34:330–5. doi: 10.4103/lungindia.lungindia_54_16. [DOI] [PMC free article] [PubMed] [Google Scholar]
- 9.Khwannimit B, Bhurayanontachai R, Vattanavanit V. Comparison of the performance of SOFA, qSOFA and SIRS for predicting mortality and organ failure among sepsis patients admitted to the intensive care unit in a middle-income country. J Crit Care. 2018;44:156–60. doi: 10.1016/j.jcrc.2017.10.023. [DOI] [PubMed] [Google Scholar]
- 10.Desai S, Lakhani JD. Utility of SOFA and APACHE II score in sepsis in rural set up MICU. J Assoc Physicians India. 2013;61:608–11. [PubMed] [Google Scholar]
- 11.Raith EP, Udy AA, Bailey M, McGloughlin S, MacIsaac C, Bellomo R, et al. Prognostic accuracy of the SOFA score, SIRS criteria, and qSOFA score for in-hospital mortality among adults with suspected infection admitted to the intensive care unit. JAMA. 2017;317:290–300. doi: 10.1001/jama.2016.20328. [DOI] [PubMed] [Google Scholar]
- 12.Finkelsztein EJ, Jones DS, Ma KC, Pabón MA, Delgado T, Nakahira K, et al. Comparison of qSOFA and SIRS for predicting adverse outcomes of patients with suspicion of sepsis outside the intensive care unit. Crit Care. 2017;21:73. doi: 10.1186/s13054-017-1658-5. [DOI] [PMC free article] [PubMed] [Google Scholar]
- 13.Seymour CW, Liu VX, Iwashyna TJ, Brunkhorst FM, Rea TD, Scherag A, et al. Assessment of Clinical Criteria for Sepsis: For the Third International Consensus Definitions for Sepsis and Septic Shock (Sepsis-3) JAMA. 2016;315:762–74. doi: 10.1001/jama.2016.0288. [DOI] [PMC free article] [PubMed] [Google Scholar]
- 14.Freund Y, Lemachatti N, Krastinova E, van Laer M, Claessens YE, Avondo A, et al. Prognostic accuracy of sepsis-3 criteria for in-hospital mortality among patients with suspected infection presenting to the emergency department. JAMA. 2017;317:301–8. doi: 10.1001/jama.2016.20329. [DOI] [PubMed] [Google Scholar]
- 15.Rivera-Fernández R, Nap R, Vázquez-Mata G, Miranda DR. Analysis of physiologic alterations in intensive care unit patients and their relationship with mortality. J Crit Care. 2007;22:120–8. doi: 10.1016/j.jcrc.2006.09.005. [DOI] [PubMed] [Google Scholar]
- 16.Moskowitz A, Patel PV, Grossestreuer AV, Chase M, Shapiro NI, Berg K, et al. Quick sequential organ failure assessment and systemic inflammatory response syndrome criteria as predictors of critical care intervention among patients with suspected infection. Crit Care Med. 2017;45:1813–9. doi: 10.1097/CCM.0000000000002622. [DOI] [PMC free article] [PubMed] [Google Scholar]
- 17.de Freitas Garbero R, Simões AA, Martins GA, da Cruz LV, von Zuben VGM. SOFA and qSOFA at admission to the emergency department: Diagnostic sensitivity and relation with prognosis in patients with suspected infection. Tur J Emerg Med. 2019;19:106–10. doi: 10.1016/j.tjem.2019.05.002. [DOI] [PMC free article] [PubMed] [Google Scholar]