Abstract
Thaumatin-like proteins (TLPs) are pathogenesis-related proteins with pivotal roles in plant defense mechanisms. In this study, various bioinformatics and RNA-seq methods were used to analyze the biotic and abiotic stress responses of the TLP family in Phyllostachys edulis. Overall, 81 TLP genes were identified in P. edulis; 166 TLPs from four plant species were divided into three groups and ten subclasses, with genetic covariance observed between these species. Subcellular localization in silico studies indicated that TLPs were primarily distributed in the extracellular. Analysis of the upstream sequences of TLPs demonstrated the presence of cis-acting elements related to disease defense, environmental stress, and hormonal responses. Multiple sequence alignment demonstrated that most TLPs possessed five conserved REDDD amino acid sequences with only a few amino acid residue differences. RNA-seq analysis of P. edulis responses to Aciculosporium take, the pathogenic fungus that causes witches’ broom disease, showed that P. edulis TLPs (PeTLPs) were expressed in different organs, with the highest expression in buds. PeTLPs responded to both abscisic acid and salicylic acid stress. These PeTLP expression patterns were consistent with their gene and protein structures. Collectively, our findings provide a basis for further comprehensive analyses of the genes related to witches’ broom in P. edulis.
Keywords: Phyllostachys edulis, thaumatin-like proteins, gene structure, gene expression, witches’ broom disease
1. Introduction
China has the highest distribution of bamboo and is rich in bamboo forest resources, which are vital assets for advancing the country’s forestry economy. Phyllostachys edulis belongs to the Poaceae bamboo subfamily and is a crucial bamboo species with considerably high economic value [1].
Plants use complex mechanisms to protect themselves from pathogens. Thirteen classes of antifungal proteins have been identified based on their functional activities and structural characteristics [2]. Pathogenesis-related (PR) genes are key elements of these mechanisms. PRs are activated in response to pathogenic infections, and regulate the production of several proteins, polypeptides, and compounds that are toxic to pathogens [3]. PR proteins comprise several families with differences in their expression and biological functions. They are primarily divided into 17 groups according to their characteristics [4]. The thaumatin-like protein (TLP) family, also known as the PR protein family 5 (PR5), is a PR family whose expression is induced by certain stresses, such as pest- and disease-dependent stresses [5]. TLPs have been discovered in various organisms including nematodes, insects, fungi, gymnosperms, and angiosperms. Additionally, the typical TLP family protein sequence has a well-defined acidic cleavage domain that includes five conserved amino acids, arginine, glutamic acid (Glu), and three aspartic acid (Asp) residues (REDDD), which are thought to be involved in specific receptor binding and antifungal activities [6]. TLPs can also be activated by bacterial pathogens, plant hormones, and abiotic stresses [7]. BolTLP1 belongs to a group of TLPs that confer tolerance to salt and drought stress in broccoli and exhibit inducible expression under abiotic stress [8]. Furthermore, TLP studies in Arabidopsis thaliana demonstrated that overexpression of BolTLP1 enhances tolerance to drought stress [9]. TLPs belong to the allergen family of pollens and plants [10].
Studies on the biological function of TLPs in various plants have revealed their roles in defense against fungal pathogens. The ClTLP27 TLP was identified in watermelon that significantly inhibits the growth of various fungal pathogens, including Fusarium oxysporum [11]. Alternatively, the PnTLP2 gene isolated from Panax notoginseng is induced by Alternaria panax infection; the corresponding recombinant PnTLP2 protein has antifungal and defense effects [12]. A study on Populus tremula TLP (PtTLP) revealed that although PtTLP itself had no effect on pathogenic fungal strains, transgenic P. tremula with high PtTLP expression showed enhanced resistance to spot disease, and the leaf protein of the PtTLP overexpression model exhibited an apparent inhibitory effect on fungal growth in vitro [13]. Five TLPs (TLP-1, -2, -3, -4, and -5) with antifungal activities were isolated from Medicago truncatula var. truncatula putative. All these proteins exhibited robust antifungal activities against Rhizoctonia solani, Alternaria alternata, Fusarium graminearum, Fusarium solani, Verticillium sp., and Phytophthora spp. [14]. The mechanism underlying the antifungal activity of TLPs involves the expression of β-1,3-glucanase, which interacts with and destroys pathogenic fungal cell walls [15].
Witches’ broom disease caused by Aciculosporium take is highly prevalent in bamboo [16]. In bamboo infected by A. take, apical bud growth is inhibited and early lateral bud germination into branchlets is stimulated, resulting in several lateral branches or axillary buds that form broom-like clusters that affect bamboo growth and even cause bamboo forest decline. Therefore, bamboo TLPs in the PR protein family that have antifungal activity must be systematically analyzed to effectively control witches’ broom in bamboo.
Although TLP genes have been identified and functionally analyzed in many plants, no such studies have been conducted in bamboo. As the whole genome of P. edulis was parsed, we used bioinformatics methods to identify TLP genes in P. edulis and analyzed gene structures, upstream cis-acting elements, chromosomal locations, conserved motifs, interspecific and intraspecific phylogenetic evolution, the three-dimensional (3D) structure of the encoded proteins, gene duplication, and transcriptional expression of these P. edulis TLPs (PeTLPs). This study aimed to comprehensively understand PeTLPs and explore their interactions with P. edulis and fungal invasion, thereby providing a basis for future research.
2. Results
2.1. Identification and Protein Characteristics of PeTLPs
Eighty-one TLP genes were identified from the P. edulis genome database. The expression levels of these genes are listed in Table 1. The TLP sequences ranged from 80–650 base pair. The corresponding molecular weights of these TLPs ranged from 8598.6 Da (PH02Gene08982) to 71,573.6 Da (PH02Gene13259). The isoelectric point values of these PeTLPs ranged from 3.89–8.68 and included 28 basic proteins and 53 acidic proteins. Subcellular prediction results showed that most PeTLPs were determined to be extracellular. PH02Gene35939, PH02Gene13257, and PH02Gene13259 were located in the plasma membrane, PH02Gene11792 in the nucleus, and PH02Gene11793 in the chloroplast.
Table 1.
Detailed information of thaumatin-like proteins (TLPs) identified in Phyllostachys edulis.
| Gene ID | Length (Bp) | MW (Da) | Isoelectric Point (Pi) | Subcellular Localization |
|---|---|---|---|---|
| PH02Gene31536 | 311 | 31,406.8 | 4.88 | Extracellular |
| PH02Gene31537 | 307 | 31,499.0 | 4.41 | Extracellular |
| PH02Gene39670 | 103 | 10,757.1 | 7.34 | Extracellular |
| PH02Gene37845 | 196 | 20,776.4 | 6.21 | Extracellular |
| PH02Gene17081 | 317 | 31,191.4 | 4.25 | Extracellular |
| PH02Gene32525 | 274 | 28,569.2 | 7.90 | Extracellular |
| PH02Gene48120 | 264 | 26,727.6 | 4.39 | Extracellular |
| PH02Gene08982 | 80 | 8598.6 | 8.20 | Extracellular |
| PH02Gene31916 | 275 | 27,777.1 | 4.81 | Extracellular |
| PH02Gene23788 | 253 | 26,059.6 | 7.66 | Extracellular |
| PH02Gene35938 | 180 | 18,320.7 | 5.08 | Extracellular |
| PH02Gene35939 | 460 | 48,872.3 | 6.77 | Plasma membrane |
| PH02Gene46317 | 158 | 17,015.2 | 8.35 | Extracellular |
| PH02Gene24694 | 223 | 23,839.4 | 4.75 | Extracellular |
| PH02Gene38387 | 263 | 27,608.8 | 7.30 | Extracellular |
| PH02Gene11792 | 638 | 69,398.1 | 4.83 | Nucleus |
| PH02Gene11793 | 370 | 38,475.5 | 8.63 | Chloroplast |
| PH02Gene18036 | 207 | 21,692.0 | 4.78 | Extracellular |
| PH02Gene18037 | 136 | 14,624.4 | 5.80 | Extracellular |
| PH02Gene09221 | 161 | 16,556.4 | 4.12 | Extracellular |
| PH02Gene12336 | 203 | 21,151.1 | 7.71 | Extracellular |
| PH02Gene12337 | 184 | 19,016.6 | 4.35 | Extracellular |
| PH02Gene12338 | 215 | 22,254.4 | 8.10 | Extracellular |
| PH02Gene12339 | 208 | 21,533.5 | 6.48 | Extracellular |
| PH02Gene12340 | 213 | 22,002.0 | 6.47 | Extracellular |
| PH02Gene12360 | 214 | 22,082.9 | 6.47 | Extracellular |
| PH02Gene35154 | 138 | 14,714.5 | 5.06 | Extracellular |
| PH02Gene35155 | 172 | 17,936.2 | 8.08 | Extracellular |
| PH02Gene42065 | 168 | 17,421.4 | 4.44 | Extracellular |
| PH02Gene45597 | 170 | 17,323.1 | 4.32 | Extracellular |
| PH02Gene45599 | 180 | 18,343.2 | 4.18 | Extracellular |
| PH02Gene45600 | 184 | 18,808.0 | 4.95 | Extracellular |
| PH02Gene45601 | 156 | 15,938.7 | 3.89 | Extracellular |
| PH02Gene45602 | 178 | 18,157.3 | 7.92 | Extracellular |
| PH02Gene45604 | 172 | 17,564.5 | 4.55 | Extracellular |
| PH02Gene48556 | 244 | 25,343.4 | 8.12 | Extracellular |
| PH02Gene11255 | 322 | 31,715.2 | 4.03 | Extracellular |
| PH02Gene15990 | 341 | 34,912.6 | 4.58 | Extracellular |
| PH02Gene33591 | 315 | 32,954.2 | 4.60 | Extracellular |
| PH02Gene32603 | 180 | 19,607.2 | 7.34 | Extracellular |
| PH02Gene44064 | 133 | 14,217.2 | 8.42 | Extracellular |
| PH02Gene14147 | 320 | 31,644.4 | 5.61 | Extracellular |
| PH02Gene14148 | 327 | 33,093.0 | 4.71 | Extracellular |
| PH02Gene19164 | 258 | 26,369.3 | 5.59 | Extracellular |
| PH02Gene19402 | 142 | 15,262.9 | 4.64 | Extracellular |
| PH02Gene19403 | 167 | 17,698.4 | 4.63 | Extracellular |
| PH02Gene04978 | 194 | 20,939.8 | 6.74 | Extracellular |
| PH02Gene13245 | 298 | 32,260.4 | 7.27 | Extracellular |
| PH02Gene13252 | 643 | 70,479.9 | 7.38 | Extracellular |
| PH02Gene13257 | 607 | 66,805.0 | 7.75 | Plasma membrane |
| PH02Gene13259 | 650 | 71,573.6 | 7.15 | Plasma membrane |
| PH02Gene13265 | 218 | 22,448.2 | 8.28 | Extracellular |
| PH02Gene32549 | 308 | 32,819.8 | 7.46 | Extracellular |
| PH02Gene14610 | 106 | 10,444.6 | 8.68 | Extracellular |
| PH02Gene27897 | 301 | 30,892.5 | 6.81 | Extracellular |
| PH02Gene27899 | 257 | 26,123.8 | 4.31 | Extracellular |
| PH02Gene40419 | 287 | 30,829.8 | 8.02 | Extracellular |
| PH02Gene43141 | 313 | 31,722.3 | 4.62 | Extracellular |
| PH02Gene04661 | 322 | 33,794.7 | 4.60 | Extracellular |
| PH02Gene04669 | 168 | 17,726.9 | 8.36 | Extracellular |
| PH02Gene05114 | 304 | 31,586.1 | 4.61 | Extracellular |
| PH02Gene05115 | 314 | 31,623.1 | 4.87 | Extracellular |
| PH02Gene28313 | 326 | 33,124.9 | 4.47 | Extracellular |
| PH02Gene28314 | 310 | 32,395.1 | 5.31 | Extracellular |
| PH02Gene31888 | 284 | 30,621.7 | 8.22 | Extracellular |
| PH02Gene05023 | 334 | 33,810.0 | 5.03 | Extracellular |
| PH02Gene05024 | 337 | 34,066.3 | 4.55 | Extracellular |
| PH02Gene08781 | 259 | 26,189.2 | 4.39 | Extracellular |
| PH02Gene28355 | 376 | 39,628.9 | 4.42 | Extracellular |
| PH02Gene07087 | 319 | 32,854.0 | 4.36 | Extracellular |
| PH02Gene24099 | 320 | 33,535.0 | 4.93 | Extracellular |
| PH02Gene34215 | 285 | 30,432.4 | 7.90 | Extracellular |
| PH02Gene34852 | 270 | 27,490.5 | 4.62 | Extracellular |
| PH02Gene50388 | 104 | 11,751.2 | 8.19 | Extracellular |
| PH02Gene28872 | 245 | 25,019.8 | 5.66 | Extracellular |
| PH02Gene28874 | 271 | 27,347.4 | 4.63 | Extracellular |
| PH02Gene48321 | 285 | 29,614.1 | 7.85 | Extracellular |
| PH02Gene32892 | 270 | 27,520.5 | 4.62 | Extracellular |
| PH02Gene48998 | 253 | 25,899.9 | 6.82 | Extracellular |
| PH02Gene51133 | 271 | 27,392.4 | 4.83 | Extracellular |
| PH02Gene50762 | 158 | 17,015.2 | 8.35 | Extracellular |
2.2. P. edulis Multiple Sequence Alignment
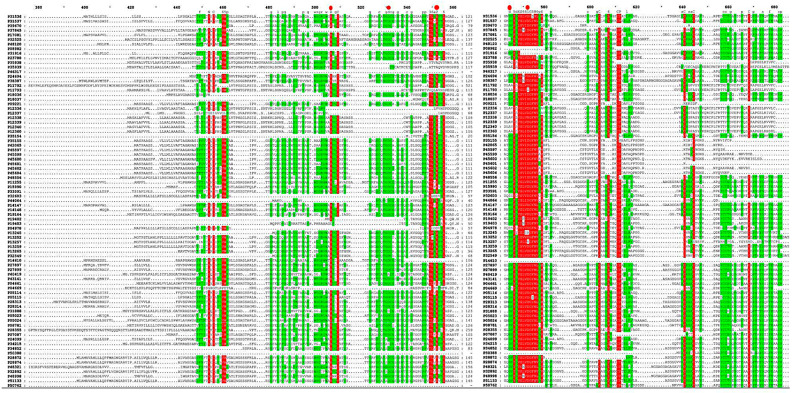
The multiple sequence alignment results for P. edulis showed high conservation among all 81 PeTLP sequences (Figure 1). Specifically, most PeTLPs contained 14 conserved cysteine residues. Most of the identified PeTLPs possessed the typical REDDD amino acid sequence.
Figure 1.
Protein sequence alignment of all identified P. edulis thaumatin-like proteins (PeTLPs). Conserved positions of five amino acids REDDD are labeled with a red dot. The red area is >80% similar and the green area is 50% similar. The gene name numbers correspond to the gene names identified in this study.
2.3. Phylogenetic Analysis, Motifs, and Gene Structure
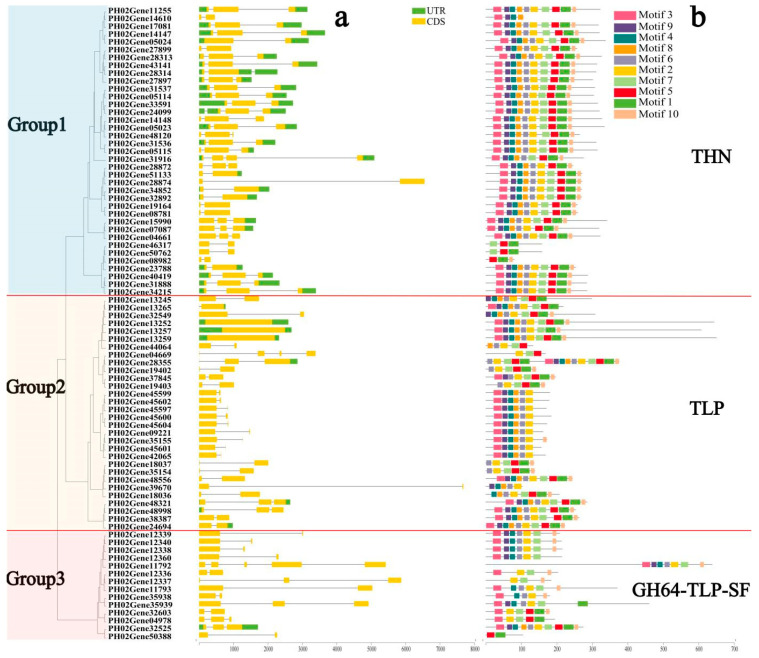
To study the structural diversity of PeTLPs, their exon–intron structures and motif distributions were analyzed. A corresponding phylogenetic tree was constructed using previously identified PeTLP protein sequences, and its evolutionary relationships were evaluated. As shown in Figure 2a, the 81 PeTLPs were divided into three groups (groups 1–3) according to their gene structures and functional characteristics of motifs. Group 1 contained a maximum of 37 members, which was nearly half the total number of genes. In group 1, each gene possessed one intron and at least two coding sequence (CDS) regions. Group 2 genes contained introns and CDS regions. Additionally, most group 2 genes possessed one CDS; however, three PeTLP genes (PH02Gene13252, PH02Gene13257, PH02Gene13259) contained no introns. Group 3 comprised the smallest PeTLP group, with 14 members. In group 3, only one gene (PH02Gene32525) possessed two untranslated regions (UTRs), whereas the remaining genes had no UTRs.
Figure 2.
Phylogenetic tree, gene structures, and conserved motifs of PeTLPs. (a) Phylogenetic tree and gene structures. CDS is indicated by yellow boxes, UTR regions are indicated by green boxes, and the intron is indicated by a black line. The scale at the bottom is in base pair (bp). (b) Motif analysis of PeTLPs. The length of the solid line represents the length of the protein sequences. Colored boxes represent different motifs.
The conserved regions of proteins form the basis of their function. To further reveal the structural diversity and functional characteristics of the PeTLPs, their motif patterns were investigated (Figure 2b). Thaumatin (THN), TLP, and GH64-TLP-SF represent group 1, 2, and 3 TLPs, respectively. Motifs 2 and 3 were detected in most TLP gene sequences. The motifs differed between groups; however, members within the same group tended to exhibit similar motif patterns. For example, in group 1 (THN), motif 5 was identified as a characteristic motif. Motif 2 was a characteristic structure of group 2 (TLP). The group 3 (GH64-TLP-SF) superfamily possessed motif 7, except for PH02Gene50388. These results confirmed that the gene structure and motif patterns influenced phylogenetic diversity.
2.4. Evolutionary Associations between Species
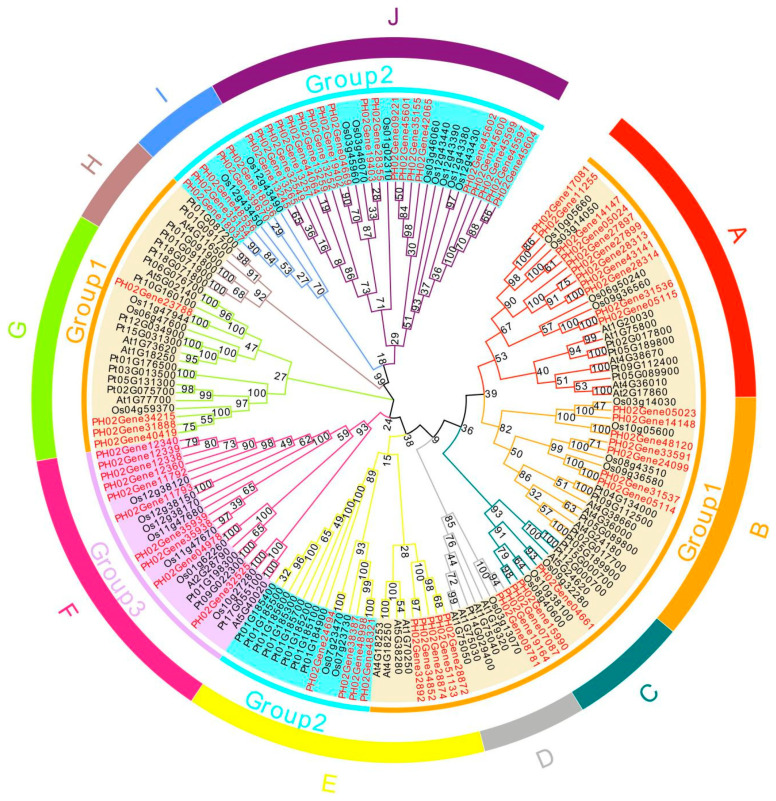
To explore the evolutionary relationships of the TLP family among different species, we collected 166 TLPs from four plant species (P. edulis, A. thaliana, Oryza sativa, and P. tremula) and constructed phylogenetic trees (Figure 3). The corresponding tree results were divided into three large groups and ten subclasses. According to the evolutionary analysis, the TLP gene families of the four species can be divided into ten subclasses (A, B, C, D, E, F, G, H, I, and J) to more precisely demonstrate evolutionary and functional relationships of TLP genes between P. edulis and other species.
Figure 3.
Phylogenetic analysis of TLPs. At: Arabidopsis thaliana; Os: Oryza sativa; Pt: Populus tremula. Different colored branches indicate different subclasses (A, B, C, D, E, F, G, H, I, and J). Genes in red font indicate the PeTLPs. Numbers on the phylogenetic tree represent confidence levels.
We divided PeTLPs into three groups based on their internal evolutionary relationships (Figure 2a). The constructed evolutionary tree of TLP gene families from different species revealed that group 1 and group 2 PeTLP members exhibited changes in their evolutionary relationships and showed a scattered distribution. Group 1 was divided into six subclasses (A, B, C, D, I, and J) and group 2 into three subclasses (E, I, and J) (Figure 3).
Multiple pairs of homologous genes were found among the P. edulis, A. thaliana, O. sativa, and P. tremula TLPs. The largest TLP subclass was J, which contained 28 TLPs, and the smallest was I, which contained only seven members. In addition to subclass H, nine other subclasses comprised TLPs from both P. edulis and other plant species, indicating a close relationship between PeTLPs and TLPs from other species. Among the subclasses, there were homologous relationships between P. edulis, A. thaliana, O. sativa, and P. tremula in six subclasses (A, B, C, E, F, and G). Overall, PeTLPs were primarily distributed in subclasses I, J, and F; however, subclasses I and J only exhibited homology between P. edulis and O. sativa, which were the two species that have been identified to have the highest homology.
2.5. Distribution of PeTLPs on Scaffolds
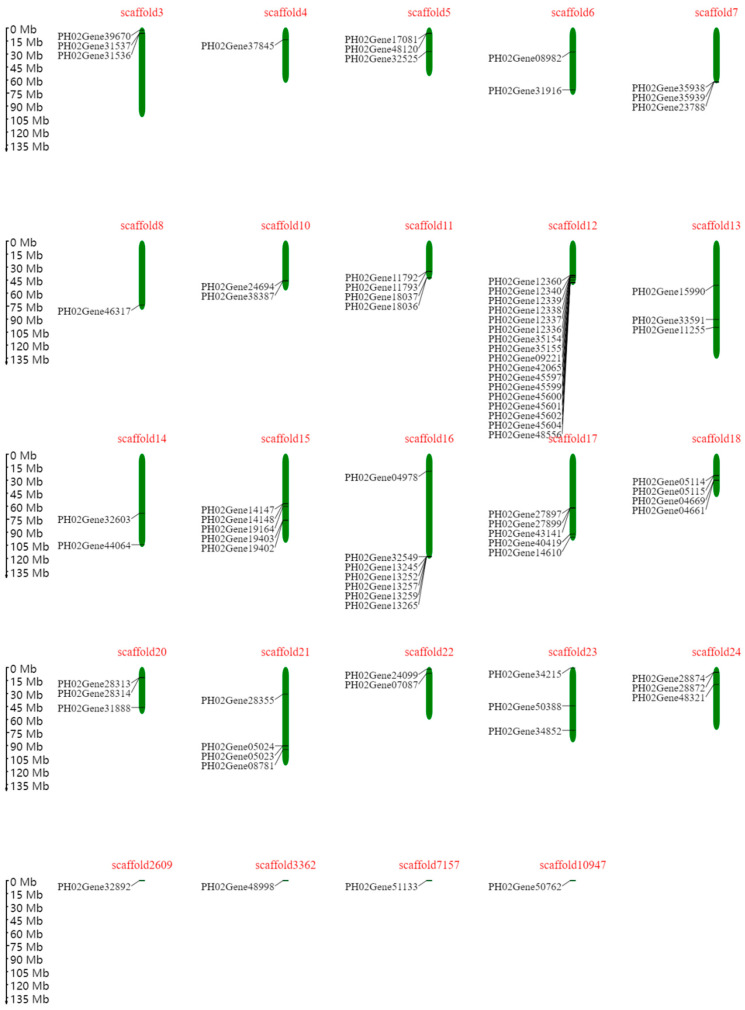
Based on their chromosomal location, PeTLPs were unevenly distributed on P. edulis scaffolds (Figure 4). Scaffold 12 contained the most PeTLPs, with 17 genes, followed by scaffold 16. However, only one PeTLP was present on scaffolds 4, 8, 2609, 3363, 7157, and 10,947.
Figure 4.
Distribution of PeTLP genes on scaffolds in P. edulis. Scaffolds are represented by green bar boxes, and the different horizontal lines on the scaffold represent the genes at different locations. The scaffold numbers are indicated at the top of the scaffolds. The scale on the left is in megabases (Mb).
2.6. Interspecific and Intraspecific Gene Collinearity Analysis
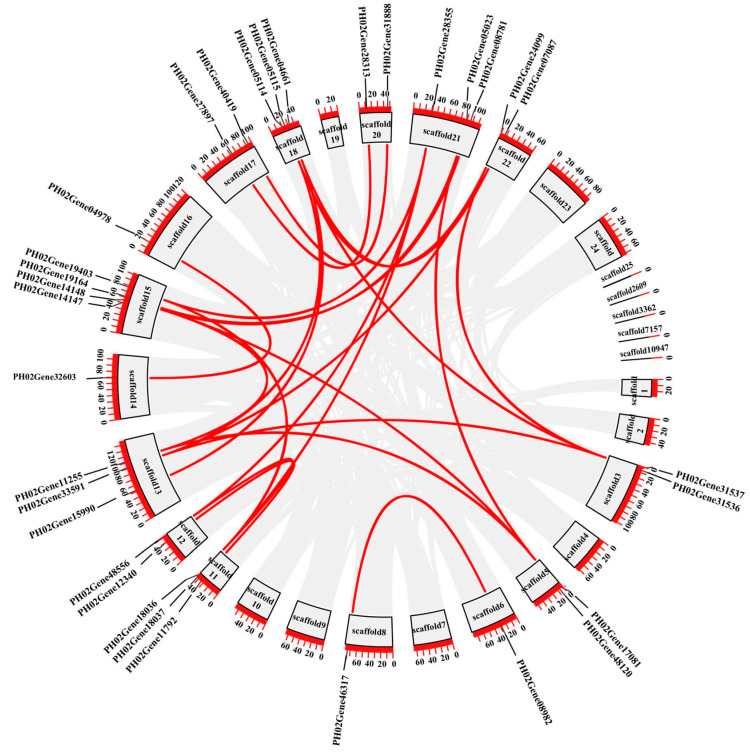
The results of the intraspecific collinearity analysis are shown in Figure 5. In this analysis, a total of 26 collinear gene pairs were obtained. Most collinear relationships occurred on scaffolds with a larger number of genes. Scaffolds 15 and 21 had the largest number of collinear gene pairs, whereas scaffolds 1, 2, 4, 7, 9, 10, 19, 23, 24, and 25 had no collinear gene pairs. These findings suggested that the large-scale duplication of chromosomal segments may have caused the expansion of the PeTLP gene family.
Figure 5.
Collinearity analysis of PeTLPs in P. edulis. The gray line segments indicate all collinearity relationships, and the red line segments indicate collinearity relationships of PeTLPs. The black boxes on the outside represent different scaffolds.
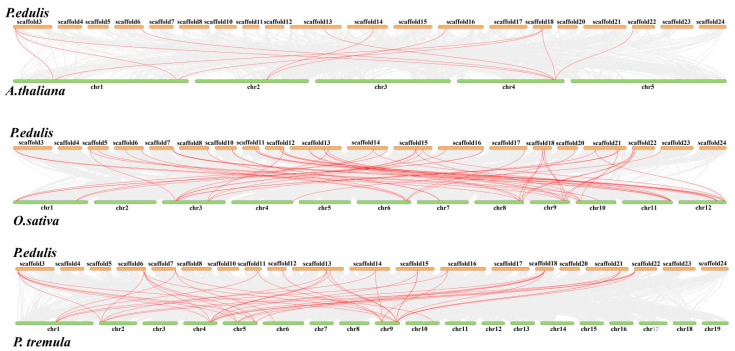
Comparative collinear maps of three representative plants were constructed at a genome level, including one monocotyledon (O. sativa), one dicotyledonous herb (A. thaliana), and one dicotyledonous woody plant (P. tremula), as shown in Figure 6. A total of 47 PeTLP genes exhibited syntenic relationships with those in O. sativa. The numbers of PeTLP genes with syntenic relationships with P. tremula and A. thaliana were 35 and 11, respectively. Scaffold 3 (PH03Gene31537), scaffold 6 (PH03Gene08982), scaffold 13 (PH02Gene11255), and scaffold 14 (PH02Gene32603) were homologous to all three species (Figure 5 and Figure 6).
Figure 6.
Comparative linear relationship of TLPs in P. edulis, A. thaliana, O. sativa, and P. tremula.
Gray lines in the background represent the synteny blocks of P. edulis and other plants, while the red lines highlight the collinearity of TLP gene pairs.
2.7. Detection of cis-Regulatory Elements in PeTLPs
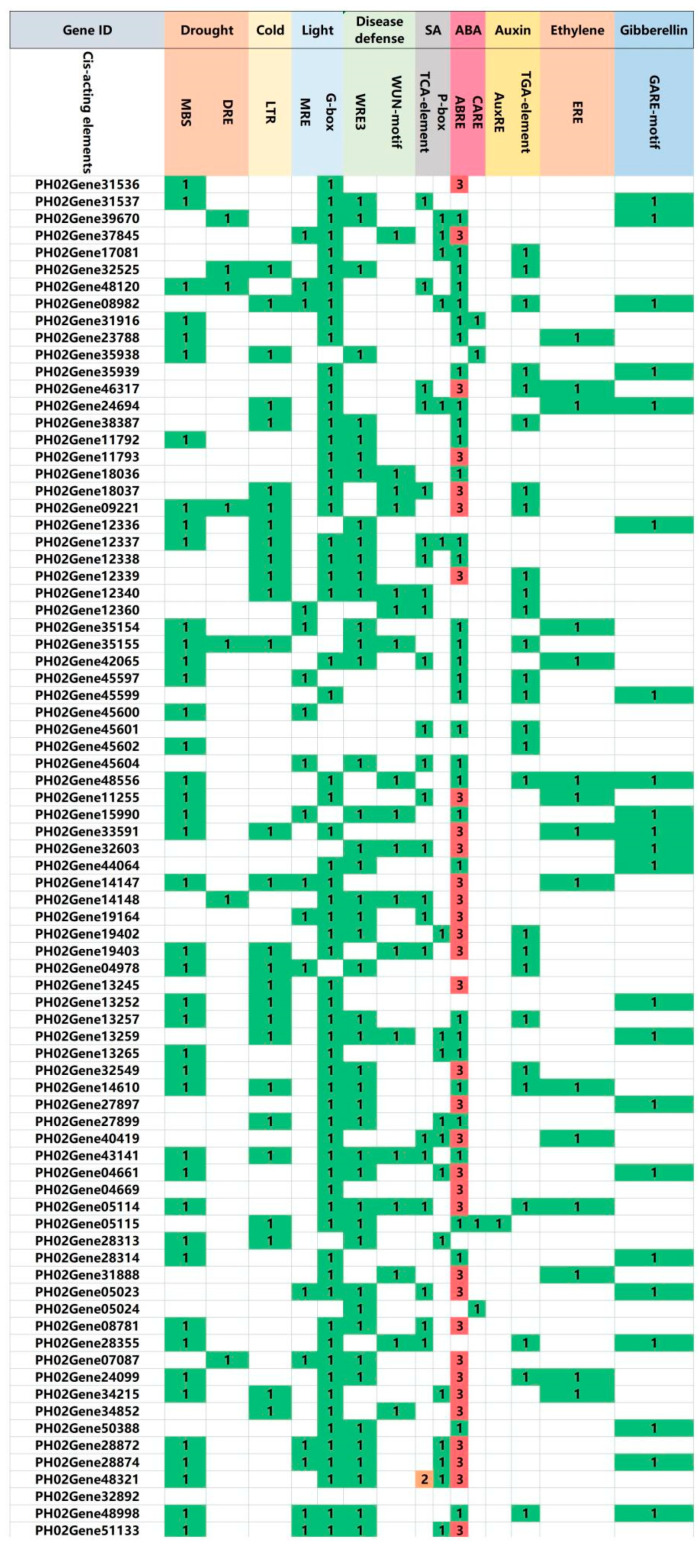
Cis-acting elements play crucial important roles in gene expression and reveal gene function. As shown in Figure S1, 15 representative cis-acting elements were selected. These included seven stress response elements (e.g., drought, cold, disease defense, and light) and eight hormone response elements, such as abscisic acid (ABA), salicylic acid (SA), auxin, gibberellin, and ethylene. As shown in Figure 7, two cis-acting elements were determined to be related to disease defense: WRE3 (51 genes) and the WUN motif (20 genes). Additionally, WUN and WRE3 were detected in 10 genes (PH02Gene05114, PH02Gene09221, PH02Gene12340, PH02Gene13259, PH02Gene14148, PH02Gene15990, PH02Gene18036, PH02Gene19403, PH02Gene35155, and PH02Gene43141). Hormone-related elements were present in a large proportion of the PeTLPs (n = 79). Among the ABA-responsive elements, ABA response elements (ABRE) were present in many genes. Thirty-three genes contained three ABRE elements. PH02Gene05114, PH02Gene05115, PH02Gene08982, PH02Gene34215, PH02Gene40419, PH02Gene46317, PH02Gene48556, and PH02Gene50762 contained four hormone-related elements. Overall, 75 of these genes contained both hormonal and stress response elements. The findings indicate that PeTLPs may play an important role in forming broom-like branches and contribute to the corresponding resistance of P. edulis to witches’ broom.
Figure 7.
Prediction of cis-acting elements in PeTLP promoter regions. The cis elements are indicated by different colored boxes with numbers.
2.8. Transcription and Expression of PeTLPs following Pathogen Infection
TLPs belong to the PR protein family, which primarily contribute to pathogen resistance. The response of bamboo to pathogens at the transcriptome level has not yet been reported. Thus, the transcript profiles of P. edulis in response to A. take infection were determined using ribonucleic acid sequencing (RNA-seq) technology. Overall, messenger ribonucleic acid expression in the apical buds, lateral buds, leaves, and stems of P. edulis was detected after infection with A. take. Healthy tissues were used as controls. A |Log2 fold-change (Log2FC)| > 1 and false discovery rate < 0.05 were the criteria to identify differentially expressed genes (DEGs).
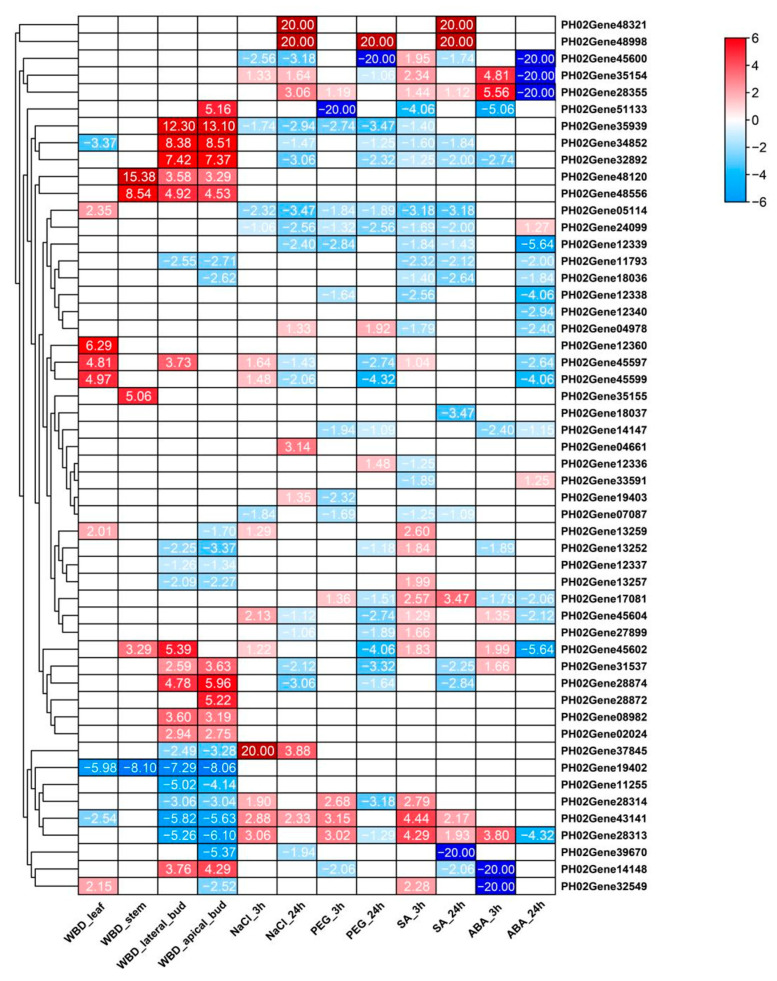
As shown in Figure 8, 12 DEGs were upregulated in both apical and lateral buds, whereas 14 and 10 were downregulated in the apical and lateral buds, respectively. Additionally, six and four DEGs were upregulated in leaves and three and one DEGs were downregulated in stems. A. take predominantly infect bamboo buds, thereby inducing these buds to continuously differentiate to form witches’ brooms. However, this pathogen had minimal interaction with stems and leaves. The results of the present study are consistent with this phenomenon.
Figure 8.
Heatmap of transcriptional expression levels of PeTLPs in P. edulis witches’ broom disease (WBD) within different tissues, and the corresponding response to NaCl, polyethylene glycol (PEG), salicylic acid (SA), and abscisic acid (ABA) stress, expressed as Log2FC values. Blocks with colors indicate the level of upregulation (red) or downregulation (blue). White blocks indicate genes that are not differentially expressed.
The relative expression levels of PH02Gene34852, PH02Gene32892, PH02Gene35939, PH02Gene48556, PH02Gene28874, and PH02Gene28872 were more than four times higher in buds infected with A. take. PH02Gene48556 and PH02Gene48120 were notably upregulated in both buds and stems. Five genes (PH02Gene11255, PH02Gene28313, PH02Gene43141, PH02Gene19402, and PH02Gene31888) were notably downregulated (four times) in infected A. take. In particular, PH02Gene19402 was strongly downregulated in all four plant tissues. These findings indicated that these genes play crucial roles in the response of P. edulis to A. take infection.
2.9. Analysis of PeTLPs Gene Expression in Witches’ Broom Disease Buds via qRT-PCR
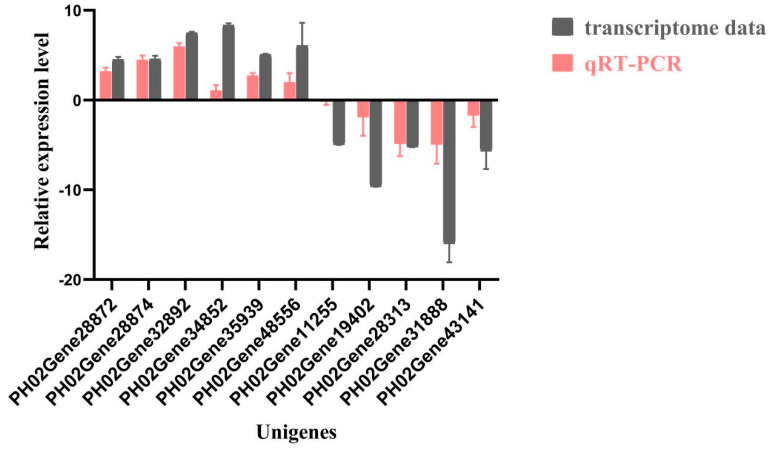
To further investigate the differences in PeTLP expression levels in P. edulis buds after A. take infection, qRT-PCR was performed to verify the expression of 11 transcripts with notably different expression levels (Figure 9). Compared with healthy shoots, the relative expression levels of PH02Gene34852, PH02Gene32892, PH02Gene35939, PH02Gene48556, PH02Gene28874, and PH02Gene28872 were notably higher in diseased bamboo shoots, with the highest expression level observed for PH02Gene32892 (5.96× higher than that in healthy shoots). Contrastingly, the expression levels of PH02Gene11255, PH02Gene28313, PH02Gene43141, PH02Gene19402, and PH02Gene31888 were notably lower in the diseased bamboo shoots. In particular, the expression level of PH02Gene31888 was 4.97× less than that in healthy shoots. Overall, the qRT-PCR results were consistent with the transcriptome data. The comparative statistical analysis results of the gene expression acquired by qRT-PCR and RNA-Seq in healthy and diseased buds were shown in Figure S2.
Figure 9.
Gene expression of identified PeTLPs in the buds after fungal infection. The X-axis indicates the names of the 11 DEGs in bamboo buds, while the Y-axis shows the gene expression level. These values are represented by mean ± SDs, and the line in the bar indicates standard deviations. Brown bars represent transcriptome results, and red bars indicate qRT-PCR results.
2.10. Expression Profiles of PeTLPs in Response to Abiotic Stress
Salt and drought stress treatments were performed at 3 and 24 h using NaCl and polyethylene glycol (PEG), respectively. The leaf PeTLPs expression profile of the transcriptome is shown as a heatmap (Figure 8).
Under NaCl treatment, ten and nine DEGs were upregulated, and five and fourteen DEGs were downregulated at 3 and 24 h, respectively. In the PEG treatment group, five and three DEGs were upregulated, and ten and nineteen DEGs were downregulated at 3 h and 24 h, respectively. As the duration of abiotic stress increased, the number of PeTLPs that mediated the corresponding stress response increased along with an increase in the function of these PeTLPs.
2.11. Expression Profiles of PeTLPs in Response to Phytohormones
Promoter analysis demonstrated that most PeTLPs contained multiple hormone stress response sites. Therefore, we used the transcriptome data of different genes to verify whether their expression levels were induced by SA and ABA treatments (Figure 8).
Under ABA treatment, six and seven DEGs were notably upregulated and downregulated, respectively, at 3 h. PH02Gene28355 displayed the highest expression, followed by PH02Gene35154. In contrast, at 24 h, only two DEGs were upregulated and sixteen DEGs were downregulated. Most DEGs that were upregulated at 3 h were downregulated at 24 h. Additionally, PH02Gene45602 and PH02Gene12339 were notably downregulated.
Next, we evaluated the effects of SA treatment on plant disease resistance. Under SA treatment, fifteen and six DEGs were upregulated at 3 h and fourteen DEGs were downregulated at 24 h. DEGs at 3 h showed almost identical expression patterns to those at 24 h. The findings suggested that pathogen resistance of PeTLPs was mediated by SA.
2.12. Consistency of Expression Pattern and Structure of PeTLPs
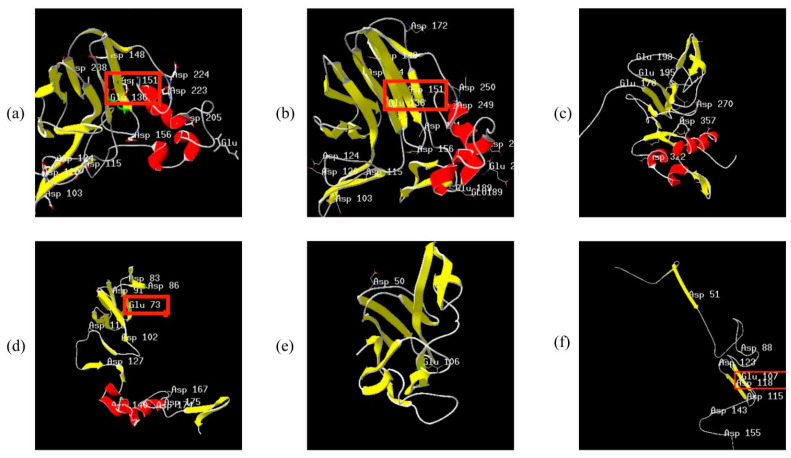
Some genes in the evolutionary tree (Figure 2) within the PeTLP family were in the same branch, which was consistent with the expression of these genes during transcriptome stress and hormone responses (Figure 8). PH02Gene28872, PH02Gene51133, PH02Gene28874, PH02Gene34852, and PH02Gene32892 belonged to the same branch in group 1 and were notably upregulated in the lateral buds following pathogen infection. Contrastingly, none of these genes were notably upregulated or downregulated under other stresses. Representative protein sequences were selected for 3D structure prediction and the best model was determined based on the corresponding evaluation (Figure 10). The primary structures of PH02Gene28872 (Figure 10a) and PH02Gene28874 (Figure 10b) indicated that each protein contained Glu-Asp amino acid residues, with more Asp than Glu. Acidic amino acid residues were conserved in the secondary and 3D structures of edmunds. The corresponding secondary structure analysis determined that this group of proteins included α-helix, β-sheet, and random coil structures. Five conserved acidic sites (Glu136, Asp148, Asp151, Asp238, and Asp103) were present in PH02Gene28872 (Figure 10a) within the β-sheet. In contrast, a variable acidic residue (Asp205) was located under the surface of the α-helix, and the Asp151-Glu136 pair acted as a catalytic center. Interestingly, the same pair of acidic amino acids (Asp151-Glu136) was also found in PH02Gene28874 (Figure 10b) with a Glu/Asp spatial conformation within an antiparallel sheet.
Figure 10.
The 3D structure of TLPs in P. edulis. The red area indicates α-helix, yellow indicates β-sheet, and gray indicates random coil structure. (a) PH02Gene28872. (b) PH02Gene28874. (c) PH02Gene28355. (d) PH02Gene37845. (e) PH02Gene45599. (f) PH02Gene45600.
In group 2, the expression patterns and structures of PH02Gene28355, PH02Gene19402, PH02Gene37845, and PH02Gene19403 were similar. These genes were repressed in response to fungal infection and were less likely to be expressed under hormonal and abiotic stresses. Analysis of their protein structures revealed the presence of three Asp and Glu residues in PH02Gene28355 (Figure 10c). Secondary structure analysis also indicated the presence of α-helix and β-sheet; however, Asp and Glu did not occur in pairs. The same findings were evident in the structure of PH02Gene37845 (Figure 10d) with only one Glu and no paired Asp/Glu. Therefore, we speculate that no catalytically active center existed within these protein structures and this group of proteins could not respond strongly to fungal and abiotic stresses.
Notably, analysis of the protein structures of PH02Gene45599 (Figure 10e) and PH02Gene45600 (Figure 10f) revealed β-sheet structure with no α-helix structure. In these proteins, both Asp and Glu residues were located within this β-sheet. PH02Gene45599, PH02Gene45602, PH02Gene45597, PH02Gene45600, and PH02Gene45604 proteins, which belong to the same branch, exhibited the same trend in transcriptome expression patterns. All these proteins were upregulated in the disease response; additionally, their corresponding expression patterns were almost identically downregulated in the salt, drought, SA, and ABA treatments.
3. Discussion
TLPs have been identified in various plants. These proteins play vital roles in the defense response of plants, as evidenced by the increasing number of studies. However, TLPs vary in quantity across different plants. In this study, 81 TLP genes were identified in P. edulis. Other plants have fewer TLP genes, such as melons (n = 28), grapes (n = 33) [17], and western white pine (n = 10) [18].
Additionally, we mapped PeTLPs to their corresponding scaffolds based on the location information of the P. edulis genome. The PeTLPs were unevenly distributed on the P. edulis scaffolds. Because of the relatively large size of the P. edulis genome, its assembly is not optimal. Many studies have analyzed the evolutionary relationships of TLP families among different species. The 118 TLPs from plants, animals, and fungi have been classified into nine major groups, with five groups containing most of the plant species [6]. Here, we divided the 166 TLP genes from two dicotyledons and two monocotyledons into 10 subclasses (Figure 3). The distribution of TLPs was uneven across plants, suggesting that the expansion of TLPs differs among plant species. For example, only eight TLP genes in O. sativa and 20 PeTLPs were detected in the subclass with the largest number of genes, subclass J. In contrast, subclass H displayed no TLP genes in O. sativa or P. edulis. Interestingly, three TLP genes from A. thaliana (At1G75800, At1G20030, At4G36010) were found in subclass A, which contains members that reportedly participate in the ABA signaling pathway and abiotic stress responses [7]. Thus, members of subclass A may function in abiotic stress pathways. Genes in the same subclass were the closest evolutionarily related genes, with the most similar functions. There were 11 PeTLPs in subclass A, of which two genes were strongly differentially expressed following ABA treatment. Additionally, the functions of unknown PeTLP members can be predicted and verified based on the established functions of TLP gene family members from other species.
Previous studies on the phylogeny of TLPs have suggested that the family of plant TLPs is phylogenetically related and may have originated from the common ancestral genes of gymnosperms and monocots 130 million years ago [19]. Collinear analysis in the present study revealed that O. sativa and P. edulis had the most collinear genes, presumably because they both belonged to the Poaceae family. A previous study identified six tandem-replicated regions and 12 fragment-replicated gene pairs in melon [20], which is consistent with our results. These results suggested that tandem and fragment duplications are common in the TLP family and may be the main drivers of the PeTLP family expansion.
The subcellular localization results demonstrated that most of the proteins were extracellular. Corresponding relevant studies have shown that most barley TLPs are located extracellularly, indicating that they may be involved in seed germination [21]. However, Camellia sinensis TLPs are primarily localized in the cell membrane and notably improve drought resistance in Arabidopsis [22]. Arabidopsis pathogenesis-related 1, a vital defense protein, has been detected in the extracellular space [23]. Protein expression is closely related to its function. Therefore, different proteins have different functions. We speculate that PeTLPs with different subcellular localizations possess different mechanisms of action.
Further analysis indicated that PeTLPs exhibit certain characteristics in terms of intron/exon patterns, motif structures, and phylogenetic relationships. A total of 26 collinear gene pairs were identified. In addition, several genes with tandem duplications were classified into the same group, such as PH02Gene40419 and PH02Gene31888, which were classified in group 1, indicating that they may have originated from recent gene duplications. These results suggest that the tandem duplication of genes was the primary reason for the expansion of PeTLPs. Similar results have been reported in other studies, and exon-intron patterns in the same phylogenetic classification showed considerable similarity [24]. Thus, the present classification results were reliable.
Sequence alignment revealed that PeTLPs contain characteristic cysteine residues and highly conserved REDDD amino acids related to their antifungal activity [20]. Specifically, cysteine residues are thought to be necessary for the high stability of proteins under extreme environmental conditions, whereas REDDD sequences are thought to be involved in maintaining the proper topology and surface electrostatic potential around acid cleavage. These properties are likely critical for the antifungal ability of PeTLPs [25].
Two acidic amino acid residues, Glu and Asp, are considered nucleophiles and proton donors for glycosidic bond cleavage. Glu/Asp-Glu/Asp is the active center of TLPs, with an antiparallel sheet spatial conformation [26]. The 3D structure of the protein predicted in the present study was determined to possess a catalytically active center for Glu–Asp, and the β-sheet of these genes was highly responsive to the pathogen. These findings were consistent with the transcriptome results, which indicated that this gene was activated during infection, confirming the antifungal activity of PeTLPs. In contrast, PH02Gene28355 and PH02Gene37845 did not contain a paired Glu/Asp; therefore, these proteins could not be activated in response to the disease. Interestingly, the evolutionary tree of the PeTLP family demonstrated that some genes belonging to the same branch had the same expression trend as the branches of biotic and abiotic stress responses. Therefore, we hypothesized that structural similarity might also lead to the same functional and stress responses.
The analysis of cis-acting elements revealed that most genes contained domains related to pathogen defense, such as the WRE3 and WUN motif. The cis-acting elements of TLPs demonstrate that these proteins respond to biotic and abiotic stresses [27]. We speculated that PeTLPs play a vital role in the defense against A. take. This is consistent with the results of the antifungal activity in a previous protein comparison experiment. A similar set of elements was found in the promoters of Gossypium barbadense TLPs, and different elements in the promoter region of GbTLPs have been suggested to play pivotal roles in abiotic stress and hormonal responses [28]. PH02Gene28874 and PH02Gene28872 contained WRE3 cis-acting elements. Furthermore, PH02Gene34852 and PH02Gene48556 possessed a WUN motif, which was consistent with the transcriptional expression levels of witches’ broom disease in P. edulis. Simultaneously, these genes were significantly upregulated in disease response transcriptional data.
Transcriptional analysis of fungal infections showed that most PeTLPs were tissue-specific and upregulated (Figure 8). Additionally, more upregulated genes were observed in the buds. The expression levels of PH02Gene34852, PH02Gene35939, PH02Gene48556, PH02Gene28874, and PH02Gene28872 were upregulated, which was consistent with the understanding that these genes contain disease response-related cis-acting elements. Previous studies have established that the occurrence of witches’ broom in plants is caused by changes in plant hormones, especially auxin, which leads to the germination of plant axillary buds and ultimately exhibits characteristic clustering symptoms [29]. These observations were consistent with the results of transcriptome sequencing in the present study, which showed that both the lateral and apical buds contained upregulated genes. Infection with A. take resulted in a stronger induction of the expression of PeTLPs in the buds than in stems and leaves. The collective findings indicated that the formation of arbuscular symptoms was primarily caused by bud infection, and pathogenic fungi predominantly existed within the buds. In contrast, little or no infection occurred in the stems and leaves.
ABA is a plant hormone which has a vital role in plant growth and development and is regulated by fungal infections in host plants [30]. ABA integrates stress signals to control stress responses and enables plants to adapt to various stress environments [31]. The analysis of cis-acting elements indicated that almost all PeTLPs contain ABA-responsive elements, such as ABRE and CARE promoter elements, with ABRE being the most abundant cis-acting element within these PeTLPs. One ABRE-responsive element was detected in PH02Gene35154, and PH02Gene33591, PH02Gene37845, PH02Gene46317, and PH02Gene44064 each possessed three ABREs (Figure 7). The heatmap of the hormone response (Figure 8) demonstrated that PH02Gene35154 was significantly upregulated after 3 h of ABA stress and PH02Gene33591 was significantly upregulated after 24 h of ABA stress. These findings indicate that these genes could be actively involved in the ABA stress response, corresponding to the promoter analysis results.
Fungal-mediated biotic stress activates the plant immune system by sensing pathogen-associated signals to induce SA signaling and upregulate PR genes [32]. As shown in Figure 8, the upregulated genes were notably expressed at 3 and 24 h after SA treatment. For example, PH02Gene48321 was notably upregulated, and the corresponding cis element results indicated that this gene contained two TCA elements, which was consistent with the SA response. Overall, the expression profiles under SA and ABA stress revealed that PeTLPs were associated with plant disease resistance.
TLP genes could potentially be used as molecular markers of fungal disease resistance [33]. Therefore, our results can be used in breeding studies to improve the resistance of P. edulis to witches’ broom.
Numerous studies on the biological roles of TLPs have demonstrated their antifungal activity. However, details regarding their functions in new species and specific individuals remain uncertain. Therefore, further studies on PeTLPs are required to better understand the roles of these molecules in P. edulis.
4. Materials and Methods
4.1. Plant Materials
In this study, a 5-year-old P. edulis was cultivated at the experimental base of Sichuan Agricultural University, Ya’an City, Sichuan Province, China (29°58′40″ N, 103°0′13″ E). The P. edulis in this experimental base was partially inoculated with A. take two years ago and is now in the peak period of witches’ broom disease. The bamboo in which the witches’ broom symptoms appeared was used as a disease group. The apical buds of white fruiting bodies of A. take with obvious arbuscular symptoms, lateral buds without white fruiting bodies at the lower ends of the arbuscular branches, leaves on the arbuscular branches, and first and second stems at the end of the arbuscular branches were collected in mid-April. Bamboo tissue without arbuscular branches in whole plant was used as a control. All the treatments were conducted in triplicate, and all the samples were stored at −80 °C for RNA-seq and qRT-PCR analysis.
4.2. Acquisition of P. edulis Genome Information
The genome and protein sequences of P. edulis were downloaded from the BambooGDB database (http://www.bamboogdb.org/ (accessed on 1 September 2022)) and saved in cds, genome, gff, and pep formats.
4.3. Identification Analysis
To identify TLP genes, the Hidden Markov Model (HMM) search method was used. HMMSEARCH was used with a threshold e-value < 0.001. Thereafter, we used a species-specific HMM to search for domains, proteins, and cds sequences.
Sequences obtained from the HMM search were screened and identified according to the definition of the thaumatin domain (ID: PF00314) in the Pfam database (http://pfam.xfam.org/ (accessed on 1 September 2022)). The TLP domain sequence was confirmed using the Conserved Domain Database (CDD; https://www.ncbi.nlm.nih.gov/cdd/ (accessed on 1 September 2022)) and a reliable P. edulis TLP gene sequence was obtained.
4.4. Analyses of Protein Properties of PeTLPs
ExPASy (https://web.expasy.org/protparam/ (accessed on 10 September 2022)) [34] was used to predict the characteristics of the PeTLPs, including length, isoelectric point (pI), and molecular weight (MW). CELLO (http://cello.life.nctu.edu.tw/ (accessed on 10 September 2022)) [35] was used to predict the subcellular localization of the proteins.
4.5. Motif, Gene Structure, and Scaffold Location Analyses
PeTLP motifs were identified using the MEME tool (http://meme-suite.org/ (accessed on 22 September 2022)) with the default parameter settings of maximum number of motifs = 50 and minimum number of motifs = 10. The corresponding results were shown using TBtools [36]. NCBI-CDD (https://www.ncbi.nlm.nih.gov/cdd (accessed on 22 September 2022)) was used to analyze motif function.
Exon–intron structures were mapped using the Gene Structure Display Server software (http://gsds.gao-lab.org/ (accessed on 22 September 2022)) according to the P. edulis TLP transcript ID [37].
We used the location information file of the PeTLP gene on the scaffolds, the genome scaffold length file, and MapChart software for figure construction to obtain the physical location information of the genes on the scaffolds.
4.6. Cis-Regulatory Element Analysis
We obtained the position information of the PeTLP genes on the chromosome using a Linux system and then extracted the promoter information based on the location information. Cis-acting element analysis was performed using the PlantCARE database (http://bioinformatics.psb.ugent.be/webtools/plantcare/html/ (accessed on 12 October 2022)). Finally, we submitted the gene and feature beds to the GSDS website (http://gsds.cbi.pku.edu.cn/ (accessed on 12 October 2022)) to map the cis-acting elements of the genes [38].
4.7. Phylogenetic Tree Construction and Synteny Analysis of PeTLP Genes
ClustalW was used for multiple sequence alignment to evaluate the evolutionary relationships of the TLP genes in P. edulis using default parameters [39], and Molecular Evolutionary Genetics Analysis (MEGA) was used to construct a maximum likelihood phylogenetic tree [40]. The amino acid substitution model chosen was WAG + I + G4. The PeTLP collinear gene files were uploaded to TBtools software to produce the corresponding collinear circle map.
4.8. Multiple Sequence Alignment
PeTLP sequences were aligned using MEGA7 software. The results were edited using GeneDoc software (http://www.psc.edu/biomed/genedoc/ (accessed on 2 November 2022)).
4.9. Evolutionary Relationship and Collinearity Analysis of Different Species
The TLP amino acid sequences identified in three species (A. thaliana, O. sativa, and P. tremula) were obtained from NCBI. ClustalW 2.0.10 software was used to compare multiple amino acid sequences between PeTLPs and TLP proteins in other plant species. A phylogenetic tree was constructed using the neighbor-joining method with MEGA 7.0 software. The phylogenetic tree was edited using EvolView (https://www.evolgenius.info (accessed on 2 November 2022)).
Genome-wide replication events were obtained using the One Step MCScanX module in TBtools 1.1047 software to determine the gene replication relationships of PeTLPs. A genome-wide collinearity analysis was performed for P. edulis with A. thaliana, O. sativa, and P. tremula. The “Amazing Super Circos” package was used to visualize gene localization and linear relationships on the respective chromosomes [41].
4.10. Transcriptomic Data Sets to Analyze Expression Patterns of PeTLPs in Response to Phytohormones and Abiotic Stress
We obtained publicly available transcriptome data from NCBI (https://www.ncbi.nlm.nih.gov/geo/query/acc.cgi?acc=GSE169067 (accessed on 2 December 2022)) to determine the gene expression profiles of PeTLPs under different stresses. In the present study, transcriptome data were obtained from the expression levels of leaf PeTLPs under SA, ABA, NaCl, and PEG stress at different time points. Data were normalized to fragments per kilobase of transcript per million mapped reads. To calculate the Log2FC value of genes, clustering [42], and normalization analysis, a heatmap of the relative PeTLPs expression levels was generated using the Lianchuan Biological Cloud Platform (https://www.omicstudio.cn/index (accessed on 2 December 2022)).
4.11. Expression Pattern of PeTLPs in Pathogen Infection
Total RNA was extracted using TRIzol reagent (AG, Hunan, China) according to the manufacturer’s instructions, RNA samples with high quality were determined using an Agilent 2100 Bioanalyzer system (Santa Clara, CA, USA). The Illumina platform was used for transcriptome analysis by employing a 150-bp paired-end library according to the manufacturer’s instructions (San Diego, CA, USA). Each sample was paired-end sequenced with an Illumina HiSeq 4000 platform. Low-quality reads were filtered. The sequencing data were compared to the reference species P. edulis. Differential genes between samples were analyzed using the R package edgeR. A |Log2 fold-change (Log2FC)| > 1 and false discovery rate < 0.05 were the criteria to identify differentially expressed genes (DEGs). A heatmap of transcriptional expression levels of differentially significant expression PeTLPs in P. edulis with witches’ broom disease was generated by Heatmapper and expressed as Log2FC values [43].
4.12. Protein Structure Prediction
Gene sequences were selected using the results of transcriptome analysis to construct a 3D protein model on the SWISS-MODEL website (https://swissmodel.expasy.org/ (accessed on 12 December 2022)) [44]. The generated model was assessed using SAVES software (https://saves.mbi.ucla.edu/ (accessed on 12 December 2022)) before being used. The corresponding PDB files were downloaded and submitted to the evaluation software, which simultaneously provided six software evaluation results. Three of the results showed whether the model was available. Multiple software packages were used to determine whether the model was good or bad, and Swiss PDB Viewer was used to visualize the protein structure.
4.13. Gene Expression Analysis
P. edulis samples were stored at −80 °C, and RNA was extracted from the bamboo buds using the commonly used TRIzol method. The presence of RNA was determined by 1% agarose gel electrophoresis. The bands and quantity and purity of the total RNA were analyzed using a Bioanalyzer 2100 and RNA 6000 Nano LabChip Kit (Agilent, San Diego, CA, USA, 5067-1511). We selected RNA that met the requirements and used the EvoM-MLV Reverse Transcription Kit II (Accurate, Shenzhen, China) to synthesize complementary deoxyribose nucleic acid (cDNA) from RNA and observed the cDNA bands using agarose gel electrophoresis. The final high-quality cDNA was stored in a −20 °C freezer until quantitative real-time PCR (qRT-PCR) analysis.
Primer Premier 5 software [45] was used to design the gene-specific primers. Glyceraldehyde 3-phosphate dehydrogenase was used as the reference gene [46]. All gene primers used in the qRT-PCR analysis are listed in Table S1. Tissue testing for each variety was performed using three biological and three technical replicates. For PCR, 20 µL of PCR mix was prepared using 10 µL SYBR Green ProTaq HS Premix (Accurate), 8.2 µL of water, 0.8 µL of each primer, and 1 µL of cDNA template. The PCR conditions were 95 °C for 30 s followed by 40 cycles of 95 °C for 5 s and 60 °C for 30 s. PCR amplification of target genes was performed in a 96-well optical reaction plate using a real-time PCR system (Roche, Basel, Switzerland). The specificity was verified by melting curve analysis of the qRT-PCR products, and the relative expression levels of different genes were determined using the 2−∆∆CT method [47].
5. Conclusions
We identified 81 TLP genes in the P. edulis genome. PeTLP genes were distributed across 24 scaffolds that were potentially derived from segment duplications during evolution. These genes were classified into three groups and ten subclasses based on the constructed intraspecific and interspecific phylogenetic trees. PeTLP gene promoters were found to contain multiple cis-acting elements associated with hormone and stress responses, which were consistent with the expression pattern of PeTLPs in P. edulis with witches’ broom disease, along with hormone, salt, or drought stress. These PeTLP expression patterns were consistent with the corresponding gene and protein structures. Overall, our findings provide a basis for further functional characterization of PeTLP genes and may be helpful for breeding P. edulis species with disease resistance or enhanced resistance to various abiotic stressors.
Supplementary Materials
The following supporting information can be downloaded from https://www.mdpi.com/article/10.3390/ijms241210257/s1.
Author Contributions
Conceptualization, Y.G. and X.M.; methodology, H.Y. and Y.G.; software, Y.G.; and validation, S.H.; formal analysis, P.Z.; investigation, Y.G. and H.Y.; resources, Y.G.; data curation, Y.G.; writing—original draft preparation, H.Y.; writing—review and editing, Y.G. and X.M.; visualization, H.Y.; supervision, Y.G.; project administration, X.M.; funding acquisition, X.M. All authors have read and agreed to the published version of the manuscript.
Institutional Review Board Statement
Not applicable.
Informed Consent Statement
Not applicable.
Data Availability Statement
The original contributions presented in the study are included in the article/Supplementary Material, and further inquiries can be directed to the corresponding authors. All the reads of witches’ broom disease bamboo tissues by RNA-Seq were deposited in National Center for Biotechnology Information (NCBI) SRA repository with accession number PRJNA980656.
Conflicts of Interest
The authors declare no conflict of interest.
Funding Statement
Bamboo Disease and Insect Pest Investigation Project of Laojunshan National Nature Reserve (SCCGLJS002).
Footnotes
Disclaimer/Publisher’s Note: The statements, opinions and data contained in all publications are solely those of the individual author(s) and contributor(s) and not of MDPI and/or the editor(s). MDPI and/or the editor(s) disclaim responsibility for any injury to people or property resulting from any ideas, methods, instructions or products referred to in the content.
References
- 1.Walter L. Bamboo and Rattan in the World. J. Bamboo Ratt. 2003;2:12–15. [Google Scholar]
- 2.Selitrennikoff C.P. Antifungal proteins. Appl. Environ. Microbiol. 2001;67:2883–2894. doi: 10.1128/AEM.67.7.2883-2894.2001. [DOI] [PMC free article] [PubMed] [Google Scholar]
- 3.Stintzi A., Heitz T., Prasad V., Wiedemann-Merdinoglu S., Kauffmann S., Geoffroy P., Legrand M., Fritig B. Plant ‘pathogenesis-related’ proteins and their role in defense against pathogens. Biochimie. 1993;75:687–706. doi: 10.1016/0300-9084(93)90100-7. [DOI] [PubMed] [Google Scholar]
- 4.Sels J., Mathys J., De Coninck B.M., Cammue B.P., De Bolle M.F. Plant pathogenesis-related (PR) proteins: A focus on PR peptides. Plant Physiol. Biochem. 2008;46:941–950. doi: 10.1016/j.plaphy.2008.06.011. [DOI] [PubMed] [Google Scholar]
- 5.Zhao J.P., Su X.H. Patterns of molecular evolution and predicted function in thaumatin-like proteins of Populus trichocarpa. Planta. 2010;232:949–962. doi: 10.1007/s00425-010-1218-6. [DOI] [PubMed] [Google Scholar]
- 6.Liu J., Sturrock R., Ekramoddoullah A.K.M. The superfamily of thaumatin-like proteins: Its origin, evolution, and expression towards biological function. Plant Cell Rep. 2010;29:419–436. doi: 10.1007/s00299-010-0826-8. [DOI] [PubMed] [Google Scholar]
- 7.Park E.J., Kim T.H. Thaumatin-like genes function in the control of both biotic stress signaling and ABA signaling pathways. Biochem. Biophys. Res. Commun. 2021;567:17–21. doi: 10.1016/j.bbrc.2021.06.012. [DOI] [PubMed] [Google Scholar]
- 8.He L., Li L., Zhu Y., Pan Y., Zhang X., Han X., Li M., Chen C., Li H., Wang C. BolTLP1, a Thaumatin-like Protein Gene, Confers Tolerance to Salt and Drought Stresses in Broccoli (Brassica oleracea L. var. Italica) Int. J. Mol. Sci. 2021;22:11132. doi: 10.3390/ijms222011132. [DOI] [PMC free article] [PubMed] [Google Scholar]
- 9.Chen W.L.F.Z. Arabidopsis Di 19 Functions as a Transcription Factor and Modulates PR1, PR2, and PR5 Expression in Response to Drought Stress. Mol. Plant. 2013;16:12–15. doi: 10.1093/mp/sst031. [DOI] [PubMed] [Google Scholar]
- 10.Breiteneder H. Thaumatin-like proteins—A new family of pollen and fruit allergens. Allergy. 2004;59:479–481. doi: 10.1046/j.1398-9995.2003.00421.x. [DOI] [PubMed] [Google Scholar]
- 11.Zhang M., Xu J., Liu G., Yang X. Antifungal properties of a thaumatin-like protein from watermelon. Acta Physiol. Plant. 2018;40:186. doi: 10.1007/s11738-018-2759-8. [DOI] [Google Scholar]
- 12.Li X., Li S., Qiu B., Zhang Y., Cui X., Ge F., Liu D. Thaumatin-like protein genes of Panax notoginseng confers resistance to Alternaria panax. Physiol. Mol. Plant Pathol. 2020;112:101537. doi: 10.1016/j.pmpp.2020.101537. [DOI] [Google Scholar]
- 13.Sun W., Zhou Y., Movahedi A., Wei H., Qiang Z. Thaumatin-like protein(Pe-TLP)acts as a positive factor in transgenic poplars enhanced resistance to spots disease. Physiol. Mol. Plant Pathol. 2020;112:101512. doi: 10.1016/j.pmpp.2020.101512. [DOI] [Google Scholar]
- 14.Saeidi M., Zareie R. Prediction, isolation, overexpression and antifungal activity analysis of Medicago truncatula var. truncatula putative thaumatin like proteins (TLP-1, -2, -3, -4 and -5) Turk. J. Biol. 2020;44:176–187. doi: 10.3906/biy-1912-18. [DOI] [PMC free article] [PubMed] [Google Scholar]
- 15.Grenier J., Potvin C., Trudel J., Asselin A. Some thaumatin-like proteins hydrolyse polymeric beta-1,3-glucans. Plant J. 1999;19:473–480. doi: 10.1046/j.1365-313X.1999.00551.x. [DOI] [PubMed] [Google Scholar]
- 16.Tanaka E., Tanaka C., Ishihara A., Kuwahara Y., Tsuda M. lndole-3-acetic acid biosynthesis in Aciculosporium take, a causal agent of witches’ broom of bamboo. J. Gen. Plant Pathol. 2003;69:1–6. doi: 10.1007/s10327-002-0002-2. [DOI] [Google Scholar]
- 17.Yan X., Qiao H., Zhang X., Guo C., Wang M., Wang Y., Wang X. Analysis of the grape (Vitis vinifera L.) thaumatin-like protein (TLP) gene family and demonstration that TLP29 contributes to disease resistance. Sci. Rep. 2017;7:4269. doi: 10.1038/s41598-017-04105-w. [DOI] [PMC free article] [PubMed] [Google Scholar]
- 18.Liu J., Zamani A., Ekramoddoullah A.K.M. Expression profiling of a complex thaumatin-like protein family in western white pine. Planta. 2010;231:637–651. doi: 10.1007/s00425-009-1068-2. [DOI] [PubMed] [Google Scholar]
- 19.Shatters R.J., Boykin L.M., Lapointe S.L., Hunter W.B., Weathersbee A.R. Phylogenetic and structural relationships of the PR5 gene family reveal an ancient multigene family conserved in plants and select animal taxa. J. Mol. Evol. 2006;63:12–29. doi: 10.1007/s00239-005-0053-z. [DOI] [PubMed] [Google Scholar]
- 20.Liu Y., Cui J., Zhou X., Luan Y., Luan F. Genome-wide identification, characterization and expression analysis of the TLP gene family in melon (Cucumis melo L.) Genomics. 2020;112:2499–2509. doi: 10.1016/j.ygeno.2020.02.001. [DOI] [PubMed] [Google Scholar]
- 21.Iqbal I., Tripathi R.K., Wilkins O., Singh J. Thaumatin-Like Protein (TLP) Gene Family in Barley: Genome-Wide Exploration and Expression Analysis during Germination. Genes. 2020;11:1080. doi: 10.3390/genes11091080. [DOI] [PMC free article] [PubMed] [Google Scholar]
- 22.Muoki R.C., Paul A., Kaachra A., Kumar S. Membrane localized thaumatin-like protein from tea (CsTLP) enhanced seed yield and the plant survival under drought stress in Arabidopsis thaliana. Plant Physiol. Biochem. 2021;163:36–44. doi: 10.1016/j.plaphy.2021.03.012. [DOI] [PubMed] [Google Scholar]
- 23.Pecenkova T., Pleskot R., Zarsky V. Subcellular Localization of Arabidopsis Pathogenesis-Related 1 (PR1) Protein. Int. J. Mol. Sci. 2017;18:825. doi: 10.3390/ijms18040825. [DOI] [PMC free article] [PubMed] [Google Scholar]
- 24.Jami S.K., Swathi A.T., Guruprasad L., Kirti P.B. Molecular, biochemical and structural characterization of osmotin-like protein from black nightshade (Solanum nigrum) J. Plant Physiol. 2007;164:238–252. doi: 10.1016/j.jplph.2006.01.006. [DOI] [PubMed] [Google Scholar]
- 25.Min K., Ha S.C., Hasegawa P.M., Bressan R.A., Yun D.J., Kim K.K. Crystal structure of osmotin, a plant antifungal protein. Proteins. 2004;54:170–173. doi: 10.1002/prot.10571. [DOI] [PubMed] [Google Scholar]
- 26.Ghosh R., Chakrabarti C. Crystal structure analysis of NP24-I: A thaumatin-like protein. Planta. 2008;228:883–890. doi: 10.1007/s00425-008-0790-5. [DOI] [PubMed] [Google Scholar]
- 27.Su L., Zhao X., Geng L., Fu L., Lu Y., Liu Q., Jiang X. Analysis of the thaumatin-like genes of Rosa chinensis and functional analysis of the role of RcTLP6 in salt stress tolerance. Planta. 2021;254:118. doi: 10.1007/s00425-021-03778-y. [DOI] [PubMed] [Google Scholar]
- 28.Zhang Y., Chen W., Sang X., Wang T., Gong H., Zhao Y., Zhao P., Wang H. Genome-Wide Identification of the Thaumatin-like Protein Family Genes in Gossypium barbadense and Analysis of Their Responses to Verticillium dahliae Infection. Plants. 2021;10:2647. doi: 10.3390/plants10122647. [DOI] [PMC free article] [PubMed] [Google Scholar]
- 29.Zhuang Q. Investigation and preliminary study of the disease in Sichuan. Sicau. 2005;12:1–23. [Google Scholar]
- 30.Verma V., Ravindran P., Kumar P.P. Plant hormone-mediated regulation of stress responses. BMC Plant Biol. 2016;16:86. doi: 10.1186/s12870-016-0771-y. [DOI] [PMC free article] [PubMed] [Google Scholar]
- 31.Tuteja N. Abscisic Acid and abiotic stress signaling. Plant Signal. Behav. 2007;2:135–138. doi: 10.4161/psb.2.3.4156. [DOI] [PMC free article] [PubMed] [Google Scholar]
- 32.Akbudak M.A., Yildiz S., Filiz E. Pathogenesis related protein-1 (PR-1) genes in tomato (Solanum lycopersicum L.): Bioinformatics analyses and expression profiles in response to drought stress. Genomics. 2020;112:4089–4099. doi: 10.1016/j.ygeno.2020.07.004. [DOI] [PubMed] [Google Scholar]
- 33.Kim Y.S., Park J.Y., Kim K.S., Ko M.K., Cheong S.J., Oh B.J. A thaumatin-like gene in nonclimacteric pepper fruits used as molecular marker in probing disease resistance, ripening, and sugar accumulation. Plant Mol.Biol. 2002;49:125–135. doi: 10.1023/A:1014995732171. [DOI] [PubMed] [Google Scholar]
- 34.Gasteiger E., Gattiker A., Hoogland C., Ivanyi I., Appel R.D., Bairoch A. ExPASy: The proteomics server for in-depth protein knowledge and analysis. Nucleic Acids Res. 2003;31:3784–3788. doi: 10.1093/nar/gkg563. [DOI] [PMC free article] [PubMed] [Google Scholar]
- 35.Yu C.S., Chen Y.C., Lu C.H., Hwang J.K. Prediction of protein subcellular localization. Proteins. 2006;64:643–651. doi: 10.1002/prot.21018. [DOI] [PubMed] [Google Scholar]
- 36.Chengjie C., Hao C., Yi Z., Hannah R.T., Margaret H.F., Yehua H., Rui X. TBtools: An Integrative Toolkit Developed for Interactive Analyses of Big Biological Data. Mol. Plant. 2020;13:1194–1202. doi: 10.1016/j.molp.2020.06.009. [DOI] [PubMed] [Google Scholar]
- 37.Guo A., Zhu Q., Chen X., Luo J. GSDS: A gene structure display server. Hereditas. 2007;29:1023–1026. doi: 10.1360/yc-007-1023. [DOI] [PubMed] [Google Scholar]
- 38.Hu B., Jin J., Guo A., Zhang H., Luo J., Gao G. GSDS 2.0: An upgraded gene feature visualization server. Bioinformatics. 2015;31:1296–1297. doi: 10.1093/bioinformatics/btu817. [DOI] [PMC free article] [PubMed] [Google Scholar]
- 39.Hung J., Weng Z. Sequence Alignment and Homology Search with BLAST and ClustalW. Cold Spring Harb. Protoc. 2016;2016:pdb-prot093088. doi: 10.1101/pdb.prot093088. [DOI] [PubMed] [Google Scholar]
- 40.Kumar S., Stecher G., Tamura K. MEGA7: Molecular Evolutionary Genetics Analysis Version 7.0 for Bigger Datasets. Mol. Biol. Evol. 2016;33:1870–1874. doi: 10.1093/molbev/msw054. [DOI] [PMC free article] [PubMed] [Google Scholar]
- 41.Han Y., Ding T., Bo S., Jiang H. Genome-Wide Identification, Characterization and Expression Analysis of the Chalcone Synthase Family in Maize. Int. J. Mol. Sci. 2016;17:161. doi: 10.3390/ijms17020161. [DOI] [PMC free article] [PubMed] [Google Scholar]
- 42.Fionn M., Pierre L. Ward’s Hierarchical Agglomerative Clustering Method: Which Algorithms Implement Ward’s Criterion? J. Classif. 2014;31:274–295. [Google Scholar]
- 43.Babicki S., Arndt D., Marcu A., Liang Y., Grant J.R., Maciejewski A., Wishart D.S. Heatmapper: Web-enabled heat mapping for all. Nucleic Acids Res. 2016;44:W147–W153. doi: 10.1093/nar/gkw419. [DOI] [PMC free article] [PubMed] [Google Scholar]
- 44.Waterhouse A., Bertoni M., Bienert S., Studer G., Tauriello G., Gumienny R., Heer F.T., de Beer T., Rempfer C., Bordoli L., et al. SWISS-MODEL: Homology modelling of protein structures and complexes. Nucleic Acids Res. 2018;46:296–303. doi: 10.1093/nar/gky427. [DOI] [PMC free article] [PubMed] [Google Scholar]
- 45.Singh V.K., Mangalam A.K., Dwivedi S., Naik S. Primer premier: Program for design of degenerate primers from a protein sequence. Biotechniques. 1998;24:318–319. doi: 10.2144/98242pf02. [DOI] [PubMed] [Google Scholar]
- 46.Fan C., Ma J., Guo Q., Li X., Wang H., Lu M. Selection of reference genes for quantitative real-time PCR in bamboo (Phyllostachys edulis) PLoS ONE. 2013;8:e0056573. doi: 10.1371/journal.pone.0056573. [DOI] [PMC free article] [PubMed] [Google Scholar]
- 47.Rao X., Huang X., Zhou Z., Lin X. An improvement of the 2−∆∆CT method for quantitative real-time polymerase chain reaction data analysis. Biostat. Bioinform. Biomath. 2013;3:71–85. [PMC free article] [PubMed] [Google Scholar]
Associated Data
This section collects any data citations, data availability statements, or supplementary materials included in this article.
Supplementary Materials
Data Availability Statement
The original contributions presented in the study are included in the article/Supplementary Material, and further inquiries can be directed to the corresponding authors. All the reads of witches’ broom disease bamboo tissues by RNA-Seq were deposited in National Center for Biotechnology Information (NCBI) SRA repository with accession number PRJNA980656.


