

Abstract
The industrial implementation of a direct methane to methanol process would lead to environmental and economic benefits. Copper zeolites successfully execute this reaction at relatively low temperatures, and mordenite zeolites in particular enable high methanol production. When loaded to a Cu/Al ratio of 0.45, mordenite (Si/Al 5 to 9) has been shown to host three active sites: two [CuOCu]2+ sites labeled MOR1 and MOR2, and a mononuclear [CuOH]+ site. Also at low copper loadings (Cu/Al < 0.20), mordenite has been demonstrated to activate methane, but its active site has never been reported. Here, we investigate Na+ mordenite with varying copper loadings to better understand copper speciation in mordenite. At low copper loadings, we uncover an unidentified active site (‘MOR3’) with a strong overlap with the [CuOH]+ site’s spectroscopic signal. By changing the co-cation, we selectively speciate more MOR3 relative to [CuOH]+, allowing its identification as a [CuOCu]2+ site. Active site identification in heterogeneous catalysts is a frequent problem due to signal overlap. By changing cation composition, we introduce an innovative method for simplifying a material to allow better analysis. This has implications for the study of Cu zeolites for methane to methanol and NOx catalysis, but also for studying and tuning heterogeneous catalysts in general.
Keywords: copper mordenite, methane to methanol, single-site spectroscopy, copper speciation, co-cations
Graphical Abstract

1. Introduction
The valorization of methane through direct partial oxidation to methanol is one of the major challenges of modern chemistry.1–5 Transition metal ion (TMI) exchanged zeolites are a promising class of materials for the direct, selective oxidation of methane to methanol with O2 at reasonably low temperatures. They effectively trap the partially oxidized methanol or methoxy products and thereby prevent thermodynamically favorable overoxidation.6,7
Multiple active copper/oxygen species were proposed on several zeolite topologies, but only [CuOCu]2+ species in Cu-MFI, Cu-MOR and Cu-CHA zeolites and [CuOH]+ in Cu-MOR were characterized with multiple spectroscopic techniques and linked to low temperature methane-to-methanol reactivity. The assignment of these sites requires extensive spectroscopic investigation; in these cases diffuse reflectance UV-Vis-NIR (DR-UV-Vis-NIR), resonance Raman (rR), electron paramagnetic resonance (EPR), magnetic circular dichroism (MCD), and X-ray absorption spectroscopy (XAS) were used.8–13
The MOR framework is particularly attractive due to its commercial availability and high methanol production.6,10,11,14–22 This framework is built from 4 inequivalent T-atoms (Figure 1A) and consists of 12MR channels (grey, Figure 1A) and compressed 8MR channels (blue, Figure 1A) that run parallel to each other. In between the unidirectional channels ‘side pockets’ are found that are enclosed by two 8MRs (Figure 1B, 8MRs thick). In copper-sodium-mordenite (Cu-Na-MOR) zeolites, two different [CuOCu]2+ sites were identified, designated as MOR1 and MOR2.10 MOR1 is located in the side pocket 8MR that is exposed to the 12MR main channel (thick and grey, Figure 1B). MOR2 is situated across the compressed 8MR channel (blue, Figure 1A).11 Recently, an active [CuOH]+ species was defined that is responsible for the methanol production on autoreduced Cu-MOR samples.13 Other active copper sites have also been suggested for Cu-MOR, such as a trinuclear copper active site ([Cu3 O3]2+)21 and copper oxide clusters deemed to be active under elevated methane pressure.19 These active sites have mainly been proposed for high copper loading mordenite despite the fact that low copper loading mordenite is still able to convert methane to methanol at low temperatures and partial pressures.6,14,15,21,22 A study defining the active site at low copper loadings is lacking.
Figure 1.

A) MOR topology in the [001]-direction. The 12MR channel is depicted in grey and the compressed 8MR channel in blue. The 4 inequivalent T-atoms are indicated. B) The two 8MRs that enclose the 8MR side pocket are accentuated.
In this contribution, we prepare tailored Cu-MOR materials to target specific active sites. First, we study active site speciation as a function of copper loading in Cu-Na-MOR (MOR hosting both Cu2+ and Na+ cations), which allows us to discover an unreported active site, MOR3, with resonance Raman features that partially overlap with the recently discovered [CuOH]+ features.13 This species, together with [CuOH]+, explains the reactivity observed in the literature of Cu-MOR with low Cu loadings (Cu/Al=0.08–0.20).14,15,21,22 At higher Cu loadings, MOR1 and MOR2 features obscure MOR3 features. To characterize this MOR3 species, we introduce large co-cations (K+ and Cs+) to selectively block the formation of [CuOH]+ sites and increase MOR3’s relative abundance. Indeed, it is well known that specific cations prefer specific crystographically well-defined exchange locations in the zeolite lattice.23,24 When these co-cations are strongly bound to the lattice, they can block certain exchange positions for copper,25,26 but until now this has never been intentionally leveraged to tune copper speciation. Interference of multiple active site signals is a common and significant problem in heterogeneous catalysis that prevents precise understanding of active site structures. Although site-selective spectroscopy has aided in active site identification, signal overlap can still prevent proper assignment of active sites and understanding of the origin of the catalysts reactivity. Here, we tackle this problem by introducing a new method to tune transition metal ion speciation to allow active site identification, relevant in designing zeolite systems in particular, and heterogeneous catalysts in general. By varying both copper loading and the co-cation, we identify MOR3 as a mono(μ-oxo) dicopper(II) species and determine its geometry and location. This also leads to a coherent picture of active site speciation in Cu-MOR and its sensitivity to cation composition.
2. Results and analysis
2.1. Physical properties
Table S1 gives an overview of the preparation and characterization details of the Cu-MOR samples with Na+ as the co-cation. They are denoted as Cu-Na-MOR(Y), with Y designating the Cu/Al ratio (Y = 0.09, 0.20, 0.28 or 0.45). Table S2 gives a similar overview of the Cu-MOR samples with other co-cations. They are denoted as Cu-X-MOR(Y), with X designating the co-cation (Li+, K+ or Cs+) and Y the Cu/Al ratio: Cu-Li-MOR(0.15), Cu-Li-MOR(0.43), Cu-K-MOR(0.25) and Cu-Cs-MOR(0.15). Prior to Cu2+ exchange, there is some remaining Na+ in the X-MOR (X = Li+, K+ or Cs+) zeolites, but after Cu2+ ion exchange there is barely any Na+ left in the case of K+ and Cs+ (Na/Al ~0.01), the key materials in this study (vide infra).
Figure S1 shows the diffraction patterns of the parent Na-MOR sample and the sample with highest copper loading, Cu-Na-MOR(0.45), after Cu ion exchange and reaction. Both patterns correspond to the standard pattern of pure MOR zeolites. No impurities of other zeolite phases could be detected. The absence of large copper oxide clusters is also confirmed. The samples with other copper loadings or co-cations also exhibit the pattern of pure MOR zeolites (Figure S2). The intensity of certain MOR diffraction peaks show some differences, especially in the case of Cs+ as the co-cation, which is also observed in literature.27,28
The microporosity was determined by N2 physisorption on Na-MOR (0.18 cm3/g) and Cu-Na-MOR(0.45) (0.18 cm3/g), in good agreement with literature values (N2 physisorption isotherms in Figure S3).15,19 Similar isotherms are obtained for the other Cu-MOR samples in this work. The microporosity values are included in Tables S1 and S2 and show a decreasing microporosity with increasing size of co-cation, with Cu-Cs-MOR(0.15) having a markedly lower microporosity (0.10 cm3/g), which is also observed in literature.28
2.2. Spectroscopic investigation of the Cu-Na-MOR(Y) zeolites
2.2.1. EPR spectroscopy
EPR spectroscopy is a technique that has allowed quantification of an unreactive spectator Cu(II) species20 and a [CuOH]+ active site13 in past studies and is useful for understanding methane reactivity at low copper loading. The EPR spectra of the four Cu-Na-MOR(Y) samples after N2O activation are shown in Figure 2 with the A|| hyperfine lines for the [CuOH]+ and the methane unreactive spectator species marked. The quantification of [CuOH]+, spectator copper and EPR silent copper (from EPR spin integration and Cu content determined from ICP-MS) is included in Table 1. At low loading (Cu/Al = 0.09), the sample is almost entirely spectator copper with a small amount of [CuOH]+ and EPR silent copper. At the intermediate copper loading Cu/Al = 0.20, a significant amount of [CuOH]+ begins to appear and by Cu/Al = 0.28 there is a significant amount of EPR silent Cu. Finally, for the high loading Cu/Al = 0.45 sample, more [CuOH]+ appears along with more EPR silent Cu. This implies that the spectator Cu(II) is the most thermodynamically stable species, causing it to fill first, followed by simultaneous filling of [CuOH]+ and EPR silent species.
Figure 2.

EPR spectra of Cu-Na-MOR(Y) (Y=0.09, 0.20, 0.28, 0.45) after N2O 250°C. The A|| of the [CuOH]+ and spectator Cu2+ features are indicated.
Table 1.
Amount of various species in Cu-Na-MOR(Y) quantified using EPR and ICP-MS.
| Sample | [CuOH]+ (μmol/g) | Spectator (μmol/g) | EPR Silent Cu (μmol/g) |
|---|---|---|---|
| Cu-Na-MOR(0.09) | 5±1 | 113±25 | 31±7 |
| Cu-Na-MOR(0.20) | 113±25 | 158±35 | 44±9 |
| Cu-Na-MOR(0.28) | 89±20 | 124±27 | 213±47 |
| Cu-Na-MOR(0.45) | 200±44 | 167±37 | 300±66 |
2.2.2. DR-UV-Vis-NIR spectroscopy
DR UV-Vis-NIR provides additional information on the sites present in the various materials. Figure S4 shows the DR-UV-Vis-NIR spectra of the four Cu-Na-MOR(Y) samples after autoreduction in He at 630°C, N 2O activation at 250°C, and reaction with methane at 150°C for 30 minutes. Figure 3 compares the N2O activated spectra of Cu-Na-MOR(Y) with various copper loadings.
Figure 3.

DR-UV-Vis-NIR spectra of Cu-Na-MOR(Y) (Y=0.09, 0.20, 0.28, 0.45) after N2O activation at 250°C.
After activation in N2O at 250°C, an absorption band around 22300 cm−1 appears in the spectra of all Cu-Na-MOR samples, accompanied by a weaker absorption feature around 6000 cm−1. The 6000 and 22300 cm−1 absorption features were previously observed in Cu-MFI, Cu-MOR and Cu-CHA zeolites, where they were assigned to [CuOCu]2+ species based on their characteristic resonance Raman (rR) vibrations.8,10,12 The 22300 cm−1 feature decays during reaction with methane at 150°C and methanol is recovered after aqueous extraction. This absorption band does not decay when CH4 is substituted for pure helium at 150°C or 200°C (Figure S5), implying the related copper species has reacted upon contact with methane. The 22300 cm−1 absorption band is also present after O2 activation at 250°C (Figure S6), albeit less intense than after N2O activation.
Like in previous literature, methanol was also obtained for low and intermediate copper loadings (Cu/Al = 0.08–20.20) (Table S1).14,15,21,22 At higher copper loadings, the Cu-MOR samples show a more intense 22300 cm−1 band after N2O or O2 treatment (Figures 3 and S6) and a higher methanol yield per gram of material (Table S1).
2.2.3. Resonance Raman spectroscopy
Resonance Raman (rR) spectroscopy complements DR-UV-Vis-NIR spectroscopy with vibrational information on active sites through tuning a laser into particular absorption features. Figure 4 shows the resonance Raman spectra at λ ex = 458 nm (~21800 cm−1) of Cu-Na-MOR(0.20) (Figure 4A) and Cu-Na-MOR(0.45) (Figure 4B) after N2O activation at 250°C (black) and subsequent reaction with methane at 150°C (red). The spectra of Cu-Na-MOR(0.09) and Cu-Na-MOR(0.28) are shown in Figure S7.
Figure 4.

rR spectra of A) Cu-Na-MOR(0.20) and B) Cu-Na-MOR(0.45) at a laser excitation energy of 458 nm. (*) The sharp peak around 700 cm−1 is a plasmon line of the laser.
The lowest copper loading sample, Cu-Na-MOR(0.09), has no clear CH4 reactive rR signals (Figure S7A). rR of Cu-Na-MOR(0.20) reveals vibrations at 556, 750 and 980 cm−1 associated with [CuOH]+,13 and a feature around 497 cm−1 (Figure 4A). EPR confirms that [CuOH]+ is present in all Cu-Na-MOR samples but at significantly larger amounts in copper loadings of Cu/Al = 0.2 and higher (Figure 2). The 556 cm−1 feature is too sharp and too intense, compared to the 750 and 980 cm−1 features, to belong solely to [CuOH]+.13 No features of the already defined MOR1 and MOR2 species are present in Cu-Na-MOR(0.20),10 indicating the signals at 497 and 556 cm−1 are (partially) due to a new copper species, tentatively called MOR3. These vibrations are also apparent in Cu-Na-MOR(0.28) (Figure S7B).
In the high copper loading Cu-Na-MOR(0.45), the antisymmetric stretch vibrations of MOR1 and MOR2 appear at 850 and 870 cm−1 respectively (Figure 4B). The presence of MOR1 and MOR2 also leads to large signals around 450–535 cm−1 due to their symmetric stretch and Al T-site vibrations. MOR1 and MOR2’s signals are so intense they obscure any MOR3 and [CuOH]+ signals. The [CuOCu]2+ MOR1 and MOR2 sites are EPR silent due to exchange coupling between the two coppers, matching the observed increase in the amount of EPR silent copper (Table 1).
2.3. Spectroscopic investigation of the Cu-X-MOR(Y) zeolites
Spectroscopic assignment of MOR3 in Cu-Na-MOR is difficult due to its signal overlap with both [CuOH]+ (present at low and high copper loading) and MOR1&2 (present at high copper loading). Past studies have demonstrated that co-cations can influence speciation and block the formation of certain sites.25,26 Thus, we introduced Li+, K+ and Cs+ co-cations in the mordenite zeolite prior to Cu2+ ion exchange to affect copper speciation. A list of the co-cation containing X-MOR and Cu-X-MOR zeolites and their elemental composition can be found in Table S2. The amount of Cu2+ exchanged onto the zeolite decreases when larger co-cations (Cu-K-MOR(0.25) and Cu-Cs-MOR(0.15)) are present, even though the same ion exchange procedure was employed as for Cu-Li-MOR(0.43) and Cu-Na-MOR(0.45). This indicates the more difficult exchange of K+ and Cs+ for Cu2+ compared to Li+ and Na+. The elemental composition results are in line with the preference for Cu2+ to exchange in decreasing order for Li+ > Na+ > K+ > Cs+ determined on Y zeolites29 and is also in line with the thermodynamic affinity sequence Cs+ > K+ > Na+ > Li+ determined by Barrer and Klinowski on synthetic mordenites.30 This was explained by the lower charge density of the larger cations leading to a less hydrated state and an increased interaction with the aluminate sites of the zeolite. Therefore, the ion exchange process where Cu2+ loses its hydration shell and the co-cation gains a hydration shell is more endothermic and thus less favored for Cs+ than for Li+. Thus, only an ‘intermediate Cu loading’ sample was obtained for Cu-K-MOR (Cu/Al = 0.25) and Cu-Cs-MOR (Cu/Al = 0.15), whereas for Cu-Li-MOR – in addition to the high (Cu/Al = 0.43) loaded sample – an intermediate loaded sample (Cu/Al = 0.15) was prepared by reducing the copper content during the ion exchange (Table S2) in order to compare with the intermediate Cu loaded samples of Na+, K+ and Cs+.
The EPR spectra of the four Cu-X-MOR(Y) samples with intermediate Cu loadings are shown in Figure 5. The quantification of [CuOH]+, spectator copper and EPR silent copper is included in Table 2. For the entire series, within error the same amount of spectator Cu appears; however, the co-cation has a substantial effect on the amount of [CuOH]+ and EPR silent Cu present. For the smaller Li+ and Na+ co-cations, a larger fraction of [CuOH]+ and a lower fraction of EPR silent copper is introduced than for the larger K+ and Cs+ co-cations.
Figure 5.

EPR spectra of Cu-Li-MOR(0.15), Cu-Na-MOR(0.20), Cu-K-MOR(0.25) and Cu-Cs-MOR(0.15), showing the decreased presence of [CuOH]+ in the K+ and Cs+ sample.
Table 2.
Amount of various species in Cu-X-MOR(Y) quantified using EPR.
| Sample | [CuOH]+ (μmol/g) | Spectator (μmol/g) | EPR Silent Cu (μmol/g) |
|---|---|---|---|
| Cu-Li-MOR(0.15) | 110±24 | 110±24 | 25±6 |
| Cu-Na-MOR(0.20) | 113±25 | 158±35 | 44±9 |
| Cu-K-MOR(0.25) | 66±15 | 183±40 | 166±35 |
| Cu-Cs-MOR(0.15) | 7±2 | 127±28 | 85±18 |
This increase in EPR silent Cu with larger cation size is directly reflected in the DR-UV-Vis-NIR spectra of these 4 samples. They show that all Cu-X-MOR samples exhibit a ~22300 cm−1 absorption band when the autoreduced sample is contacted with N2O (Figure 6) or O2 (Figure S9) at 250°C. This band decays upon reaction with methane (Figure S8), and methanol is extracted from every sample (Table S2). However, the 22300 cm−1 band increases in intensity for the larger co-cation Cu-K-MOR(0.25) and Cu-Cs-MOR(0.15) samples compared to Cu-Li-MOR(0.15) and Cu-Na-MOR(0.20), indicating a higher abundance of [CuOCu]2+ despite all having intermediate Cu loadings. The N2O activated Cu-Li-MOR(0.43) sample also shows an intense 22300 cm−1 absorption band (Figure S10), comparable with the Cu-Na-MOR(0.45) sample.
Figure 6.

Stacked DR-UV-Vis-NIR spectra of Cu-Li-MOR(0.15), Cu-Na-MOR(0.20), Cu-K-MOR(0.25) and Cu-Cs-MOR(0.15) after autoreduction in He at 630°C followed by N2O activation at 250°C.
Laser excitation into the 22300 cm−1 band reveals the presence of MOR3 in Cu-Li-MOR(0.15), Cu-KMOR(0.25) and Cu-Cs-MOR(0.15) with no apparent MOR1 and MOR2 signals (Figure 7). In addition to MOR3, Cu-Li-MOR(0.43) contains MOR1 and MOR2 as evidenced by their antisymmetric stretch vibrations at 850 and 870 cm−1 in the rR spectra (Figure S11). This is similar to the Cu-Na-MOR(0.45) sample (Figure 4B).
Figure 7.

rR spectra of A) Cu-Li-MOR(0.15) B) Cu-Na-MOR(0.20) C) Cu-K-MOR(0.25) D) Cu-Cs-MOR(0.15) after N2O activation at 250°C and reaction with methane at 150°C for 30 minutes (λex = 458 nm). (*) The sharp peak is a plasmon line of the laser.
The sharper MOR3 features at 497 and 556 cm−1 in the Cu-K-MOR(0.25) and Cu-Cs-MOR(0.15) samples relative to the Cu-Li-MOR(0.15) and Cu-Na-MOR(0.20) samples indicate that the relative abundance of MOR3 compared to [CuOH]+ has increased in the Cu-K-MOR(0.25) and Cu-Cs-MOR(0.15) samples despite all having intermediate copper loadings. This agrees with the EPR results in Table 2.
2.4. Structural identity and location of MOR3
The reduced abundance of [CuOH]+, the absence of MOR1 and MOR2, and the intense DR-UV-Vis-NIR and rR features of MOR3 (vide supra) in Cu-K-MOR(0.25) and Cu-Cs-MOR(0.15) (Figure 7C–D) allow for a spectroscopic assignment of this new active site.
In addition to the two lower energy features at 497 and 556 cm−1 seen in the Cu-Na-MOR(0.20) sample, Cu-K-MOR(0.25) also has features at 775 and 1058 cm−1. The higher energy region of the rR spectrum shows an additional feature at 1553 cm−1 (Figure 8). All these features are produced after activation with both O −1 2 and N2O (Figure 8). The 22300 cm−1 chromophore was scanned with multiple laser lines and all these vibrations profile this band (Figure 9). Activation with 18O2 shows clear isotope shifts in the 497 cm−1 (Δ18O = 16 cm−1) and 775 cm−1 (Δ18O = 45 cm−1) features (Figure 8). Due to incomplete isotope labeling, isotope shifts of weaker features at higher energy could not be accurately determined.
Figure 8.

rR spectra of Cu-K-MOR(0.25) extended to higher Raman shift energies after activation in N2O, 16O2 or 18O2 at 250°C and methane reaction at 150°C (λex = 458 nm). (*) The sharp peak around 1100 cm−1 is a plasmon line of the laser.
Figure 9.

A) rR profile of Cu-K-MOR(0.25) after O2 activation at 250°C and subsequent reaction with CH4 at 150°C at different excitation wavelengths (λex), showing that the 497, 556, 775, 987 and 1058 cm−1 vibrations profile the 22300 cm−1 absorption feature and belong to MOR3. B) The different excitation wavelengths are indicated on the DR-UV-Vis spectrum of Cu-K-MOR(0.25) after activation with O2 at 250°C.
MOR3’s features and isotope shifts match similar rR features associated with [CuOCu]2+ cores in MFI, CHA, MOR1 and MOR2 (Table 3).8,10,12 The most intense isotope sensitve feature of MOR3 at 497 cm−1 is assigned to the symmetric stretch of a [CuOCu]2+ core, and the weaker isotope sensitive feature at 775 cm−1 is assigned to the corresponding antisymmetric stretch. The isotope insensitive 556 cm−1 feature is ascribed to the bidentate tetrahedral site (O-Al-O T-site) ligand stretch which forms a combination band with the symmetric stretch at 1058 cm−1. The second quantum of the symmetric and antisymmetric stretches can be observed at 987 cm−1 and 1553 cm−1 respectively.
Table 3.
Summary of rR features and NCA for the [CuOCu]2+ species in MFI, CHA, MOR1, MOR2 and the newly discovered MOR3.
| MFI | CHA | MOR1 | MOR2 | MOR3 | |
|---|---|---|---|---|---|
| 456 | 581 | 465 | 450 | 497 | Symmetric stretch (cm−1) |
| 514 | 510 | 535 | 525 | 556 | Al T-site vibration (cm−1) |
| 870 | 837 | 850 | 870 | 775 | Antisymmetric stretch (cm−1) |
| 140 | 120 | 137 | 141 | 127 | ∠CuOCu (°) |
| 3.8 | 4 | 3.7 | 3.8 | 3.3 | Cu-Ooxo FC (mdyn/Å) |
| 0.25 | 0.24 | 0.25 | 0.25 | 0.23 | Cu-Ooxo/Cu-Ooxo interaction FC: kMOM (mdyn/Å) |
A normal coordinate analysis (NCA) of the symmetric and antisymmetric vibrations of the [CuOCu]2+ core determines a Cu-Ooxo force constant (FC) of 3.3 mdyn/Å, a Cu-Ooxo/Cu-Ooxo interaction FC of 0.23 mdyn/Å, and a Cu-O-Cu bond angle of 127° (Figure S12).31 The Cu-Ooxo FC is the smallest of any [CuOCu]2+ identified thus far (Table 3). The weaker interaction of the copper with the oxo is compensated by the stronger T-site interaction FC reflected in the large Al T-site vibration energy (Table 3). The bond angle of 127° is an intermediate value between those identified thus far in Cu-CHA (120°), Cu-MFI (140°) and Cu-MOR (137° and 141°).8,10,12
Using the method described previously,11 the location of MOR3 was probed by reacting Cu-K-MOR(0.25) with the bulky substrate tetrahydrofuran (THF) (see SI section 1.2), which can only react with active sites exposed to the 12MR channel of MOR. Resonance Raman spectra collected after reaction of the activated sample with liquid THF for 120 days show that MOR3 is still present (Figure S13). This indicates that MOR3 is located inside the 8MR side pocket or the compressed 8MR channel, inaccessible to the THF molecule.
An accurate determination of the experimental methane activation barrier of MOR3 using operando UVVis like in past studies was not feasible due to the low intensity of the 22300 cm−1 absorption band in the samples with only MOR3. Samples with higher Cu loading have a more intense absorption feature, but deconvolution into MOR1, MOR2 and MOR3 contributions is ambiguous. Reacting the Cu-Na-MOR(0.28) sample with CH4, however, allows a comparison between the MOR3 and the [CuOH]+ active sites. Reaction of Cu-Na-MOR(0.28) with CH4 at 150°C for 30 minutes results in full loss of the MOR3 22300 cm−1 band (Figure S4C), indicating full reaction of MOR3, while the [CuOH]+ site still has significant intensity as observed by EPR (Figure S14). Thus, MOR3 is substantially more reactive at these conditions than the [CuOH]+ site (MOR3 ΔG‡(at 150°C) < 32.4 kcal/mol)13 similar to the significantly higher reactivity seen with other [CuOCu]2+ sites.8,10,12
2.5. DFT model of MOR3
Based on its spectroscopic characteristics we assign MOR3 as a [CuOCu]2+ species with a Cu-O-Cu bond angle of 127° buried in the 8MR side pocket or the compressed 8MR channel. Snyder et al. evaluated six possible models for [CuOCu]2+ sites in Cu-MOR.11 Two models were evaluated for an exposed site like the MOR1 site and four models for a buried site like the MOR2 and MOR3 sites. Of the four buried models only one model accurately describes the experimentally observed features for MOR3. In this model, one copper is ligated bidentate by an aluminate in the inner 8MR of the side pocket, and the other copper is ligated bidentate by an aluminate in the 8MR that forms the back of the pocket (Figure 10). The calculated ∠CuOCu is 123°, νsym is 500 cm−1, νasym is 795 cm−1 and an absorption feature is calculated at 25000 cm−1, matching well with experiment (Table 4).11
Figure 10.
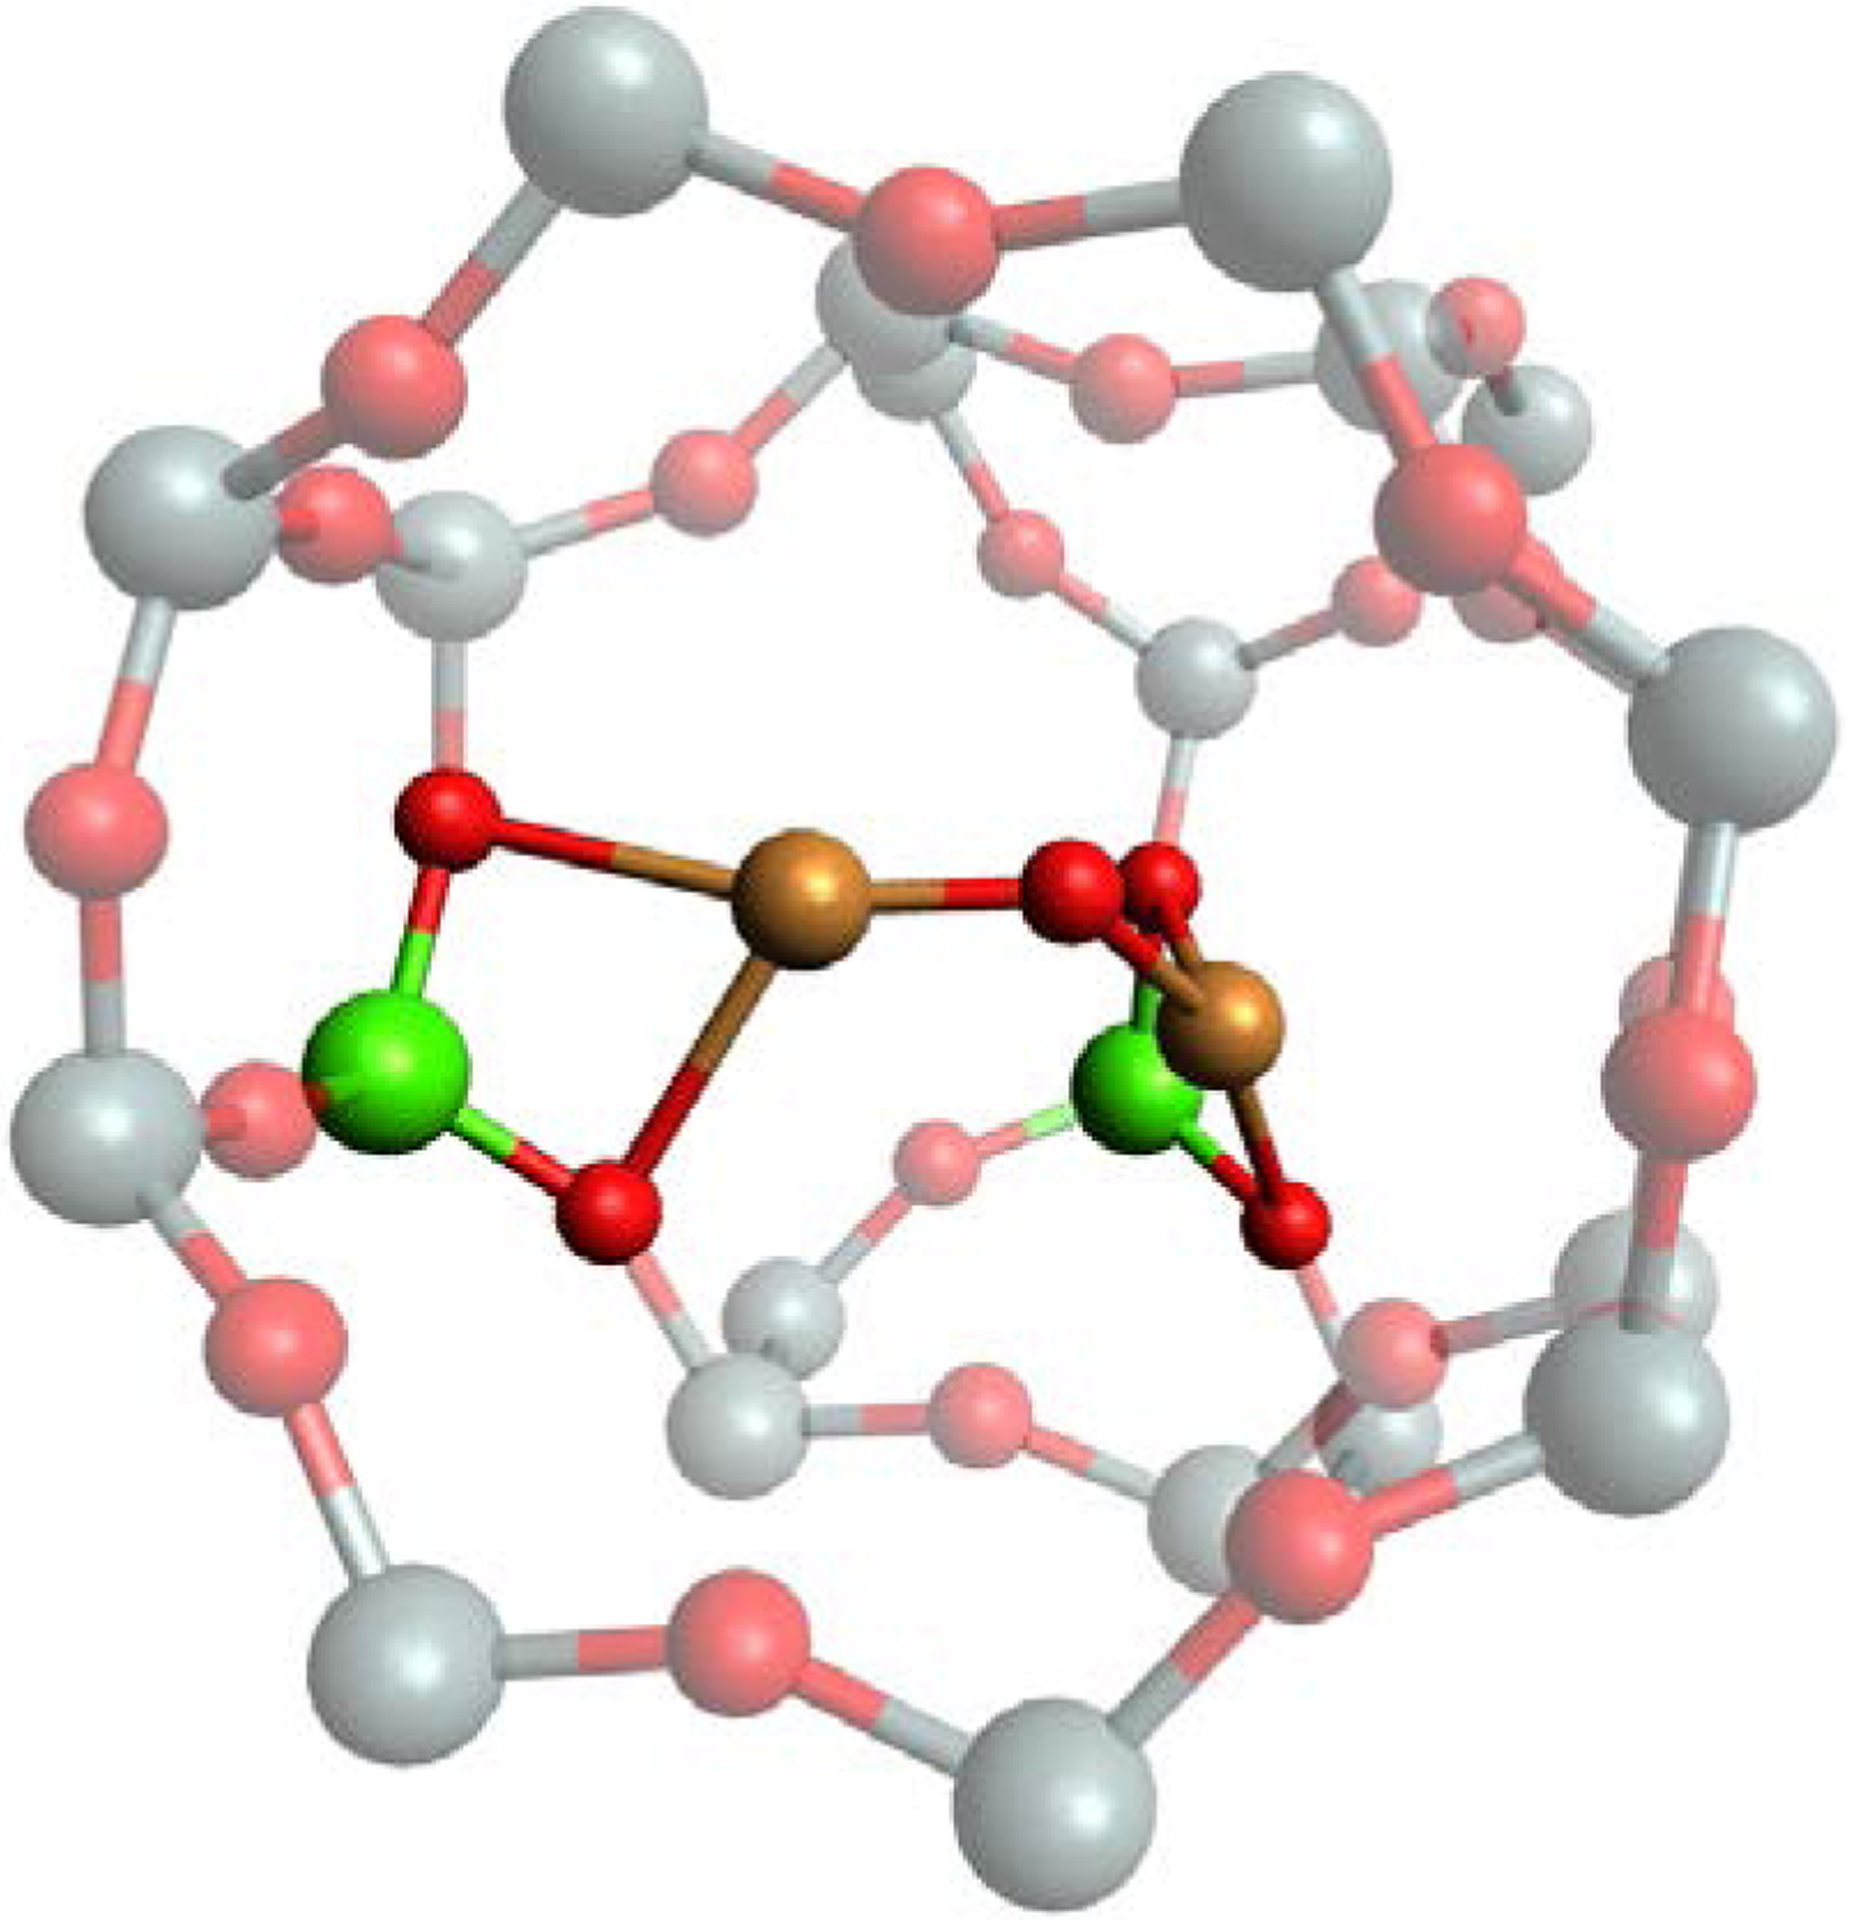
DFT model for MOR3 (Color scheme: gray = Si, green = Al, mustard = Cu, red = O).
Table 4.
Comparison of the experimentally observed features of MOR3 and the DFT model.
| MOR3 | Experiment | DFT |
|---|---|---|
| Absorption feature (cm−1) | ~22300 | 25000 |
| ∠CuOCu bond angle | 127° | 123° |
| Symmetric stretch (vsym) (cm−1) | 497 | 500 |
| Antisymmetric stretch (vasym) (cm−1) | 775 | 795 |
| Accessibility | Buried | Buried |
3. Discussion
Low loading Cu-Na-MOR was already known to selectively convert CH4 to CH3OH, but little was known on the active site.14,15,21,22 Here, we investigated Cu-Na-MOR with multiple copper loadings to discover that the previously defined [CuOH]+ site13 as well as a newly defined MOR3 site are responsible for this reactivity. By analyzing different copper loadings using EPR, DR-UV-Vis-NIR and rR we obtained insight into the speciation in Cu-Na-MOR. The spectator site is the only significant site at the lowest loading, indicating it is the most thermodynamically stable. This is consistent with its lack of reactivity with CH4 or H2.13,15,20 At a copper loading of Cu/Al = 0.20 or higher the spectator site concentration is constant, indicating that it is fully filled at a Cu/Al ratio ≥ 0.20. Additional copper loading then forms [CuOH]+ and MOR3, appearing in parallel at intermediate copper loadings. In the highest loaded sample the [CuOH]+ loading continues to increase and also MOR1 and MOR2 appear. This indicates that, of the [CuOCu]2+ sites, the exchange sites for the copper leading to MOR3 are more stable than those leading to MOR1 and MOR2 (assuming the speciation is thermodynamically driven under the employed preparation steps). This is potentially due to stronger T-site interactions of the MOR3 site with the lattice indicated by its stronger T-site vibration. Interestingly though, the [CuOH]+ amount continually increases as the amount of all three [CuOCu]2+ sites increase. It seems thus that, as [CuOH]+ sites fill, some remain [CuOH]+ during the autoreduction step, and some proximal [CuOH]+ autoreduce to binuclear Cu+ pairs. This autoreduction phenomenon might happen via the mechanism proposed in literature:32–34
The resulting binuclear Cu+ pair reacts with O2 or N2O to form [CuOCu]2+ sites in the subsequent activation step. The concentration of [CuOH]+ sites continually grows due to filling of the larger number of isolated [CuOH]+ sites (Si/Al = 9) that offsets the [CuOH]+ sites lost via the above reaction scheme to becoming [CuOCu]2+ sites.
It is this concomitant formation of MOR3 and [CuOH]+ that has made MOR3 difficult to define spectroscopically. This problem motivated the use of different co-cations to selectively speciate MOR3, allowing it to be defined as a [CuOCu]2+ site. The larger the cation, the less total copper can be incorporated into the zeolite. Multiple ion exchanges led to the Li+ and Na+ zeolites incorporating copper up to a Cu/Al ratio of 0.45 while K+ only allowed up to 0.25 and Cs+ only 0.15 under the described conditions (SI Section 1.1). Despite the lower total copper incorporated, all these zeolites are able to incorporate similar amounts of the spectator species (Table 2). However, zeolites with the larger K+ or Cs+ cations are no longer exchanged by Cu2+ on the less stable MOR1 and MOR2 positions as seen by rR. This seems to indicate that the larger cations bind tightly to the zeolite at those exchange sites, making the thermodynamic barrier for exchange into Cu2+ on the MOR1 and MOR2 sites unfavorable. Interestingly, although the MOR3 and the [CuOH]+ sites form at similar Cu loading in the Li+ and Na+ zeolites, in the K+ and Cs+ zeolites less [CuOH]+ is present while substantial MOR3 is formed. This again points at a change in preferred locations for Cu2+ exchange due to a different preference of the larger co-cations for specific aluminate site locations in the lattice compared to Na+ and Li+. The larger co-cations are likely blocking the sites where otherwise isolated [CuOH]+ forms, whereas the remaining Na+ in the X-MOR zeolites might be exchanged for Cu2+ at the proximal [CuOH]+ sites. In terms of the [CuOH]+ → [CuOCu]2+ reaction scheme above, this promotes occupation of proximal [CuOH]+ sites that condense to form the MOR3 [CuOCu]2+ site.
4. Conclusions
By combining the analysis of mordenite samples with various copper loadings and the introduction of large co-cations (K+ and Cs+) prior to Cu exchange, a novel active site, MOR3, for methane oxidation was discovered in Cu-MOR. On the more ‘typical’ materials with high Cu loading and Na+ as the co-cation, the rR features of this site are obscured by co-existing MOR1, MOR2 and [CuOH]+ active sites. The combination of the previously defined [CuOH]+ site and this novel MOR3 site is responsible for the methanol production at low copper loading, for which the active site had not been detailedly investigated until now.14,15,21,22
The 22300 cm−1 DR-UV-Vis absorption band and characteristic rR vibrations and their 18O shifts on Cu-KMOR(0.25) led to the identification of MOR3 as a [CuOCu]2+ species with a Cu-O-Cu bond angle of 127°. MOR3’s stability in THF, together with DFT modeling, points to a buried location in the compressed 8MR channel. This site is significantly more reactive than the [CuOH]+ site defined previously, like the other [CuOCu]2+ cores.13
This study demonstrates how the various sites speciate in Cu-Na-MOR as copper loading increases. It also shows that this speciation pattern can be changed by altering the co-cation, allowing selective speciation of a particular active site. This facilitates spectroscopic characterization of a single active site amidst multiple active and spectator sites with overlapping spectroscopic features. Active site characterization in heterogeneous catalysis is a significant challenge in a variety of systems due to signal overlap. Here, we demonstrate a simple method for unraveling complex, heterogeneous transition metal ion speciation in zeolite catalysts with potential applications in catalyst design for reactivity or selectivity.
Supplementary Material
Acknowledgments
Funding for this work was provided by the Research Foundation-Flanders grants G0A0321N (to D.P. and B.F.S.) and 1276021N (to M.B.), the Stanford Woods Institute for the Environment grant SPO 164153 WTAQE (to E.I.S.), the Stanford Natural Gas Initiative grant SPO 127222 WZABN (to E.I.S.), the National Institutes of Health Grant R01DK031450 (to E.I.S.), and the Anne T. and Robert M. Bass Stanford Graduate Fellowship (to A.J.H.).
Footnotes
Supporting Information
The Supporting Information is available free of charge at https://pubs.acs.org.
Experimental details, elemental composition of samples, PXRD patterns, nitrogen sorption isotherms, DRUV-Vis-NIR spectra, resonance Raman spectra, EPR spectra, Normal Coordinate Analysis plot, and other figures.
The authors declare no competing financial interest.
References
- (1).Hammond C; Conrad S; Hermans I Oxidative Methane Upgrading. ChemSusChem 2012, 5, 1668–1686. [DOI] [PubMed] [Google Scholar]
- (2).Olivos-Suarez AI; Szécsényi À; Hensen EJM; Ruiz-Martinez J; Pidko EA; Gascon J Strategies for the Direct Catalytic Valorization of Methane Using Heterogeneous Catalysis: Challenges and Opportunities. ACS Catal 2016, 6, 2965–2981. [Google Scholar]
- (3).Jackson RB; Solomon EI; Canadell JG; Cargnello M; Field CB Methane Removal and Atmospheric Restoration. Nat. Sustain 2019, 2, 436–438. [Google Scholar]
- (4).Jovanovic ZR; Lange JP; Ravi M; Knorpp AJ; Sushkevich VL; Newton MA; Palagin D; van Bokhoven JA Oxidation of Methane to Methanol over Cu-Exchanged Zeolites: Scientia Gratia Scientiae or Paradigm Shift in Natural Gas Valorization? J. Catal 2020, 385, 238–245. [Google Scholar]
- (5).Mansoor R; Tahir M Recent Developments in Natural Gas Flaring Reduction and Reformation to Energy-Efficient Fuels : A Review. Energy Fuels 2021, 35, 3675–3714. [Google Scholar]
- (6).Newton MA; Knorpp AJ; Sushkevich VL; Palagin D; Van Bokhoven JA Active Sites and Mechanisms in the Direct Conversion of Methane to Methanol Using Cu in Zeolitic Hosts: A Critical Examination. Chem. Soc. Rev 2020, 49, 1449–1486. [DOI] [PubMed] [Google Scholar]
- (7).Snyder BER; Bols ML; Schoonheydt RA; Sels BF; Solomon EI Iron and Copper Active Sites in Zeolites and Their Correlation to Metalloenzymes. Chem. Rev 2018, 118, 2718–2768. [DOI] [PubMed] [Google Scholar]
- (8).Woertink JS; Smeets PJ; Groothaert MH; Vance MA; Sels BF; Schoonheydt RA; Solomon EIA [Cu2O]2+ Core in Cu-ZSM-5, the Active Site in the Oxidation of Methane to Methanol. Proc. Natl. Acad. Sci 2009, 106, 18908–18913. [DOI] [PMC free article] [PubMed] [Google Scholar]
- (9).Vanelderen P; Hadt RG; Smeets PJ; Solomon EI; Schoonheydt RA; Sels BF Cu-ZSM-5: A Biomimetic Inorganic Model for Methane Oxidation. J. Catal 2011, 284, 157–164. [DOI] [PMC free article] [PubMed] [Google Scholar]
- (10).Vanelderen P; Snyder BER; Tsai M-L; Hadt RG; Vancauwenbergh J; Coussens O; Schoonheydt RA; Sels BF; Solomon EI Spectroscopic Definition of the Copper Active Sites in Mordenite: Selective Methane Oxidation. J. Am. Chem. Soc 2015, 137, 6383–6392. [DOI] [PubMed] [Google Scholar]
- (11).Snyder BER; Vanelderen P; Schoonheydt RA; Sels BF; Solomon EI Second-Sphere Effects on Methane Hydroxylation in Cu-Zeolites. J. Am. Chem. Soc 2018, 140, 9236–9243. [DOI] [PubMed] [Google Scholar]
- (12).Rhoda HM; Plessers D; Heyer AJ; Bols ML; Schoonheydt RA; Sels BF; Solomon EI Spectroscopic Definition of a Highly Reactive Site in Cu-CHA for Selective Methane Oxidation: Tuning a Mono-μ-Oxo Dicopper(II) Active Site for Reactivity. J. Am. Chem. Soc 2021, 143, 7531–7540. [DOI] [PMC free article] [PubMed] [Google Scholar]
- (13).Heyer AJ; Plessers D; Braun A; Rhoda HM; Bols ML; Hedman B; Hodgson KO; Schoonheydt RA; Sels BF; Solomon EI Methane Activation by a Mononuclear Copper Active Site in the Zeolite Mordenite: Effect of Metal Nuclearity on Reactivity. J. Am. Chem. Soc 2022, 144, 19305–19316. [DOI] [PMC free article] [PubMed] [Google Scholar]
- (14).Brezicki G; Kammert JD; Gunnoe TB; Paolucci C; Davis RJ Insights into the Speciation of Cu in the Cu-H-Mordenite Catalyst for the Oxidation of Methane to Methanol. ACS Catal 2019, 9, 5308–5319. [Google Scholar]
- (15).Sushkevich VL; Artsiusheuski M; Klose D; Jeschke G; Bokhoven JA Identification of Kinetic and Spectroscopic Signatures of Copper Sites for Direct Oxidation of Methane to Methanol. Angew. Chemie Int. Ed 2021, 60, 15944–15953. [DOI] [PubMed] [Google Scholar]
- (16).Prodinger S; Kvande K; Arstad B; Borfecchia E; Beato P; Svelle S Synthesis–Structure–Activity Relationship in Cu-MOR for Partial Methane Oxidation: Al Siting via Inorganic Structure-Directing Agents. ACS Catal 2022, 12, 2166–2177. [Google Scholar]
- (17).Palagin D; Knorpp AJ; Pinar AB; Ranocchiari M; van Bokhoven JA Assessing the Relative Stability of Copper Oxide Clusters as Active Sites of a CuMOR Zeolite for Methane to Methanol Conversion: Size Matters? Nanoscale 2017, 9, 1144–1153. [DOI] [PubMed] [Google Scholar]
- (18).Sushkevich VL; Palagin D; Ranocchiari M; van Bokhoven JA Selective Anaerobic Oxidation of Methane Enables Direct Synthesis of Methanol. Science 2017, 356, 523–527. [DOI] [PubMed] [Google Scholar]
- (19).Tomkins P; Mansouri A; Bozbag SE; Krumeich F; Park MB; Alayon EMC; Ranocchiari M; Vanbokhoven JA Isothermal Cyclic Conversion of Methane into Methanol over Copper-Exchanged Zeolite at Low Temperature. Angew. Chemie - Int. Ed 2016, 55, 5467–5471. [DOI] [PubMed] [Google Scholar]
- (20).Vanelderen P; Vancauwenbergh J; Tsai M-L; Hadt RG; Solomon EI; Schoonheydt RA; Sels BF Spectroscopy and Redox Chemistry of Copper in Mordenite. ChemPhysChem 2014, 15, 91–99. [DOI] [PubMed] [Google Scholar]
- (21).Grundner S; Markovits MAC; Li G; Tromp M; Pidko EA; Hensen EJM; Jentys A; Sanchez-Sanchez M; Lercher JA Single-Site Trinuclear Copper Oxygen Clusters in Mordenite for Selective Conversion of Methane to Methanol. Nat. Commun 2015, 6, 1–9. [DOI] [PMC free article] [PubMed] [Google Scholar]
- (22).Pappas DK; Martini A; Dyballa M; Kvande K; Teketel S; Lomachenko KA; Baran R; Glatzel P; Arstad B; Berlier G; Lamberti C; Bordiga S; Olsbye U; Svelle S; Beato P; Borfecchia E The Nuclearity of the Active Site for Methane to Methanol Conversion in Cu-Mordenite: A Quantitative Assessment. J. Am. Chem. Soc 2018, 140, 15270–15278. [DOI] [PubMed] [Google Scholar]
- (23).Mortier WJ Compilation of Extra Framework Sites in Zeolites; Butterworth Scientific Limited, 1982. [Google Scholar]
- (24).Dědeček J; Wichterlová B Co2+ Ion Siting in Pentasil-Containing Zeolites. I. Co2+ Ion Sites and Their Occupation in Mordenite. A Vis-NIR Diffuse Reflectance Spectroscopy Study. J. Phys. Chem. B 1999, 103, 1462–1476. [Google Scholar]
- (25).Grundner S; Luo W; Sanchez-Sanchez M; Lercher JA Synthesis of Single-Site Copper Catalysts for Methane Partial Oxidation. Chem. Commun 2016, 52, 2553–2556. [DOI] [PubMed] [Google Scholar]
- (26).Zheng H; Narkhede N; Zhang G; Li Z Role of Metal Co-Cations in Improving CuY Zeolite Performance for DMC Synthesis: A Theoretical Study. Appl. Organomet. Chem 2020, 34, 1–11. [Google Scholar]
- (27).Kwon S; Kim C; Han E; Lee H; Cho HS; Choi M Relationship between Zeolite Structure and Capture Capability for Radioactive Cesium and Strontium. J. Hazard. Mater 2021, 408, 124419. [DOI] [PubMed] [Google Scholar]
- (28).Domínguez I; Pawlesa J; Zukal A; Čejka J Ferrierite and MCM-22 for the CO2 Adsorption. Stud. Surf. Sci. Catal 2008, 174, 603–606. [Google Scholar]
- (29).Keane MA Role of the Alkali Metal Co-Cation in the Ion Exchange of Y Zeolites II. Copper Ion-Exchange Equilibria. Microporous Mater 1995, 3, 385–394. [Google Scholar]
- (30).Barrer RM; Klinowski J Ion Exchange in Mordenite. J. Chem. Soc. Faraday Trans. 1 Phys. Chem. Condens. Phases 1974, 70, 2362. [Google Scholar]
- (31).Wing RM; Callahan KP Characterization of Metal-Oxygen Bridge Systems. Inorg. Chem 1969, 8, 871–874. [Google Scholar]
- (32).Pappas DK; Borfecchia E; Dyballa M; Pankin IA; Lomachenko KA; Martini A; Signorile M; Teketel S; Arstad B; Berlier G; Lamberti C; Bordiga S; Olsbye U; Lillerud KP; Svelle S; Beato P Methane to Methanol: Structure–Activity Relationships for Cu-CHA. J. Am. Chem. Soc 2017, 139, 14961–14975. [DOI] [PubMed] [Google Scholar]
- (33).Sushkevich VL; van Bokhoven JA Revisiting Copper Reduction in Zeolites: The Impact of Autoreduction and Sample Synthesis Procedure. Chem. Commun 2018, 54, 7447–7450. [DOI] [PubMed] [Google Scholar]
- (34).Sushkevich VL; Smirnov AV; Van Bokhoven JA Autoreduction of Copper in Zeolites: Role of Topology, Si/Al Ratio, and Copper Loading. J. Phys. Chem. C 2019, 123, 9926–9934. [Google Scholar]
Associated Data
This section collects any data citations, data availability statements, or supplementary materials included in this article.