Abstract
Purpose:
To determine the abundance and multimodal visibility of drusen and basal linear deposit (BLinD) in early age-related macular degeneration (AMD).
Methods:
A 69-year-old white man was imaged by color fundus (CFP) and red free (RF) photography, fundus autofluorescence (FAF) and optical coherence tomography (OCT). From en face images, we determined the drusen field, drusen area, and equivalent diameters of individual drusen. From high-resolution light-microscopic histology (6 months after the last clinic visit), we determined the area of drusen, BLinD, and pre-BLinD in a sub-retinal pigment epithelium-basal lamina lipid field.
Results:
In right and left eyes respectively, BLinD covered 40% and 46% of the lipid field, versus 21% and 14% covered by drusen. The lipid field was covered 60–61% by Drusen+BLinD and 65–72% by BLinD+pre-BLinD. In the left eye drusen area on CFP (0.18 mm2) and RF (0.28 mm2) was smaller than drusen area on histology (1.16 mm2). Among drusen confirmed by OCT, 55.1% and 56.6% were observed on RF and FAF, respectively.
Conclusion:
BLinD covered 1.9 and 3.4-fold more fundus area than soft drusen, silently increasing progression risk. Improved visualization of BLinD and readouts of RPE health over lipid will assist population surveillance, early detection, and trial outcome measures.
Keywords: Age-related macular degeneration, autofluorescence, basal linear deposit, clinicopathologic correlation, color fundus photography, drusen, histology, optical coherence tomography
Précis
In a clinicopathologic correlation basal linear deposit covered 1.9–3.4-fold more fundus area than soft drusen, potentially increasing progression risk. Improved visualization of this deposit and readouts of RPE health over it will assist population surveillance, early detection, and trial outcome measures.
Introduction
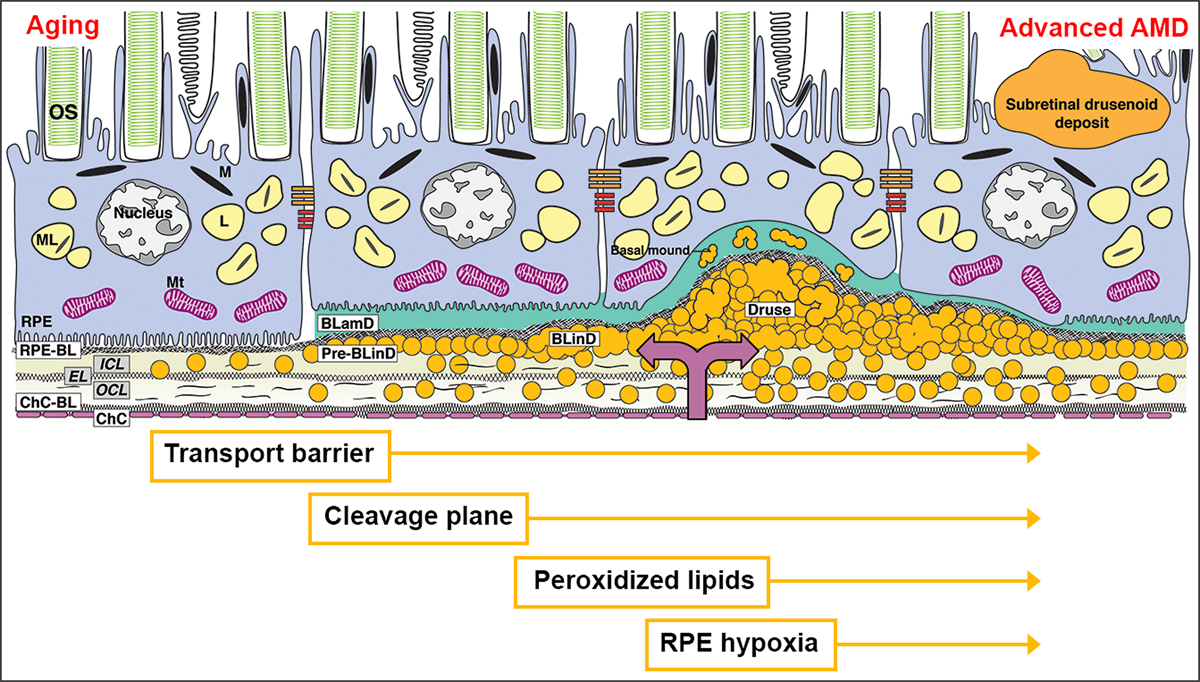
Drusen are the largest intraocular risk factor for progression to advanced age-related macular degeneration (AMD). Longitudinal population-based studies using color fundus photography (CFP) demonstrate steady accumulation and growth of drusen from midlife, concentrated in the central macula.1 Soft drusen and basal linear deposit (BLinD) are lump-and-layer versions of the same lipid-rich extracellular material located between the basal lamina of the retinal pigment epithelium (RPE-BL) and the inner collagenous layer of Bruch’s membrane (BrM) (Figure 1).2 A well-supported model of drusen formation posits that RPE secretes lipoproteins constitutively to offload unneeded lipids from dietary uptake and photoreceptor outer segments, and that this process is impeded by poor transfer across aged BrM and choriocapillaris.3 Soft drusen material is a direct precursor to AMD end-stages type 1 neovascularization (Figure 1) and atrophy.
Figure 1. An atherosclerosis-like progression due to sub-RPE-BL lipid in AMD.

The trilaminar Bruch membrane (BrM) consists of the inner collagenous layer (ICL), elastic layer (EL), and outer collagenous layer (OCL). With aging, lipoprotein particles (yellow circles) accumulate in the BrM, forming a transport barrier between the ChC and the outer retina. Pre-BLinD, a thin lipid layer between RPE-BL and the ICL of BrM, forms a cleavage plane. BLinD, continuous with pre-BLinD, contain ultrastructural evidence for lipid fusion and pooling and peroxidized lipids capable of promoting cytotoxic and pro-inflammatory response in vivo. Into this milieu, type 1 neovascularization invades (mauve double arrow). Soft drusen, a lump of the same extracellular material as in BLinD, could contribute to hypoxia of overlying RPE, which may migrate intraretinally (seen as hyperreflective foci). BLamD represents thickened RPE-BL, and basal mound is soft druse material trapped within BLamD.2 OS, outer segments of photoreceptors; RPE, retinal pigment epithelium; M, melanosome; ML, melanolipofuscin; Mt, mitochondria; RPE-BL, RPE basal lamina; BLamD, basal laminar deposit; BLinD, basal linear deposit; ChC, choriocapillaris; ChC-BL, ChC basal lamina.
Accurate quantification of soft drusen for progression risk estimates in populations and early AMD trial outcomes is doubly challenged. First, BLinD may confer similar risk as soft drusen (Figure 1) yet is not yet routinely visible either by clinical imaging or histology. Second, multimodal imaging including optical coherence tomography (OCT) has established the presence of subretinal drusenoid deposit (also called reticular pseudodrusen), which may have been counted as drusen in epidemiology studies.4
Clinicopathologic correlation of eyes imaged during life provided essential insight into sub-RPE-BL lipid.2 By analyzing via high-resolution histology fellow eyes with early AMD and in vivo multimodal OCT-based imaging, we quantified the proportion of macula containing drusen and BLinD. We also assessed pre-BLinD (Figure 1), a layer of lipoprotein particles in the sub-RPE-BL space that forms after the 3-layer substance of BrM fills up throughout adulthood. Thus for the first time in this one case, all forms of high-risk lipid could be assessed. Not only is invisible BLinD more abundant than soft drusen but also not all drusen are visible en face. Data highlight the need for outcome assessments incorporating all lipid-rich deposits.
Methods
A 69-year-old HIV-positive white man presenting with early AMD underwent color fundus and red free (RF) photography (Topcon TRC 50DX, Topcon Medical Systems, Oakland, NJ), spectral domain OCT (30°×20°, 19 scans, 240 μm spacing, Automated Real-time Averaging 10–11; Heidelberg Spectralis HRA+OCT, Heidelberg Engineering, Heidelberg, Germany), and fundus autofluorescence (FAF). CFP and RF were acquired 14 months, and OCT and AF, 6 months before death. CFP, RF, and FAF were registered to the near-infrared reflectance image by vascular landmarks and then linked to OCT. Eyes preserved 9 hours after death were post-fixed in osmium tannic acid paraphenylenediamine to preserve extracellular lipid5 and embedded in epoxy, sectioned at 0.8 μm, and stained with toluidine blue. From glass slides of the entire left macula and the inferior half of the right macula, one section per slide was scanned with 20X and 60X oil immersion objectives (Olympus VSI 120, CellSens; Olympus, Center Valley PA).
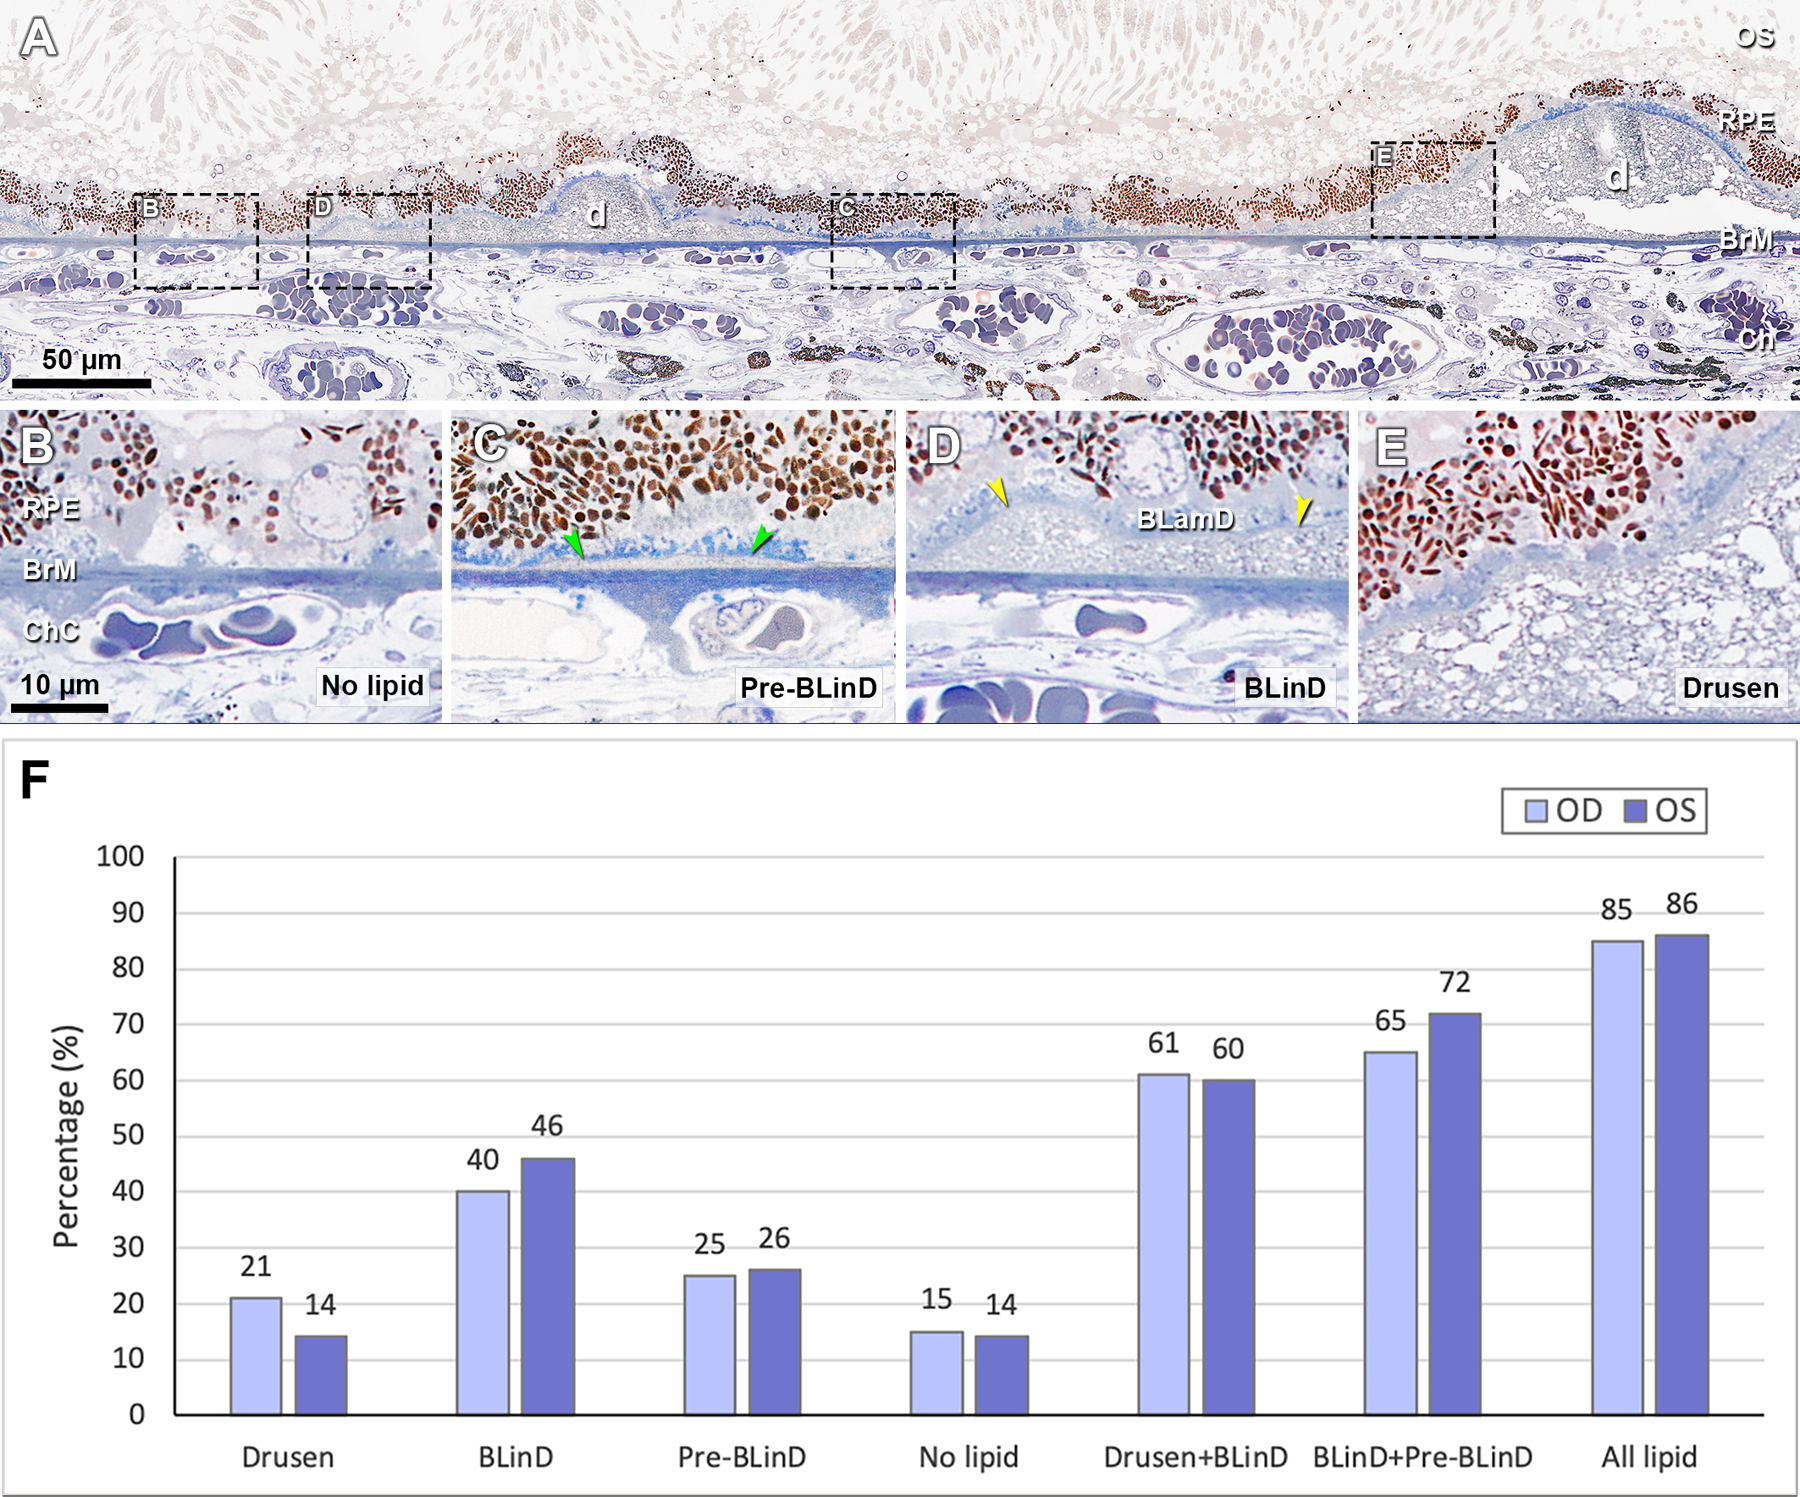
Measurements defined in supplementary table 1 utilized ImageJ (https://imagej.nih.gov/ij/download.html) except where noted. We measured histologic cross-sectional lengths of BrM covered by different categories of sub-RPE-BL lipid (Figure 2A–E). Pre-BLinD is thin, flat, gray, and finely granular. BLinD is thin, undulating, with loose osmophilic material like soft drusen. Pre-BLinD and BLinD may be continuous with yet distinct from drusen, which are dome-shaped.5 To determine BrM area covered by lipid, we multiplied cross-sectional lengths along BrM by inter-section distances (Cavalieri’s principle). The full extent of histologic lipid was considered the lipid field.
Figure 2. Distribution of categories of sub-RPE-BL lipid in early AMD.

A, Panoramic view of a section showing categories of sub-RPE-BL lipid. Black dashed frames are magnified in panels B-E. B, No sub-RPE-BL lipid. C, Pre-BLinD is a flat layer of finely granular material in gray (green arrowheads). D, BLinD is an undulating layer of the same extracellular material as in soft drusen (yellow arrowheads), usually continuous with pre-BLinD. E, Soft drusen are lump version of the same extracellular material, usually continuous with BLinD. F, Sub-RPE-BL lipid distribution in fellow eyes. RPE, retinal pigment epithelium; BL, basal lamina; BLinD, basal linear deposit; BLamD, basal laminar deposit; d, druse; OS, outer segment; BrM, Bruch’s membrane; Ch, choroid; ChC, choriocapillaris. All lipid, drusen +BLinD +pre-BLinD. Scale bar in B applies to B-E.
In clinical CFP and RF images, we measured the drusen field, a closed contour bounding visible drusen (Figure 2 A, B and D,E). Drusen area was the sum of all individual drusen (Supplementary figure 1 A1–D1). Equivalent diameters of individual drusen were calculated assuming each druse had a circular base. Lengths of drusen along BrM on OCT B-scans were measured using the Distance Measurement tool of the Spectralis. Equivalent diameters are slightly larger than cross-sectional lengths and are reported separately. We evaluated whether drusen visible on OCT were also visible in en face imaging. To assess whether ex vivo measurements were impacted by tissue volume changes during processing, we determined that the distances between the fovea and optic nerve head edge were similar in histology and clinical imaging.
The clinical imaging study was approved by the institutional review boards of the University of California, San Francisco and the University of California, Berkeley. The Foundation Fighting Blindness eye donor program provided the tissue specimens. The histopathology study was approved by the University of Alabama at Birmingham, complied with the Health Insurance Portability and Accountability Act of 1996, and adhered to the tenets of the Declaration of Helsinki.
Results
Table 1 shows histologic abundance of different categories of Sub-RPE-BL lipid. Figure 2F shows the percentage of BrM covered by these lipid forms. In the right and left eyes respectively, Drusen+BLinD, together the high-risk lesion of AMD,6 accounts for 2.81–5.08 mm2 (60–61%) of the lipid field. Clinically invisible BLinD+pre-BLinD account for 2.99–6.17 mm2 (65–72%) of the lipid field. Drusen account for only 0.97–1.16 mm2 (14–21%). Thus, the area of BLinD was 1.9–3.4 times larger than the drusen area.
Table 1.
Area and Percentage of Sub-RPE-BL Lipid in Two Donor Eyes
| Area | OD* mm2 (%) | OS mm2 (%) |
|---|---|---|
| Lipid field | 4.65 (100) | 8.50 (100) |
| Drusen | 0.97 (21) | 1.16 (14) |
| BLinD | 1.84 (40) | 3.92 (46) |
| Pre-BLinD | 1.15 (25) | 2.25 (26) |
| No lipid | 0.69 (15) | 1.14 (14) |
| Drusen + BLinD | 2.81 (61) | 5.08 (60) |
| BLinD + Pre-BLinD | 2.99 (65) | 6.17 (72) |
| Drusen + BLinD + Pre-BLinD | 3.96 (85) | 7.33 (86) |
Twenty-two representative sections from the left eye (mean distance: 156 ± 17 μm, range 90–180 μm) and 11 representative sections from the right eye (mean distance: 168 ± 24 μm, range 120–180 μm) were assessed.
Only half of the right macula (inferior) was sectioned and evaluated in histology.
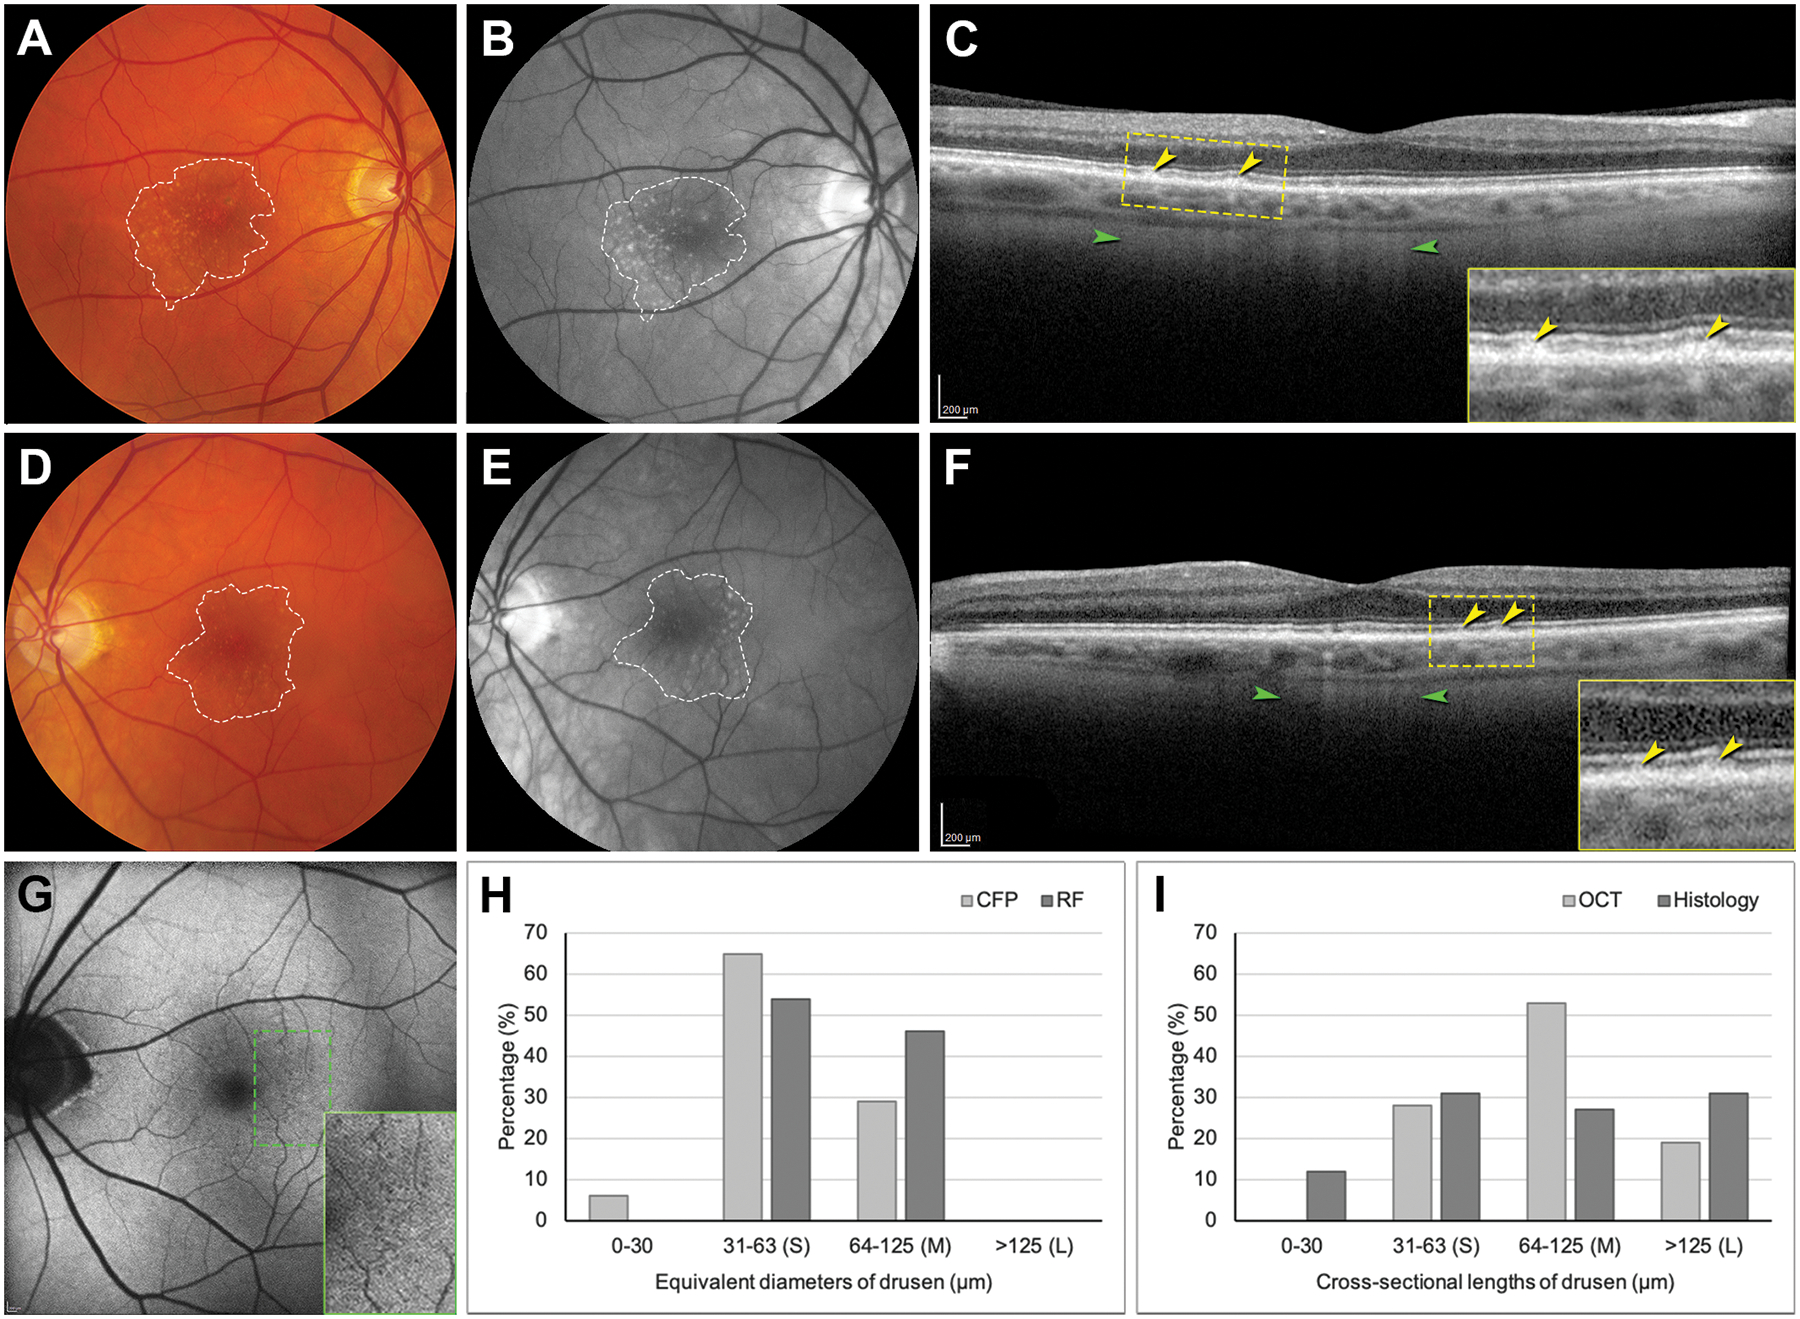
On CFP and RF clinical imaging, the drusen field was 5.44 mm2 and 5.61 mm2, respectively, in the right eye (Figure 3A,B) and 5.01 mm2 and 5.35 mm2 in the left eye (Figure 3D,E), substantially lower than in histology. Furthermore, the drusen area on CFP and RF were 0.43 mm2 and 0.55 mm2, respectively, in the right eye, and 0.18 mm2 and 0.28 mm2 in the left eye, both smaller than drusen area on histology. Figure 3H,I show drusen sizes in four different modalities in the left eye. Drusen detected on CFP and RF are mainly small (31–63 μm) and mainly medium (64–125 μm) on OCT. Interestingly, 19% and 31% of drusen were large (>125 μm) on OCT and histology, respectively, larger than any drusen seen on CFP or RF.
Figure 3. Sizes of drusen detected in clinical imaging and in histology.

A, B, D, E, Dashed lines delineate the drusen field in CFP (A, D) and RF (B, E) images. RF image shows drusen better than CFP. CFP and RF were acquired 14 months before death and OCT and AF, 6 months before death. C, F, OCT B-scan through the fovea shows RPE elevations (yellow; see inset). Stripes of hypertransmission (green), indicating RPE degeneration, are not confined to drusen but is prominent at some. G, AF of the left eye shows multiple tiny hypoautofluorescent dots in temporal macula (green dashed rectangle; magnified in inset). H, Distribution of equivalent diameters of drusen on CFP and RF in the left eye. I, Distribution of cross-sectional lengths of drusen on OCT and histology in the left eye. CFP, color fundus photograph; RF, red free; OCT, optical coherence tomography; RPE, retinal pigment epithelium; AF, autofluorescence. S, small drusen; M, medium drusen; L, large drusen.
OCT revealed in both eyes fine stripes of hypertransmission, not confined to drusen but prominent at some (Figure 3C,F). These are attributed to degenerating RPE with fewer shadowing organelles in the light path7. Of 127 drusen confirmed by OCT in right and left eyes, 70 (55.1%) were visible within 80 μm of the same locations on RF, and 57 (44.9%) could not be found. In the left eye (Figure 3G) were small tiny hypoautofluorescent dots with or without a faint circumferential ring of increased FAF.8 Among 53 drusen confirmed in OCT B-scans in the left eye, 30 (56.6%) were visible on FAF, and 23 (43.4%) could not be found. FAF for the right eye, of lower quality, showed no major autofluorescence variation.
Discussion
For the first time the full extent of histologically identifiable sub-RPE-BL lipid in AMD has been quantified. BLinD, which is invisible to multimodal clinical imaging, covered 1.9–3.4 times more fundus area than soft drusen. Thus, BLinD could substantially but silently increase progression risk. Drusen seen en face by CFP, RF and FAF appear smaller than seen by OCT, likely because druse visibility depends on the degree of associated RPE change. FAF signal variation in the drusen field included some definite hypoautofluorescence, owing to lipofuscin loss and re-arrangement within dysmorphic RPE.9
Drusen are quantifiable with commercially available OCT. Stabilization or diminution of drusen volume is proposed as part of a composite outcome measure for clinical trials of therapies targeting early and intermediate AMD stages.10 This attractive concept is challenging to implement, due to the dynamism of drusen. Our new data further show that drusen may be only a fraction of an overall lipid field, a relevant consideration if lipid detoxification or removal is the goal.11 One inference from our data is that rather than directly measure sub-RPE-BL lipid, the impact of that lipid could be assessed with a metric of RPE health. This idea is supported by both the pinstripe hypertransmission seen on OCT and the delicate hypoautofluorescence seen in this case (Figure 3C&F). In this scenario, a suitable trial endpoint could be stabilization of hypertransmission in the absence of progression.
Our data also suggest that for the future, techniques for visualizing soft drusen material could be improved. Existing, prototype, and experimental imaging technologies with such capabilities12–14 should be prioritized for study and validation. Recently, hypofluorescence in late-phase indocyanine green angiography was proposed as a candidate imaging correlate for BLinD, because soft drusen are also hypofluorescent.12 Supporting this idea was an age-related increase in hypofluorescence across the macula.
Study strengths include quantitative, high-resolution and comprehensive histology of early AMD eyes with in vivo multimodal imaging. Limitations include limited generalizability due to the study of one case, varying time points for imaging modalities, and known imprecision in clinical image registration.15 In conclusion, BLinD covers an area 1.9– 3.4 times larger than soft drusen and may silently increase AMD progression risk. Not all soft drusen are clinically visible; more are seen with OCT than fundus photography, which may show primarily depigmentation associated with drusen. As new treatments become available, population surveillance and early detection of AMD will become imperative. Progress toward these goals will be aided by improved visualization of BLinD and in the near term, RPE health over lipid.
Supplementary Material
Financial support:
This work was supported by Genentech/ Hoffman LaRoche, Heidelberg Engineering, The Macula Foundation, Inc., New York, NY; unrestricted funds to the Department of Ophthalmology and Visual Sciences (UAB and UCSF) from Research to Prevent Blindness, Inc., Foundation Fighting Blindness, The Beckman/Ryan Initiative for Macular Research and EyeSight Foundation of Alabama; NEI-R01EY023591 and P30EY003176 (Roorda)
Footnotes
Financial disclosure:
CAC receives research support from Genentech/ Hoffman LaRoche, Regeneron, Heidelberg Engineering and consults for Apellis, Astellas, Boehringer Ingelheim, Character Biosciences, and Osanni (all outside this project).
JLD receives clinical trial support from AGTC, Allergan/Abbvie, Biogen, Acucela, ProQR, and PYC Therapeutics (all outside this project).
References
- 1.Wang JJ, Rochtchina E, Lee AJ et al. Ten-year incidence and progression of age-related maculopathy: the blue Mountains Eye Study. Ophthalmology 2007; 114:92–98. [DOI] [PubMed] [Google Scholar]
- 2.Sarks S, Cherepanoff S, Killingsworth M and Sarks J. Relationship of basal laminar deposit and membranous debris to the clinical presentation of early age-related macular degeneration. Invest Ophthalmol Vis Sci 2007; 48:968–977. [DOI] [PubMed] [Google Scholar]
- 3.Curcio CA. Soft drusen in age-related macular degeneration: biology and targeting via the oil spill strategies. Invest Ophthalmol Vis Sci 2018; 59:AMD160–AMD181. [DOI] [PMC free article] [PubMed] [Google Scholar]
- 4.Zweifel SA, Spaide RF, Curcio CA et al. Reticular pseudodrusen are subretinal drusenoid deposits. Ophthalmology 2010; 117:303–312 e301. [DOI] [PubMed] [Google Scholar]
- 5.Curcio CA, Messinger JD, Sloan KR et al. Subretinal drusenoid deposits in non-neovascular age-related macular degeneration: morphology, prevalence, topography, and biogenesis model. Retina 2013; 33:265–276. [DOI] [PMC free article] [PubMed] [Google Scholar]
- 6.Sarks JP, Sarks SH and Killingsworth MC. Evolution of soft drusen in age-related macular degeneration. Eye (Lond) 1994; 8 (Pt 3):269–283. [DOI] [PubMed] [Google Scholar]
- 7.Xu X, Liu X, Wang X et al. Retinal pigment epithelium degeneration associated with subretinal drusenoid deposits in age-related macular degeneration. Am J Ophthalmol 2017; 175:87–98. [DOI] [PMC free article] [PubMed] [Google Scholar]
- 8.Suzuki M, Curcio CA, Mullins RF and Spaide RF. Refractile drusen: clinical imaging and candidate histology. Retina 2015; 35:859–865. [DOI] [PubMed] [Google Scholar]
- 9.Gambril JA, Sloan KR, Swain TA et al. Quantifying Retinal Pigment Epithelium Dysmorphia and Loss of Histologic Autofluorescence in Age-Related Macular Degeneration. Invest Ophthalmol Vis Sci 2019; 60:2481–2493. [DOI] [PMC free article] [PubMed] [Google Scholar]
- 10.Schaal KB, Rosenfeld PJ, Gregori G et al. Anatomic clinical trial endpoints for nonexudative age-related macular degeneration. Ophthalmology 2016; 123:1060–1079. [DOI] [PubMed] [Google Scholar]
- 11.Rudolf M, Curcio CA, Schlotzer-Schrehardt U et al. Apolipoprotein A-I mimetic peptide L-4F removes bruch’s membrane lipids in aged nonhuman primates. Invest Ophthalmol Vis Sci 2019; 60:461–472. [DOI] [PubMed] [Google Scholar]
- 12.Chen L, Zhang X, Li M et al. Drusen and age-related scattered hypofluorescent spots on late-phase indocyanine green angiography, a candidate correlate of lipid accumulation. Invest Ophthalmol Vis Sci 2018; 59:5237–5245. [DOI] [PubMed] [Google Scholar]
- 13.Chong SP, Zhang T, Kho A et al. Ultrahigh resolution retinal imaging by visible light OCT with longitudinal achromatization. Biomed Opt Express 2018; 9:1477–1491. [DOI] [PMC free article] [PubMed] [Google Scholar]
- 14.Tong Y, Ben Ami T, Hong S et al. Hyperspectral autofluorescence imaging of drusen and retinal pigment epithelium in donor eyes with age-related macular degeneration. Retina 2016; 36 Suppl 1:S127–S136. [DOI] [PMC free article] [PubMed] [Google Scholar]
- 15.Vongkulsiri S, Suzuki M and Spaide RF. Colocalization error between the scanning laser ophthalmoscope infrared reflectance and optical coherence tomography images of the heidelberg spectralis. Retina 2015; 35:1211–1215. [DOI] [PubMed] [Google Scholar]
Associated Data
This section collects any data citations, data availability statements, or supplementary materials included in this article.


