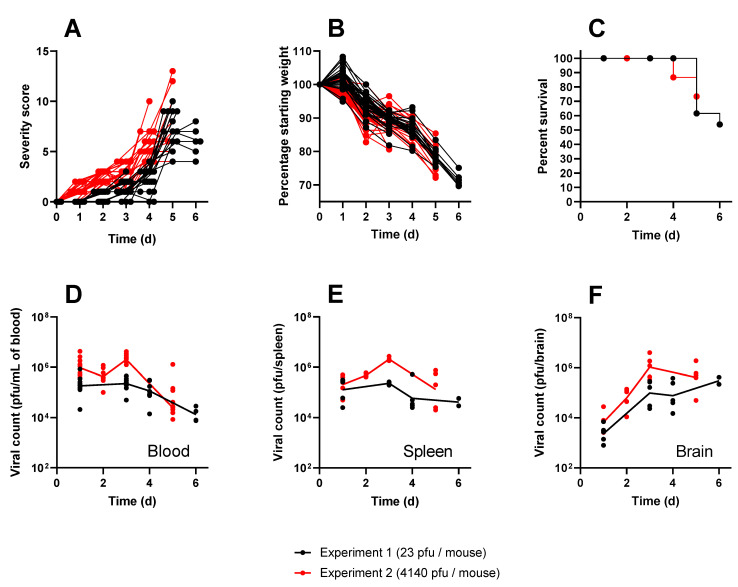
Figure 2.
The clinical characteristics of Balb/c mice infected with either (black) or (red) of VEEV TrD via the subcutaneous route. Panel (A) shows individual clinical scores from each mouse, assigned by blinded operators using pre-determined criteria. Each line represents the fate of a single mouse ending at either a pre-determined cull or lethal endpoint. Panel (B) shows individual weight profiles from each mouse relative to their starting weight, expressed as a percentage. Each line represents the fate of a single mouse ending at either a pre-determined cull or lethal endpoint. Panel (C) shows the Kaplan–Meier estimates. It should be noted that the majority of mice were culled for experimental purposes and, as regards the Kaplan–Meier estimate, are considered censored from the point of cull. For this reason, the survival in this experiment does not drop below 50%. Panels D to F show the viral titres measured at specific time points after infection in the blood (D), spleen (E), and brain (F). Each data point shows a single mouse, and the line is the geometric mean for each group.

