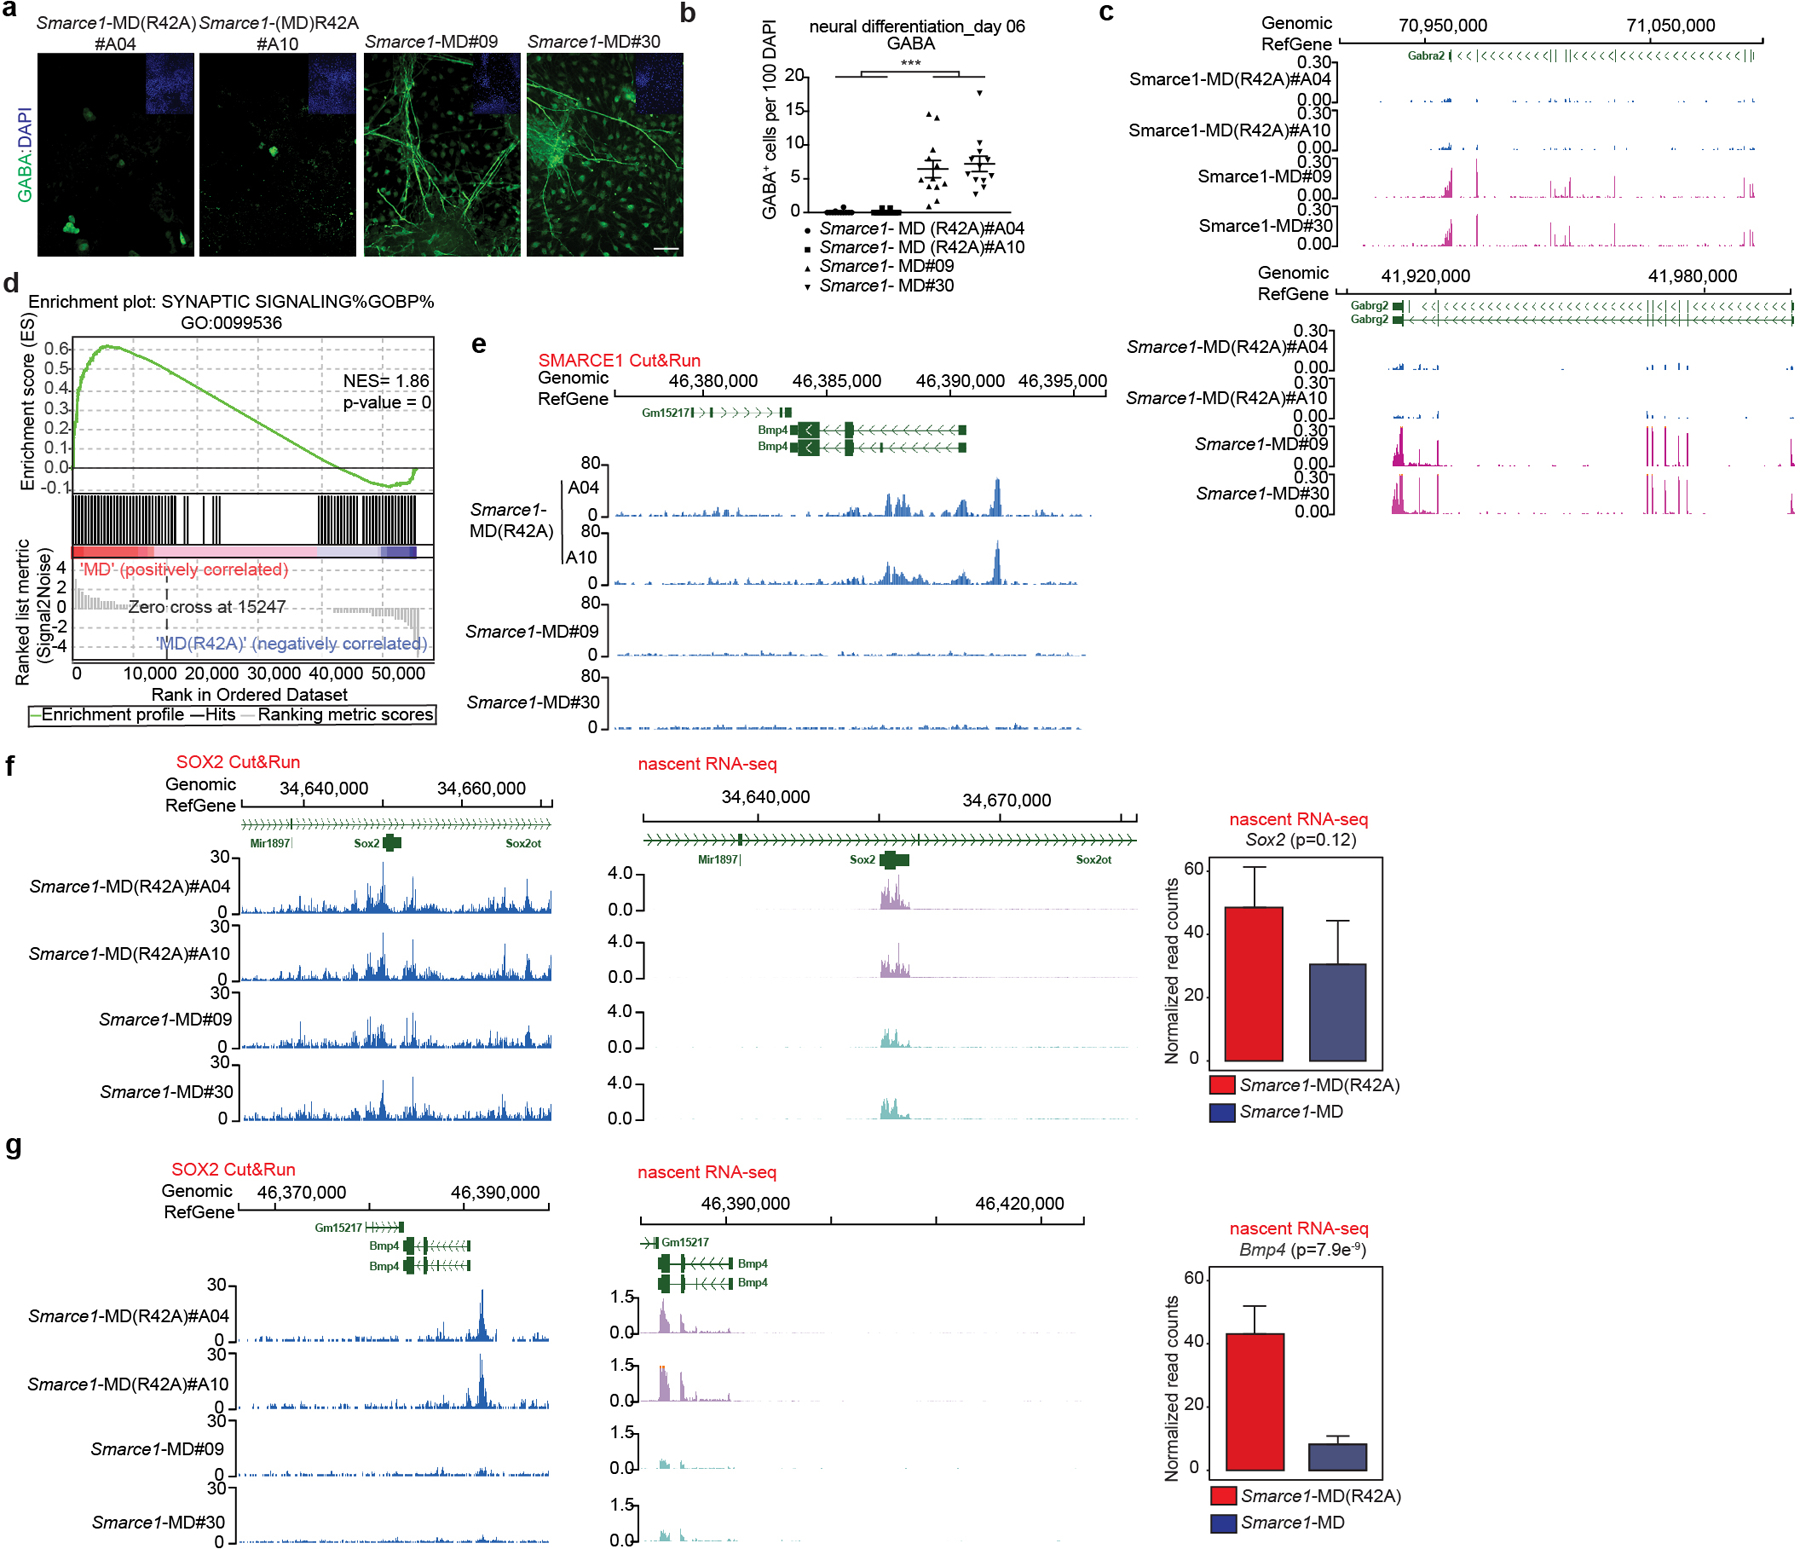
Fig 4. Mitotic SMARCE1 and neural differentiation.

a, Representative immunohistochemical staining of GABA, with DAPI counter-stain in Smarce1-MD (R42A) and Smarce1-MD cultures at day six after neural induction. Scale bar: 50 μm. b, Statistical analysis of the data in (a). c, d, Differential gene expression profiles in Smarce1-MD (R42A) and Smarce1-MD cultures at day six after neural induction. (c) Representative browser track showing Gabra2 and Gabrg2 expression. (d) Representative example of GSEA enrichment plot of genes in synaptic signaling pathway. (nominal P= 0, nonparametric permutation test). NES, normalized enrichment score. e, Representative browser track for SMARCE1 binding at the Bmp4 locus in control Smarce1-MD (R42A) and Smarce1-MD mouse ES cells at 90 min after mitotic release. f, g, Representative browser tracks for SOX2 binding and nascent transcripts at Sox2 (f) and Bmp4 (g) loci in Smarce1-MD (R42A) and Smarce1-MD mouse ES cells at 90 min after mitotic release. Data are representative of two biological replicates for each clone (Smarce1-MD (R42A) #A04 and #A10, Smarce1-MD#09 and #30) (a, c, e, f, g); or compiled from two independent experiments each assessing two clones of each genotype (b, d) and test is performed in DESeq2 Wald test (f, g). Data are shown as mean± s.e.m., n=12 images pooled from two independent experiments / each sample; significance is calculated using two- tailed unpaired Student’s t-Test (*** p= 3.85e−8) (b).
