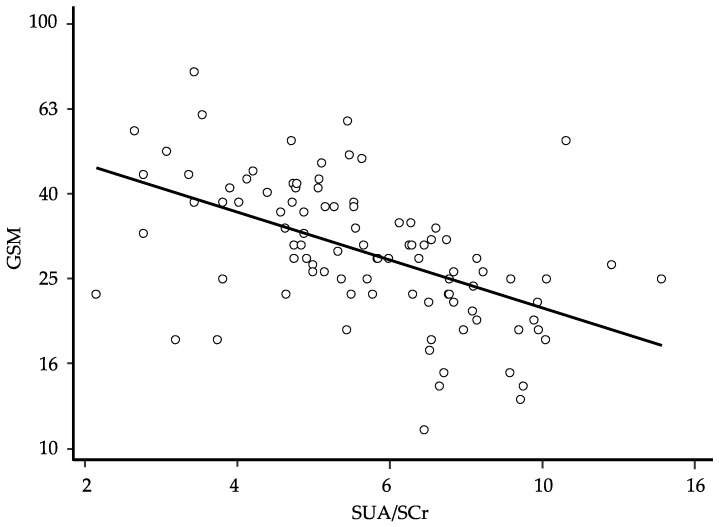
Figure 1.
Relationship between the grayscale median (GSM) and the serum uric acid/serum creatinine (SUA/SCr) ratio at baseline; regression line fitted after logarithmic transformation of the data and elimination of 10 residual outliers to ensure the normal distribution of the residues (β: −0.567; 95% CI −0.751 to −0.384, p < 0.0001, and n = 98); for ease of interpretation, the results of calculations are back-transformed to their original scale.

