Abstract
Production of oxidized biomass, which requires regeneration of the cofactor NAD+, can be a proliferation bottleneck that is influenced by environmental conditions. However, a comprehensive quantitative understanding of metabolic processes that may be affected by NAD+ deficiency is currently missing. Here, we use computational and experimental approaches to demonstrate that in addition to requiring oxygen for lipid desaturation reactions, de novo lipid biosynthesis can impose a substantial NAD+ consumption cost in proliferating cancer cells. Our results reveal that when electron acceptors are limited environmental lipids become crucial for proliferation because NAD+ is required to generate precursors for fatty acid biosynthesis. We find that both oxidative and even net reductive pathways for lipogenic citrate synthesis are gated by reactions that depend on NAD+ availability. We also show that access to acetate can relieve lipid auxotrophy by bypassing the NAD+ consuming reactions involved in de novo lipid synthesis. Consistent with biochemical results, analysis of gene expression across diverse tumor types demonstrates that lipid biosynthesis strongly anticorrelates with expression of hypoxia markers, whereas lipid uptake genes are consistently upregulated in hypoxia. Overall, our results define a requirement for oxidative metabolism to support de novo lipid biosynthesis and provide a mechanistic explanation for cancer cell dependence on lipid uptake in electron acceptors limited conditions such as hypoxia.
Many proliferating cancer cells incorporate biomass precursors such as amino acids, nucleic acids, and lipids from their environment1–4. Nonetheless, nutrient and oxygen availability vary across tumors5–7 and these differences in environment can govern the metabolic pathways used to support proliferation5,8,9. Metabolism of nutrients to produce oxidized biomass precursors requires regeneration of the cofactor NAD+ to serve as an electron acceptor, and there is accumulating evidence that NAD+ availability can be limiting for biomass production and cell proliferation in vivo and in vitro10–17. Specifically, NAD+ regeneration has been shown to be important for the biosynthesis of aspartate, nucleotides, and serine11,13,17–19. Conversely, synthesis of other molecules such as select fatty acids have been proposed to support proliferation by enabling NAD+ regeneration20. However, a systems-level quantitative analysis of the NAD+ consumption costs required to produce various biomass components is currently missing.
Lipids are essential components of cellular biomass, and de novo lipid biosynthesis is generally considered to be a reductive process. The production of reducing equivalents in the form of NADPH has long known to be a prerequisite for fatty acid synthesis21. Notably, the desaturation of fatty acids requires NAD(P)H and regenerates NAD(P)+, although these reactions also require molecular oxygen20,22. Lipid metabolism is also connected with cellular energetics. The synthesis of free fatty acids is controlled by the energy-sensing AMP-activated Protein Kinase (AMPK), as fatty acid synthesis requires ATP, while fatty acid oxidation can be an important source of energy for cells23,24. Previous studies have found that under conditions of oxygen limitation, cancer cell proliferation and survival becomes dependent on access to exogenous lipids, suggesting that this phenotype is driven by the requirement for oxygen in energy generation and/or lipid desaturation reactions25–28. However, oxygen also serves as terminal electron acceptor to regenerate NAD+, and this requirement can substantially exceed the demand for lipid desaturation reactions and ATP generation at least in some contexts29. Cells respond to oxygen limitation via stabilization of Hypoxia Inducible Factor (HIF1α)30, which promotes a shift in carbon source for lipogenic citrate from glucose oxidation to glutamine reduction31–34. Nevertheless, in all known instances where reductive glutamine metabolism is used to generate fatty acids, the rate of fatty acid synthesis is less than the rate from oxidative glucose metabolism, but why this is the case, and what ultimately governs the rates of lipogenic citrate production from different carbon sources remains an open question.
In this study, we combined computational and experimental approaches to demonstrate that de novo synthesis of lipogenic citrate incurs a substantial NAD+ consumption cost. We then investigated the biochemical and regulatory mechanisms underlying the dependency of cancer cell proliferation on exogenous lipids in hypoxia or when the electron transport chain is inhibited in normoxia. We first explored this question by enabling alternative pathways for NAD+ regeneration and by providing nutrients that can bypass or relieve the NAD+ requirement for de novo lipid synthesis. We then performed kinetic isotope tracing experiments to identify specific reactions that gate lipogenic citrate synthesis from glucose and glutamine when electron acceptors are limited. We also investigated regulatory interaction that may influence the rewiring of lipid metabolism in hypoxia and when the electron transport chain is inhibited. Finally, we analyzed the expression correlations of fatty acids synthesis and uptake pathways with hypoxia markers across a large collection of diverse tumors. Together, our experiments reveal how NAD+ availability can govern the rate of lipid biosynthesis in cancer cells, and therefore provide a mechanistic biochemical explanation for the lipid auxotrophy of cancer cells in conditions where electron acceptors are limited such as hypoxia.
Results
NAD+ availability can be limiting for cell proliferation in many contexts10–17. To quantify the potential requirements for NAD+ regeneration to support biomass synthesis and proliferation in cells, we used a genome-scale stoichiometric model of human cell metabolism35. We applied Flux Balance Analysis (FBA)36 to calculate the minimal levels of NAD+ consumption required for the de novo synthesis of major biomass components (see full Methods). To accomplish this, we first pruned the original genome-scale model to retain key metabolic reactions that are likely involved in biomass production37,38. The automatic pruning procedure was constrained such that the resulting models approximated experimentally measured metabolic exchange fluxes for each of the NCI60 cell lines3. Each of the resulting FBA models comprised ~600 reactions that allowed the models to support biomass synthesis and reflected cell line heterogeneity. We then used the obtained FBA models to estimate the minimum level of NAD+ consumption needed for the production of lipogenic acetyl-CoA from glucose and glutamine, as well as for the synthesis of nucleotides and non-essential amino acids (see full Methods). The model was able to recapitulate previous findings that aspartate, serine, and nucleotides all have an associated NAD+ cost of production that can be limiting for proliferation (Fig. 1a)11,13,17–19. Surprisingly, the computational model also predicted a significant NAD+ cost of lipid synthesis (Fig. 1a). In mammalian cells, lipogenic acetyl-CoA is reported to be synthesized either through glucose oxidation1,39–41, which requires NAD+ for glycolysis, the pyruvate dehydrogenase (PDH) reaction, and TCA cycle reactions needed to produce citrate, or through reductive carboxylation of glutamine-derived alpha-ketoglutarate (αKG), where the production of αKG from glutamine-derived glutamate can either directly consume NAD+ or indirectly requires access to electron acceptors downstream of any transamination reaction11,39,42–44(Fig. 1b). Notably, the computational analysis predicted that de novo lipogenic acetyl-CoA synthesis, either from glucose or from glutamine, incurs a substantial NAD+ consumption cost that could exceed the demand for production of other major biomass precursors (Fig. 1a). While the synthesis of fatty acids or sterols from acetyl-CoA is a reductive process that requires NADPH, this analysis highlighted that there is also an extensive oxidative NAD+ consumption cost associated with the production of lipogenic acetyl-coA.
Fig. 1 |. Increased lipid synthesis results in increased oxygen consumption and is predicted to increase cellular demand for NAD+.
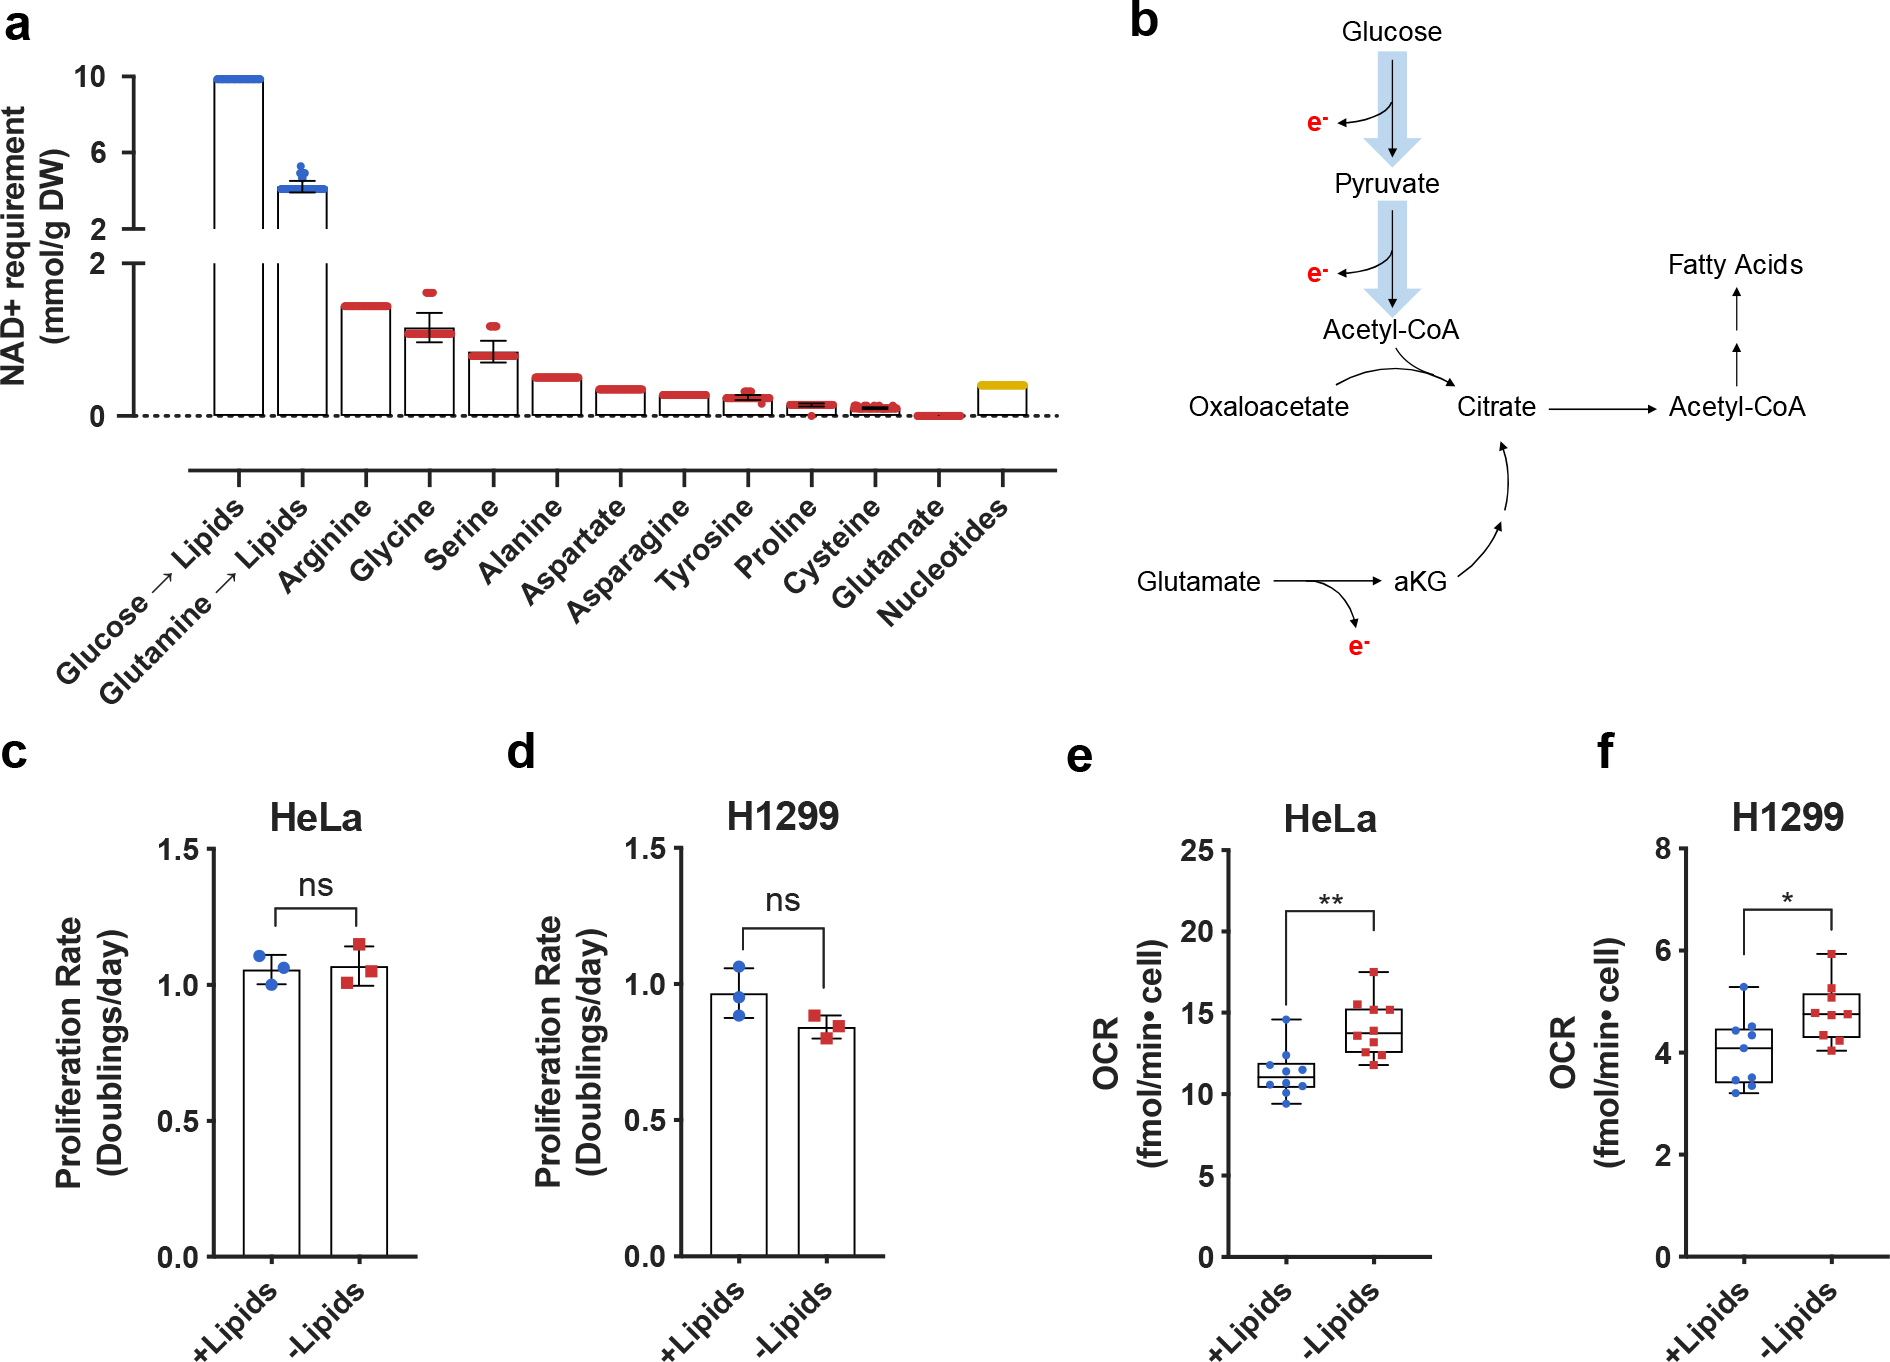
a, Quantitative predictions for the NAD+ consumption cost of de novo synthesis of biomass components lipids (blue), nonessential amino acids (red), and nucleotides (yellow) based on metabolic flux modelling. The NAD+ consumption cost is shown separately for synthesis of lipids via oxidative glucose metabolism (Glucose → Lipids) and reductive glutamine metabolism (Glutamine → Lipids). Error bars denote the standard deviations of costs calculated across models of NCI-60 cancer cell lines. Each individual value denotes a single cell line prediction from the NCI-60 panel. B, Schematic showing routes of citrate production and their associated requirements for electron (e−) disposal. Reactions requiring e− disposal either directly or indirectly require NAD+ as an e− acceptor. c, Cell culture media was prepared with delipidated serum, and then reconstituted with 1% Lipid Mixture (2 μg/ml arachidonic and 10 μg/ml each linoleic, linolenic, myristic, oleic, palmitic and stearic acid, and 0.22 mg/ml cholesterol) (+lipids) or vehicle (−lipids). Proliferation rate of HeLa cells cultured in media +lipids or −lipids as indicated (n=3 per condition from a representative experiment). d, Proliferation rate of H1299 cells cultured in media +lipids or −lipids as indicated (n=3 per condition from a representative experiment). e, Mitochondrial oxygen consumption rate (OCR) of HeLa cells cultured in media +lipids or −lipids as indicated (n=10 per condition from a representative experiment). f, Mitochondrial OCR of H1299 cells cultured in media +lipids or −lipids as indicated (n=10 per condition from a representative experiment). All data represent mean ± s.d. *P < 0.05, **P < 0.01, ns P > 0.05, unpaired Student’s t-test. All experiments were repeated 3 or more times.
To test the model prediction that access to NAD+ can be limiting for lipid synthesis, we first examined whether increasing de novo lipid synthesis increases the rate of NAD+ regeneration via mitochondrial respiration, as this is a major route to regenerate NAD+ and support oxidation reactions in cells. To that end, we cultured cancer cells in standard normoxic conditions in media with serum that was chemically stripped of lipids using n-butanol and diisopropyl ether extraction (−lipids), or in the same media with lipids (0.02 μg/ml arachidonic and 0.1 μg/ml each linoleic, linolenic, myristic, oleic, palmitic and stearic acid, and 22 μg/ml cholesterol) added back (+lipids)1,45. As previously demonstrated, proliferation rates were similar in the presence or absence of exogenous lipids (Fig. 1c,d)1; however, cells cultured in the absence of exogenous lipids have increased palmitate synthesis rates and increased sensitivity to fatty acid synthase (FASN) inhibition (Extended Data Fig. 1a–b). These data are consistent with a requirement for increased de novo lipogenesis in lipid-depleted conditions. Next, we reasoned that if increased NAD+ regeneration is necessary to support upregulated lipid synthesis, oxygen consumption may also increase25,28. Indeed, oxygen consumption rate (OCR) increased in cells cultured in lipid-depleted conditions, and this elevated OCR was sensitive to the mitochondrial electron transport chain inhibitors rotenone and antimycin A (Fig. 1e,f, Extended Data Fig. 1c–d). The difference in OCR between lipid-rich and lipid-depleted conditions is consistent with our computational estimations of the NAD+ recycling need for lipid biosynthesis which was inferred from the cells’ lipid composition and proliferation rates (see Extended Materials and Methods). Both the experimental and computational results suggest that up to 30% of the overall oxygen uptake in cells primarily relying on de novo lipid biosynthesis is associated with the regeneration of NAD+ required for lipid production. We note that this oxygen uptake requirement is about an order of magnitude higher than the oxygen consumption necessary for lipid desaturation reactions (see Extended Materials and Methods). Interestingly, the increased OCR in lipid-depleted conditions was rapidly reversible (within minutes) upon re-addition of lipids (Extended Data Fig. 1e).
Prior work has attributed the increased OCR associated with upregulation of lipid synthesis to increased ATP demand driving increased oxidative phosphorylation, as well as to an increased need for oxygen to desaturate fatty acids25,28. The finding that OCR is sensitive to inhibitors of mitochondrial electron transport chain (Extended Data Fig. 1c–d) argues that the use of molecular oxygen for desaturation reactions cannot fully explain the observed increase in OCR. Furthermore, when the Stearyl-CoA Desaturase 1 (SCD1) inhibitor A939572 was added to cells, we observed relatively minor changes in OCR compared to ones observed with mitochondrial electron transport chain inhibitors (Extended Data Fig. 1f). These results suggest that the increased mitochondrial OCR could reflect both an increased demand for ATP and for NAD+ regeneration as an explanation for upregulated mitochondrial respiration.
To investigate whether NAD+ regeneration is limiting for lipid synthesis and substantially contributes to the increased OCR observed in lipid-depleted conditions, we first considered the relationship between de novo lipid synthesis and hypoxia. Previous studies have implicated hypoxia in conferring lipid auxotrophy in vivo and in vitro25,46. These studies explored the possibility that hypoxia either directly limits oxygen availability for lipid desaturation reactions or downregulates citrate production through Pyruvate Dehydrogenase Kinase 1 (PDK1) mediated inhibition of Pyruvate Dehydrogenase (PDH)47,48, which catalyzes pyruvate conversion to acetyl-CoA26,49–54. However, hypoxia also reduces NAD+ regeneration via mitochondrial electron transport and therefore decreases the NAD+/NADH ratio5,8,55. Consistent with previous findings, culturing cells in the absence of exogenous lipids resulted in decreased proliferation in hypoxic but not normoxic conditions25,46 (Fig. 2a, Extended Data Fig. 2a). Exposing cells to inhibitors of mitochondrial electron transport in normoxia similarly decreased cell proliferation (Fig. 2b, Extended data Fig. 2b,c). Culturing cells with phenformin, a mitochondrial Complex I inhibitor56, resulted in reduced palmitate synthesis and decreased proliferation in the absence of exogenous lipids (Fig. 2b, Extended Data Fig. 1b, Extended Data Fig. 2b,c); other mitochondrial electron transport chain inhibitors, such as rotenone and antimycin A, had similar effects (Fig. 2c, Extended Data Fig. 2b,c). Notably, neither phenformin nor antimycin A altered PDH (S293) phosphorylation, suggesting that their effects on reducing cell growth cannot be explained by PDK-mediated inhibition of PDH (Extended Data Fig. 5d), and the presence of oxygen suggests that oxygen-dependent lipid desaturation also cannot explain inhibition of lipid synthesis and cell proliferation in these experiments. Furthermore, the addition of a mixture of exogenous lipids to phenformin-treated cells rescued proliferation to the rates observed in culture conditions with non-delipidated serum (Extended Data Fig. 2d). The addition of individual lipids such as oleate and/or mevalonate were partially able to recapitulate the effects of adding the lipid mixture, suggesting ETC inhibition is limiting lipid synthesis en mass, rather than production of any individual lipid species (Extended Data Fig 2e,f). Taken together, these data suggest that the deficit in NAD+ regeneration substantially contributes to downregulation of lipid synthesis and reduced cancer cell proliferation in the absence of exogenous lipids.
Fig. 2 |. Electron acceptor availability dictates proliferation rate in the absence of exogenous lipids.
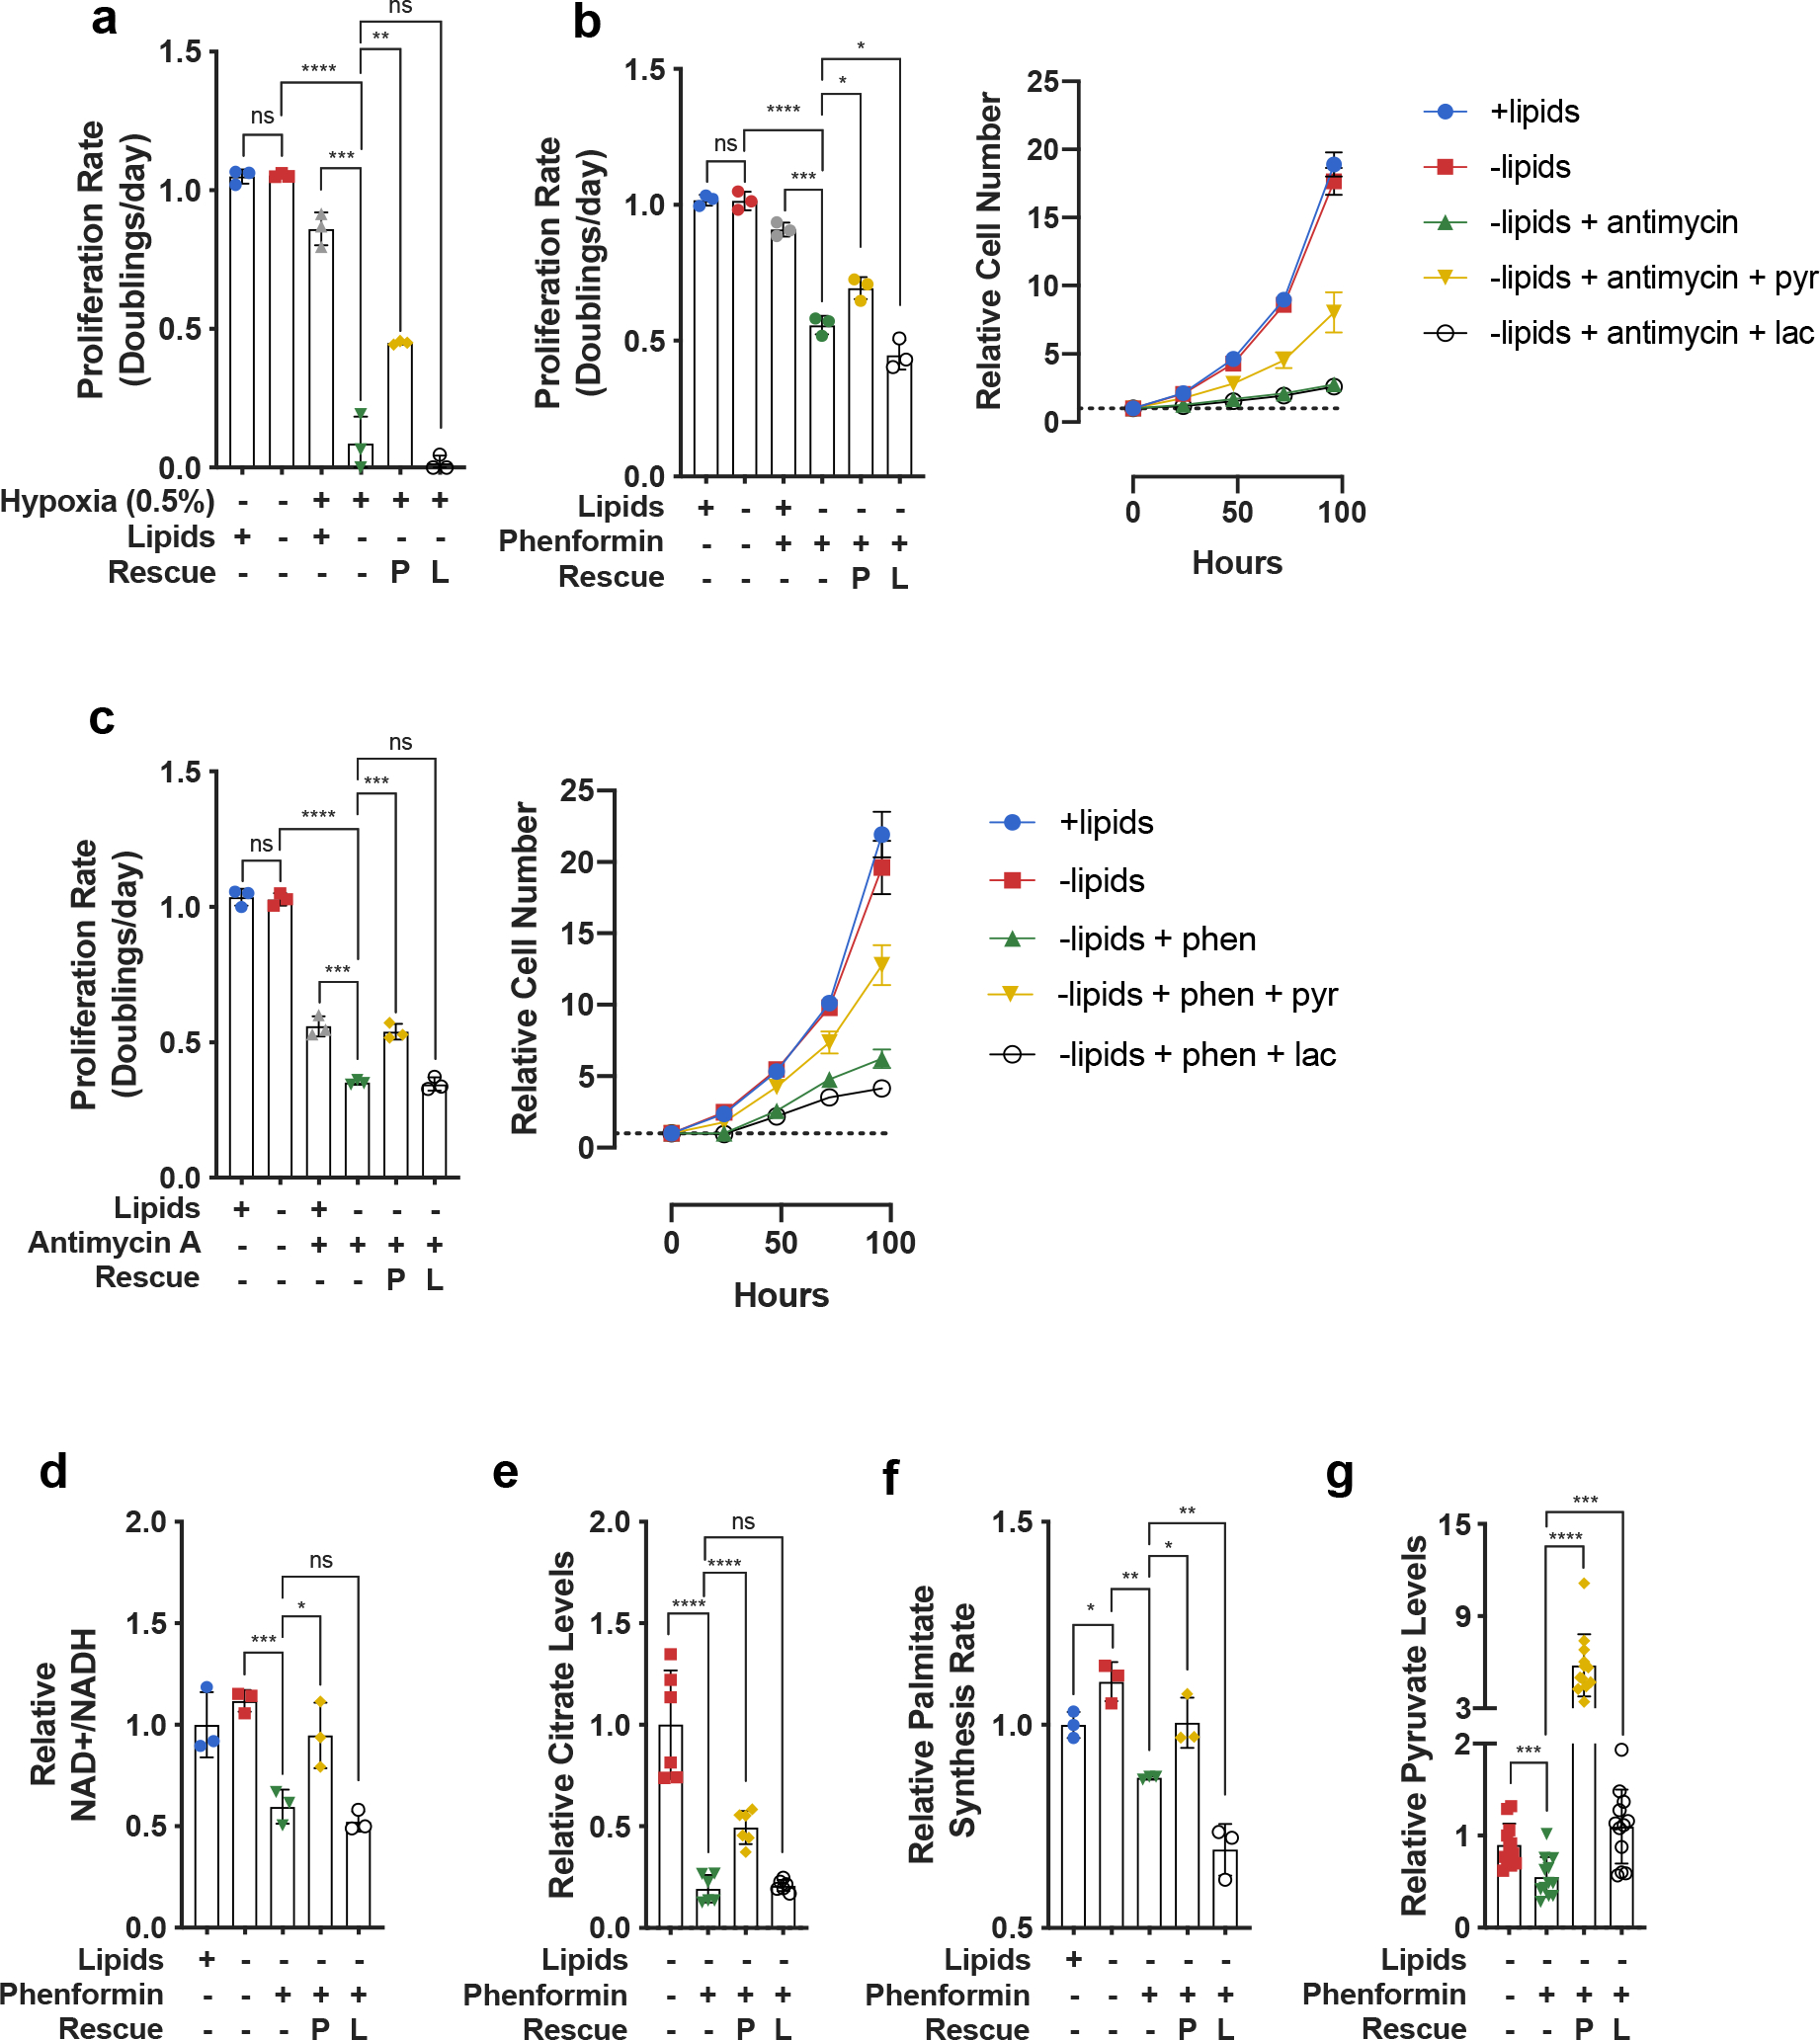
a, Proliferation rates of HeLa cells cultured in media +lipids or −lipids in normoxia (21% oxygen) or hypoxia (0.5% oxygen), without or with pyruvate (1mM, P) and/or lactate (10mM, L) as indicated (n=3 per condition from a representative experiment). b, (left) Proliferation rates of HeLa cells cultured in media +lipids or −lipids, without or with phenformin (100μM), pyruvate (1mM, P), and/or lactate (10mM, L) as indicated. (right) Cell number over time of HeLa cells cultured in media +lipids or −lipids, without or with phenformin (100μM), pyruvate (1mM, P), and/or lactate (10mM, L) as indicated (n=3 per condition from a representative experiment). c, (left) Proliferation rates of HeLa cells cultured in media +lipids or −lipids, without or with antimycin A (200nM), pyruvate (1mM, P), and/or lactate (10mM, L) as indicated. (right) Cell number over time of HeLa cells cultured in media +lipids or −lipids, without or with antimycin A (200nM), pyruvate (1mM, P), and/or lactate (10mM, L) as indicated (n=3 per condition from a representative experiment). d, Relative NAD+/NADH ratio in HeLa cells cultured in media +lipids or −lipids, without or with phenformin (100μM), pyruvate (1mM, P), and/or lactate (10mM, L) as indicated (n=3 per condition from a representative experiment). e, Relative intracellular citrate levels in HeLa cells cultured in media +lipids or −lipids, without or with phenformin (100μM), pyruvate (1mM, P), and/or lactate (10mM, L) as indicated (n=3 per condition from a representative experiment). f, Relative palmitate synthesis rates of HeLa cells cultured in media +lipids or −lipids, without or with phenformin (100μM), pyruvate (1mM, P), and/or lactate (10mM, L) as indicated (n=3 per condition from a representative experiment). g, Relative intracellular pyruvate levels in HeLa cells cultured in media +lipids or −lipids, without or with phenformin (100μM), pyruvate (1mM, P), and/or lactate (10mM, L) as indicated (n=3 per condition from a representative experiment). All data represent mean ± s.d. *P < 0.05, **P < 0.01, ***P < 0.001, ****P < 0.0001, ns P > 0.05, unpaired Student’s t-test. All experiments were repeated 3 or more times.
To further test whether de novo lipogenesis is limited by NAD+ regeneration in hypoxia or following mitochondrial electron transport inhibition, we investigated whether providing an alternative electron acceptor such as pyruvate would rescue cell proliferation in delipidated media, as exogenous pyruvate can be converted to lactate to regenerate NAD+57,58. Indeed, we found that addition of pyruvate increased the NAD+/NADH ratio and the proliferation rate of cells exposed to mitochondrial electron transport inhibitors (Fig. 2b–d, Extended Data Fig. 3a–c) as well as cells in hypoxia (Fig. 2a, Extended Data Fig. 2a). Pyruvate addition also increased intracellular citrate levels (Fig. 2e) and the rate of palmitate synthesis (Fig. 2f). Because synthesis of lipids from citrate-derived acetyl-CoA also requires ATP hydrolysis for the ATP-citrate lyase (ACLY) and acetyl-CoA carboxylase (ACC) reactions59, we considered the possibility that pyruvate is fueling ATP generation through the TCA cycle to rescue proliferation39. To test this, we assessed the effect of lactate in the same conditions where pyruvate rescues fatty acid synthesis and cell proliferation. Similar to pyruvate, lactate can be metabolized by cells60,61 to provide carbons for citrate and ATP production, but lactate addition shifts the equilibrium of the lactate dehydrogenase (LDH) reaction toward pyruvate formation and NAD+ consumption10,57,58,62. Interestingly, while lactate increased intracellular levels of pyruvate (Fig. 2g), it did not increase the NAD+/NADH ratio, intracellular levels of citrate, rates of palmitate synthesis, or cell proliferation (Fig. 2a–f, Extended Data Fig. 2a, Extended Data Fig. 3a–c). These results suggest that lipid synthesis is not limited by ATP generation or carbon availability when mitochondrial electron transport is impaired, but is rather limited by the oxidative transformations that are required to produce lipogenic citrate. Notably, neither pyruvate nor lactate had any effect on phenformin-induced ACC phosphorylation (Extended Data Fig. 5a), a marker of increased AMP-activated protein kinase activity that is upregulated in cells experiencing energy stress63, potentially explaining why proliferation is only partially rescued in pyruvate-treated cells. Furthermore, we found that orthogonal methods of increasing the NAD+/NADH ratio, such as supplementation with α-ketobutyrate, an alternative electron acceptor11,20, or expression of the Lactobacillus brevis NADH oxidase enzyme (lbNOX), which regenerates NAD+ by direct transfer of electrons to oxygen16, also rescued proliferation of phenformin-treated cells cultured in the absence of exogenous lipids (Extended Data Fig. 3g,h). The addition of lipids to cells treated with phenformin did not further rescue proliferation rate beyond that observed with pyruvate rescue or α-ketobutyrate alone, consistent with the notion that lipids and pyruvate rescue proliferation through similar mechanisms (Extended Data Fig. 3d–f). Lastly, the supplementation of aspartate, previously shown to rescue some conditions of electron acceptor limitation11,64, was unable to rescue proliferation of cells treated with phenformin and cultured in the absence of exogenous lipids (Extended Data Fig. 4a–c). In agreement with the quantitative predictions of our model (Fig. 1a), these data suggest that in lipid-depleted conditions the oxidative demand of lipid production exceeds that of aspartate production. More generally, these results argue that beyond the availability of molecular oxygen for desaturation reactions25, cells require mitochondrial respiration or alternative pathways for NAD+ regeneration to synthesize fatty acids.
To better understand the specific metabolic pathways and reactions that support de novo fatty acid synthesis, we next performed kinetic isotope tracing experiments to assess the metabolite fates of U-13C-Glucose or U-13C-Glutamine. We found that culturing cells in the absence of exogenous lipids increased citrate synthesis from both glucose and glutamine via oxidative TCA cycling as measured by the rate of 2-carbon-labeled citrate (M+2) formation from U-13C-Glucose, or the rate of 4-carbon-labeled citrate (M+4) formation from U-13C-Glutamine (Fig. 3a–c). These data indicate that cancer cells are utilizing oxidative pathways with high NAD+ requirements for fatty acid synthesis from glucose when electron acceptors are available. In agreement with isotopic labeling experiments, the increased oxidative metabolism in lipid starvation conditions was accompanied by an increase in fatty acid synthase (FASN) expression and a decrease of the inhibitory serine 293 phosphorylation on the E1/A subunit of the PDH complex (Fig. 3d). Further investigation into the kinetics of PDH phosphorylation revealed that three sites of inhibitory phosphorylation – serine 232, serine 293, and serine 300 – were dephosphorylated as rapidly as 2 hours after lipid starvation in HeLa cells (Extended Data Fig. 5b). Notably, we were unable to detect any changes in expression of PDK1 or the PDH Phosphatase 1 (PDP1) even after 24 hours of lipid depletion. Relative to the kinetics of PDH phosphorylation, upregulation of FASN, which is a target of the Sterol Response Element Binding Protein (SREBP), was much slower, with a detectable increase in expression occurring at ~6 hours after lipid starvation (Extended Data Fig. 5b)65. To directly test if the observed changes in PDH phosphorylation can be attributed to known transcriptional responses to lipid starvation, we overexpressed constitutively mature cleaved SREBP1a (mSREBP1a) in HeLa and H1299 cells66. While mSREBP1a was able to induce expression of FASN in both HeLa and H1299 cells, it was unable to elicit any changes in PDH serine 293 phosphorylation or total PDH levels (Extended Data Fig. 5c). These data strongly suggest that a cellular response to lipid starvation is initiated by a fast post-transcriptional rewiring of central carbon metabolism to favor oxidative citrate production, followed by a slower upregulation of enzymes responsible for fatty acid biosynthesis.
Fig. 3 |. Electron acceptor limitation suppresses oxidative and reductive citrate production.
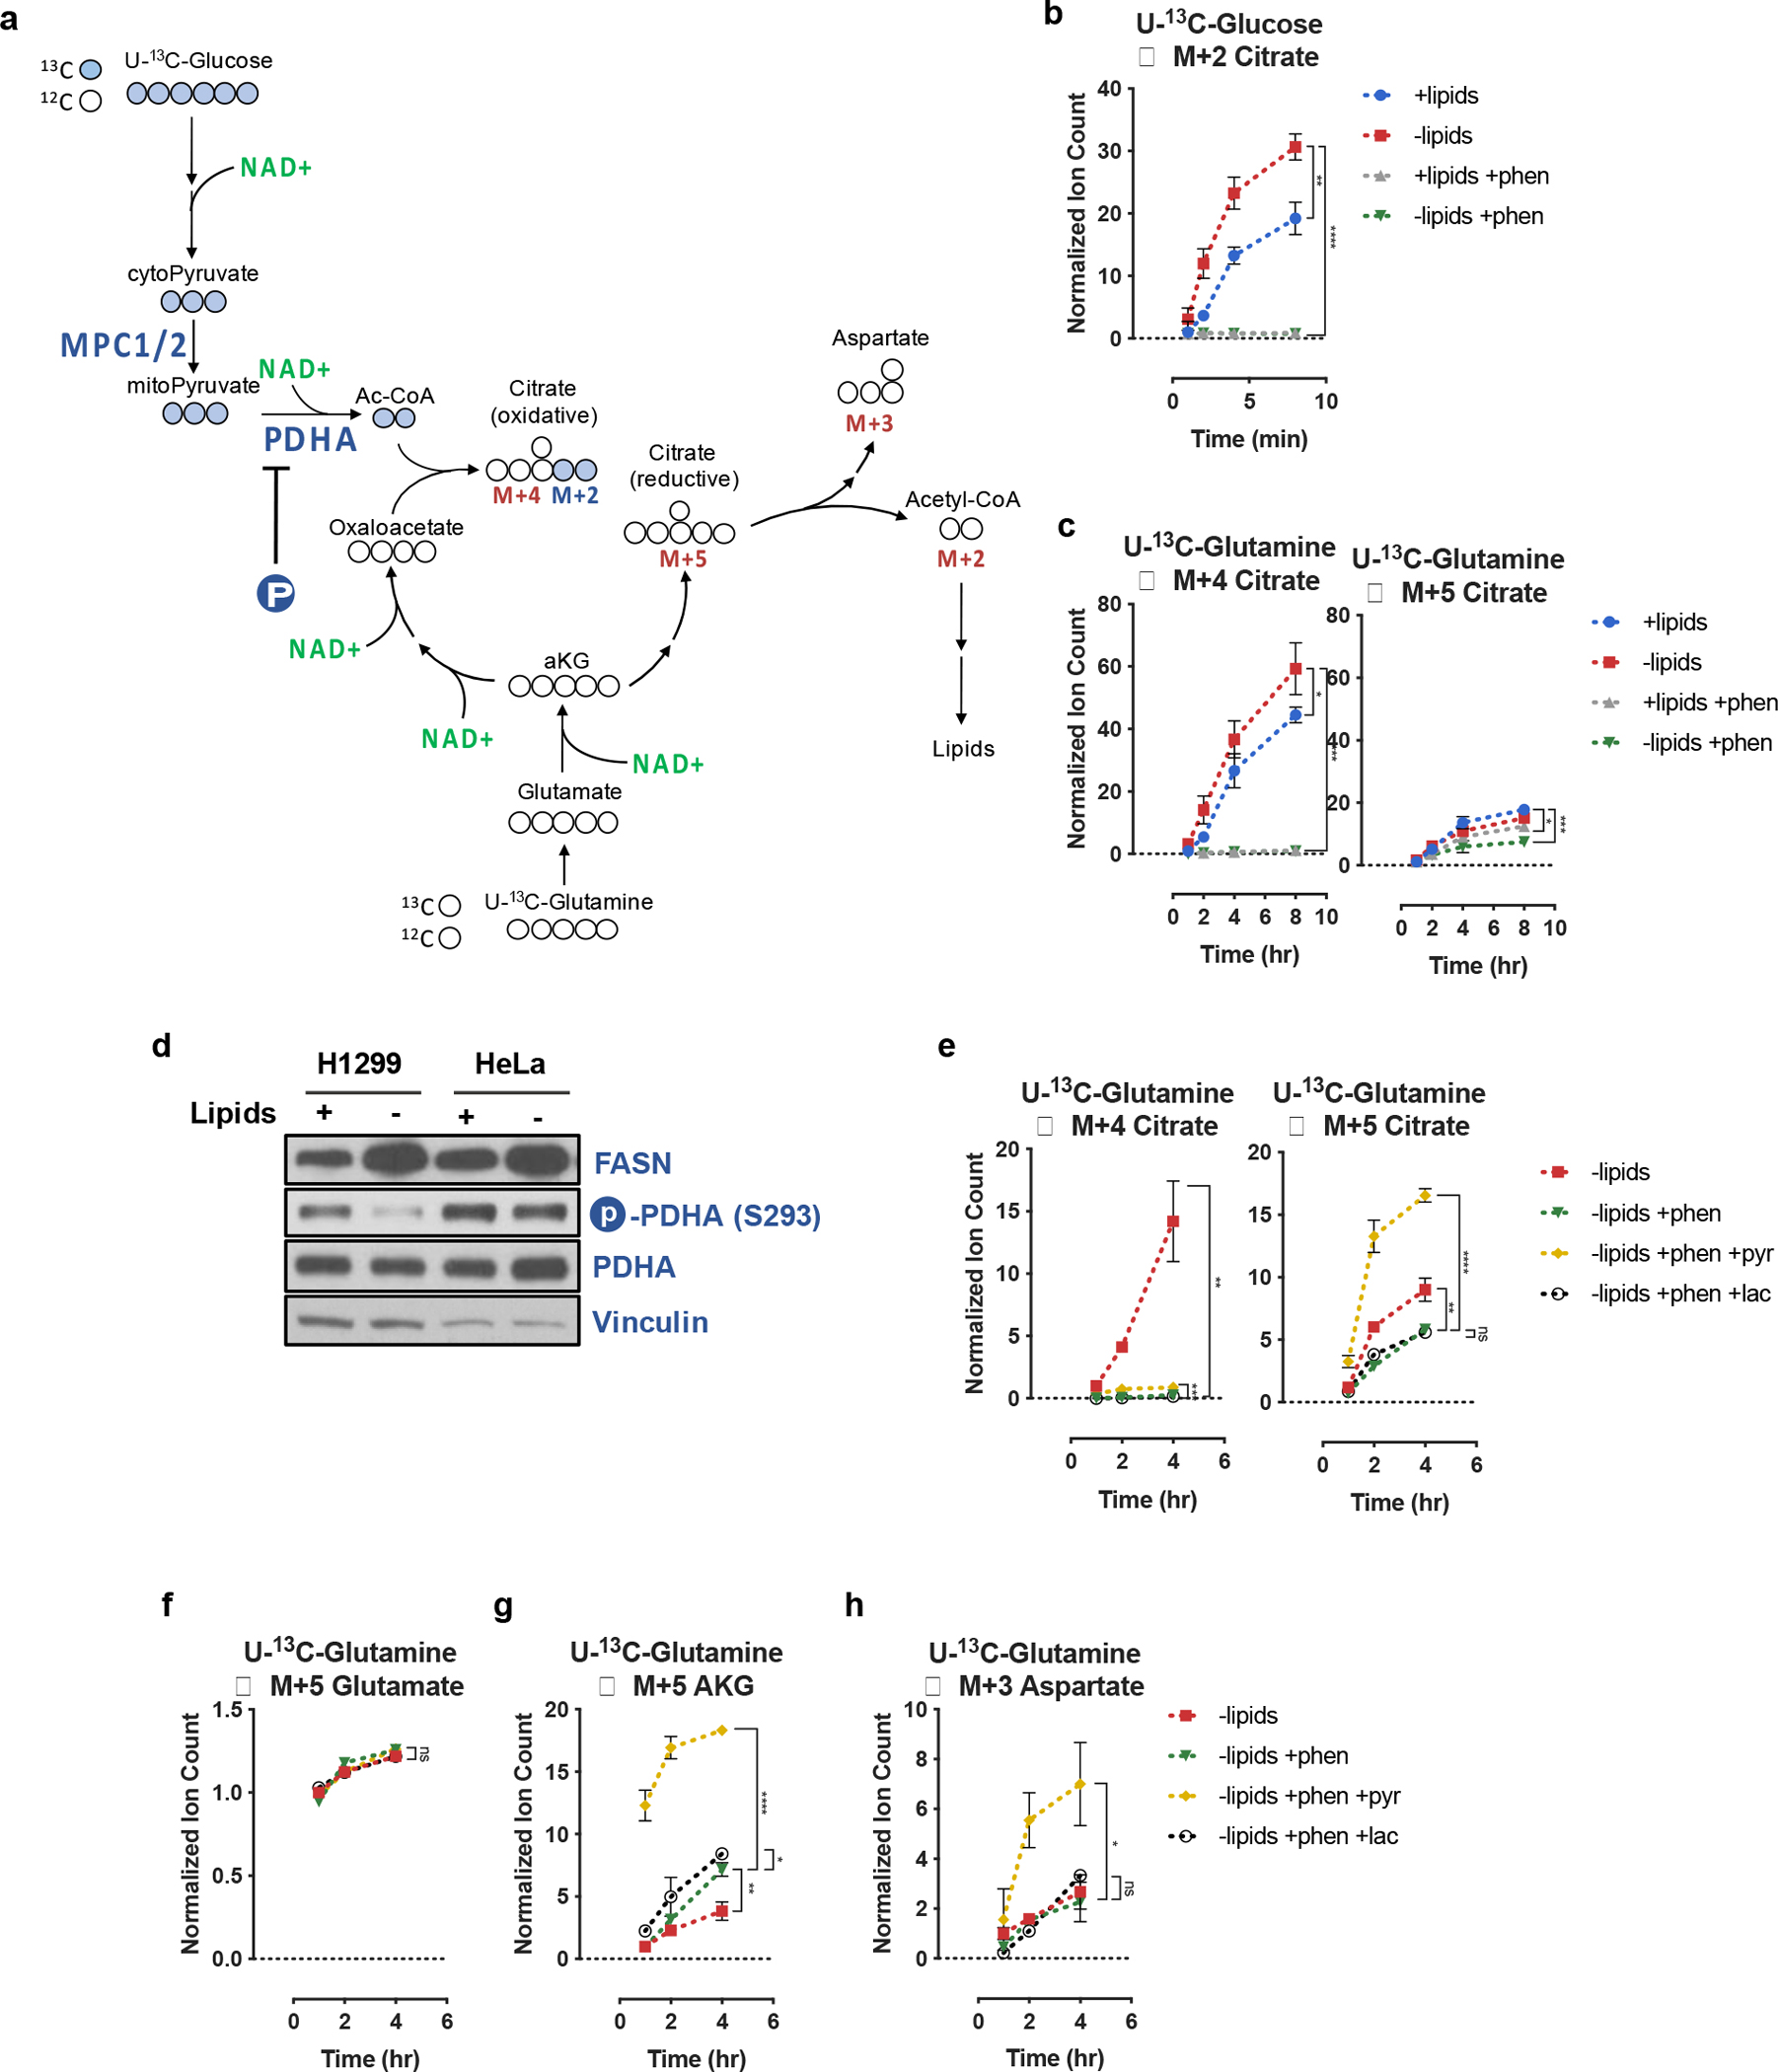
a, Schematic depicting carbon transitions involved in the oxidative and reductive pathways to generate citrate from glucose and glutamine. Oxidation of glucose carbons requires mitochondrial pyruvate entry, mediated through MPC1/2, as well as PDHA activity, which is negatively regulated by PDHA phosphorylation (P). Oxidatively produced citrate will be labeled on two carbons (M+2) from U-13C-Glucose or four carbons (M+4) from U-13C-Glutamine. Reductively produced citrate will be labeled on five carbons (M+5) from U-13C-Glutamine; cleavage of M+5 citrate will yield three carbon labeled oxaloacetate (M+3), which is in equilibrium with M+3 aspartate. b, Assessment of oxidative metabolism via production of M+2 citrate from U-13C-Glucose over time in HeLa cells cultured in media +lipids or −lipids, with and without phenformin (100μM) as indicated. Data were normalized to M+2 citrate in +lipids at t=2min (n=3 per condition from a representative experiment). c, Assessment of oxidative and reductive glutamine metabolism to produce M+4 and M+5 citrate from U-13C-Glutamine over time in HeLa cells cultured media +lipids or −lipids, with and without phenformin (100μM) as indicated. Data were normalized to M+4 citrate in +lipids at t=1hr (n=3 per condition from a representative experiment). d, Immunoblot analysis of FASN expression, PHDA serine 293 phosphorylation, and total PDHA expression. Vinculin was used as a loading control. e, Assessment of M+4 and M+5 citrate production from U-13C-Glutamine over time in HeLa cells cultured in media −lipids, without or with phenformin (100μM), without or with pyruvate (1mM, pyr) or lactate (10mM, lac) as indicated. Data were normalized to M+4 citrate in −lipids at t=1hr (n=3 per condition from a representative experiment). f, Assessment of M+5 glutamate production over time from U-13C-Glutamine in HeLa cells cultured in media −lipids without or with phenformin (100μM), without or with pyruvate (1mM, pyr) or lactate (10mM, lac) as indicated. Data were normalized to M+5 glutamate in −lipids at t=1hr (n=3 per condition from a representative experiment). g, Assessment of M+5 αKG production over time from U-13C-Glutamine in HeLa cells cultured in media −lipids without or with phenformin (100μM), without or with pyruvate (1mM, pyr) or lactate (10mM, lac) as indicated. Data were normalized to M+5 αKG in −lipids at t=1hr (n=3 per condition from a representative experiment). h, Assessment of M+3 aspartate production over time from U-13C-Glutamine in HeLa cells cultured in media −lipids without or with phenformin (100μM), without or with pyruvate (1mM, pyr) or lactate (10mM, lac) as indicated. Data were normalized to (M+3) aspartate in −lipids at t=1hr (n=3 per condition from a representative experiment). All data represent mean ± s.d. *P < 0.05, **P < 0.01, ***P < 0.001, ****P < 0.0001, ns P > 0.05, unpaired Student’s t-test. All experiments were repeated 3 times or more.
Prior work has shown that hypoxia or pharmacological inhibition of mitochondrial electron transport results in a decreased fractional contribution of glucose carbon to lipogenic citrate, and a concomitant increased fractional contribution of glutamine carbon via reductive carboxylation of glutamine-derived αKG31–33. In agreement with these findings, culturing cells with phenformin in the presence or absence of exogenous lipids decreased M+4 citrate labeling and increased M+5 citrate labeling from U-13C-Glutamine (Extended Data Fig. 6a). These changes were also accompanied by an increase in the αKG/citrate ratio (Extended Data Fig. 6b), also consistent with previous observations46,54. The change in αKG/citrate ratio that accompanied the increased relative contribution of glutamine carbon to produce M+5 citrate was largely driven by a decrease in total citrate levels (Extended Data Fig. 6c). Surprisingly, kinetic tracing measurements in cells treated with phenformin revealed that the rates of both oxidative and reductive glutamine flux substantially decreased compared to untreated cells (Fig. 3c). These flux measurements, alongside the decreased citrate levels under conditions of ETC inhibition, suggest that reductive carboxylation cannot fully compensate for a decrease in citrate synthesis from glucose when NAD+ is limited. Thus, these data support the results of the computational analysis that both oxidative and reductive pathways of lipogenic citrate synthesis incur NAD+ consumption costs, and that both routes are compromised when the NAD+/NADH ratio decreases (Fig. 1a).
Using tracing experiments, we next sought to determine how pyruvate is able to increase intracellular citrate levels and support upregulated fatty acid synthesis. To do this, we traced U-13C-Glutamine to assess the rate of oxidative M+4 and reductive M+5 citrate formation (Fig. 3e). We observed that in cells cultured with delipidated media and phenformin, the addition of pyruvate, but not lactate, increased rates of citrate production through both oxidative and reductive routes (Fig. 3e). However, the rate of glutamine reductive carboxylation far exceeded the rate of glucose and glutamine oxidation (Fig. 3e). This elevated rate of reductive carboxylation appears to be facilitated by increased αKG production from glutamate (Fig. 3g) and not by increased glutamate production from glutamine (Fig. 3f). Since the conversion of glutamate to αKG transforms a carbon-nitrogen bond into a carbon-oxygen double bond, these results are consistent with the reaction being overall oxidative, and therefore dependent on the NAD+/NADH ratio, irrespective of whether this conversion proceeds through glutamate dehydrogenase or any transamination reaction11,42. Lastly, we also confirmed that the citrate produced via reductive glutamine flux was further metabolized by ACLY to generate lipogenic acetyl-CoA as the rate of M+3 aspartate production from U-13C-glutamine was specifically elevated in the pyruvate-treated, but not the lactate-treated cells (Fig. 3h).
To further corroborate the finding that pyruvate facilitates citrate production when mitochondrial electron transport is inhibited through its effects on NAD+ regeneration, and not due to pyruvate being a carbon source, we repeated our kinetic U-13C-glutamine tracing experiments with the alternative electron acceptor α-ketobutyrate. Interestingly, both pyruvate and α-ketobutyrate were able to completely ablate PDH (S293) phosphorylation, likely due to the inhibitory effects of α-keto acids on PDK activity (Extended Data Fig. 5d)67. However, despite both metabolites inducing constitutively active PDH, the oxidative route was not the major route of citrate synthesis when mitochondrial electron transport was inhibited. As with pyruvate, α-ketobutyrate facilitated reductive citrate production from glutamine, and this elevation in reductive TCA cycle flux similarly originated from an increased rate of glutamate to αKG conversion (Fig. 4a–d). Thus, when mitochondrial electron transport is impaired, providing electron acceptors rescues lipogenic citrate synthesis through reductive glutamine carboxylation despite constitutively active PDH.
Fig. 4 |. Reductive TCA cycle flux is gated by electron acceptor availability.
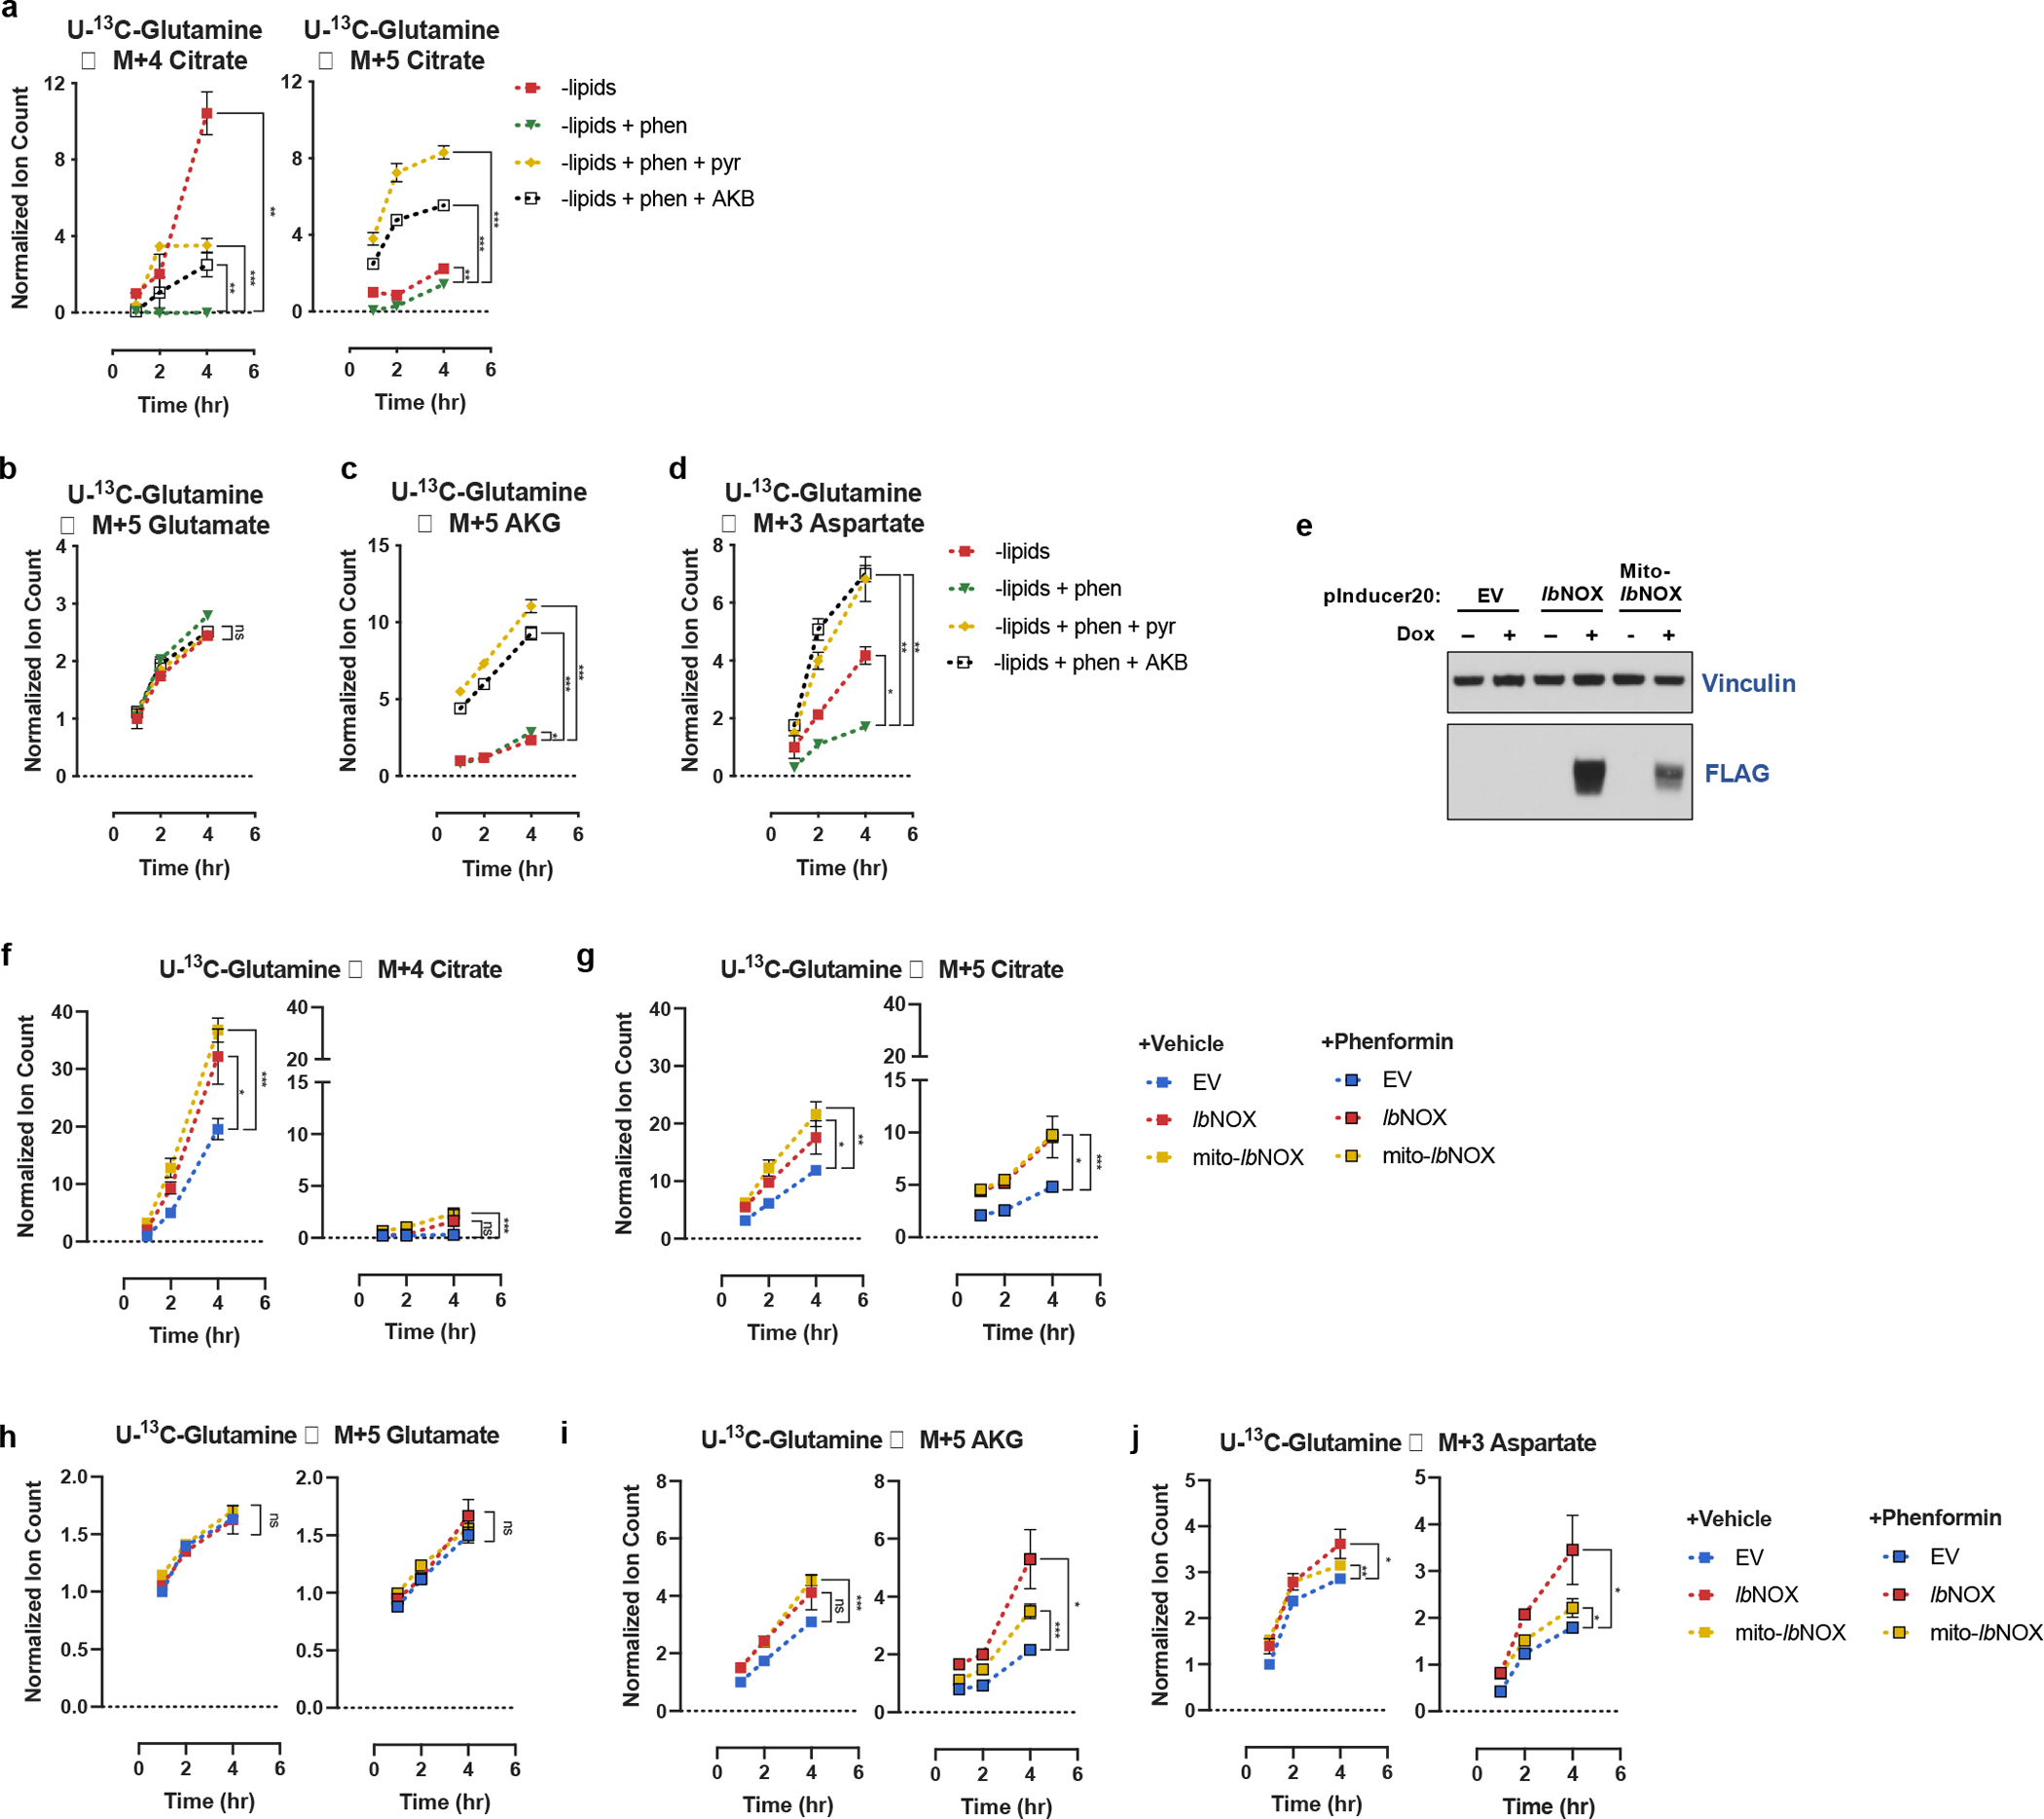
a, Assessment of M+4 and M+5 citrate production from U-13C-Glutamine over time in HeLa cells cultured in media −lipids, without or with phenformin (100μM), without or with pyruvate (1mM, pyr) or alpha-ketobutyrate (1mM, AKB) as indicated. Data were normalized to M+4 citrate in −lipids at t=1hr (n=3 per condition from a representative experiment). b, Assessment of M+5 glutamate production over time from U-13C-Glutamine in HeLa cells cultured in media −lipids without or with phenformin (100μM), without or with pyruvate (1mM, pyr) or alpha-ketobutyrate (1mM, AKB) as indicated. Data were normalized to M+5 glutamate in −lipids at t=1hr (n=3 per condition from a representative experiment). c, Assessment of M+5 αKG production over time from U-13C-Glutamine in HeLa cells cultured in media −lipids without or with phenformin (100μM), without or with pyruvate (1mM, pyr) or alpha-ketobutyrate (1mM, AKB) as indicated. Data were normalized to M+5 αKG in −lipids at t=1hr (n=3 per condition from a representative experiment). d, Assessment of M+3 aspartate production over time from U-13C-Glutamine in HeLa cells cultured in media −lipids without or with phenformin (100μM), without or with pyruvate (1mM, pyr) or alpha-ketobutyrate (1mM, AKB) as indicated. Data were normalized to (M+3) aspartate in −lipids at t=1hr (n=3 per condition from a representative experiment). e, Immunoblot of HeLa cells expressing empty vector (EV), FLAG-tagged Lactobacillus brevis NADH oxidase (lbNOX), or mitochondrial localized FLAG-tagged Lactobacillus brevis NADH oxidase (Mito-lbNOX) under a doxycyline-inducible promoter treated with or without 0.5μg/mL doxycycline (dox). f, Assessment of M+4 citrate production from U-13C-Glutamine over time in HeLa cells expressing EV, lbNOX, or mito-lbNOX cultured in media −lipids, with 0.5μg/mL doxycycline, without or with phenformin (100μM) as indicated. Data were normalized to M+4 citrate in HeLa EV cells at t=1hr (n=3 per condition from a representative experiment). g, Assessment of M+5 citrate production from U-13C-Glutamine over time in HeLa cells expressing EV, lbNOX, or mito-lbNOX cultured in media −lipids, with 0.5μg/mL doxycycline, without or with phenformin (100μM) as indicated. Data were normalized to M+4 citrate in HeLa EV cells at t=1hr (n=3 per condition from a representative experiment). h, Assessment of M+5 glutamate production over time from U-13C-Glutamine in HeLa cells expressing EV, lbNOX, or mito-lbNOX cultured in media −lipids, with 0.5μg/mL doxycycline, without or with phenformin (100μM) as indicated. Data were normalized to M+5 glutamate in HeLa EV cells at t=1hr (n=3 per condition from a representative experiment). i, Assessment of M+5 αKG production over time from U-13C-Glutamine in HeLa cells expressing EV, lbNOX, or mito-lbNOX cultured in media −lipids, with 0.5μg/mL doxycycline, without or with phenformin (100μM) as indicated. Data were normalized to M+5 αKG in HeLa EV cells at t=1hr (n=3 per condition from a representative experiment). j, Assessment of M+3 aspartate production over time from U-13C-Glutamine in HeLa cells expressing EV, lbNOX, or mito-lbNOX cultured in media −lipids, with 0.5μg/mL doxycycline, without or with phenformin (100μM) as indicated. Data were normalized to (M+3) aspartate in HeLa EV cells at t=1hr (n=3 per condition from a representative experiment). All data represent mean ± s.d. *P < 0.05, **P < 0.01, ***P < 0.001, ****P < 0.0001, ns P > 0.05, unpaired Student’s t-test. All experiments were repeated 3 times or more.
Because mitochondrial respiration and LDH regenerate NAD+ in different cellular compartments, we next wondered if the mechanism of stimulating reductive citrate production following electron transport inhibition is dependent on the location of NAD+ regeneration. To address this question, we expressed lbNOX in the cytosol or mitochondria of HeLa cells16 and then performed kinetic U-13C-glutamine tracing in lipid-depleted conditions (Fig. 4e). We observed that both cytosolic and mitochondrial lbNOX increased basal oxidative and reductive citrate production (Fig. 4f–g). In the presence of phenformin, oxidative and reductive citrate production were inhibited, and cells expressing lbNOX and mito-lbNOX produced the majority of citrate via reductive glutamine metabolism. Similar to exogenous electron acceptors, the expression of either lbNOX or mito-lbNOX predominantly increased the conversion of glutamate to αKG (Fig. 4h–j). Taken together, these experiments suggest that both oxidative and reductive carboxylation routes of fatty acids production can be inhibited at oxidative reaction steps when environmental lipids are limiting. However, when cells are given alternative methods of generating electron acceptors in the context of mitochondrial electron transport inhibition, reductive carboxylation is the preferred route of producing lipogenic citrate.
Exogenous acetate can be metabolized by cancer cells in culture and by tumors68,69. Previous studies have shown that acetate can have various context-dependent metabolic fates, from participating in epigenetic modifications to serving as a carbon source for lipid synthesis, with higher usage of acetate for lipid synthesis in hypoxia68,70–72. We rationalized that our findings provide a mechanistic explanation for the ability of acetate to support cell proliferation in electron acceptor-limited conditions73. Specifically, acetate could circumvent the NAD+ consuming reactions that are essential for synthesis of cytosolic acetyl-CoA. Indeed, exogenous acetate rescued proliferation of cells cultured in lipid-depleted conditions in the presence of phenformin or antimycin A (Fig. 5a–b, Extended Data Fig. 7a–b), without altering the intracellular NAD+/NADH ratio (Fig. 5c, Extended Data Fig. 7c). Exogenous acetate also restored proliferation of lipid-deprived cells in hypoxia (Fig. 5g, Extended Data Fig. 7d). Consistent with its role as a direct carbon source for fatty acid synthesis, exogenous acetate increased the palmitate synthesis rate (Fig. 5d) without changing citrate levels (Fig. 5e), TCA cycle fluxes (Fig. 5f), levels of TCA cycle intermediates (Extended Data Fig. 8a–d) or ACC phosphorylation (Extended Data Fig. 5a). These data are consistent with acetate restoring fatty acid synthesis by circumventing the NAD+ requirement for citrate production. Notably, acetate rescues lipid biosynthesis despite being incorporated into lipogenic acetyl-CoA multiple reactions upstream of the lipid desaturation reactions that consume molecular oxygen. This supports the crucial role played by NAD+ consuming reactions in gating lipid synthesis in hypoxia. The conversion of exogenous acetate to lipogenic acetyl-CoA also consumes ATP74, further supporting a model where lipid biosynthesis can be limited by the NAD+/NADH ratio rather than ATP availability in lipid-depleted conditions.
Fig. 5 |. Bypassing oxidative steps in fatty acid synthesis rescues proliferation in electron acceptor deficient cells.
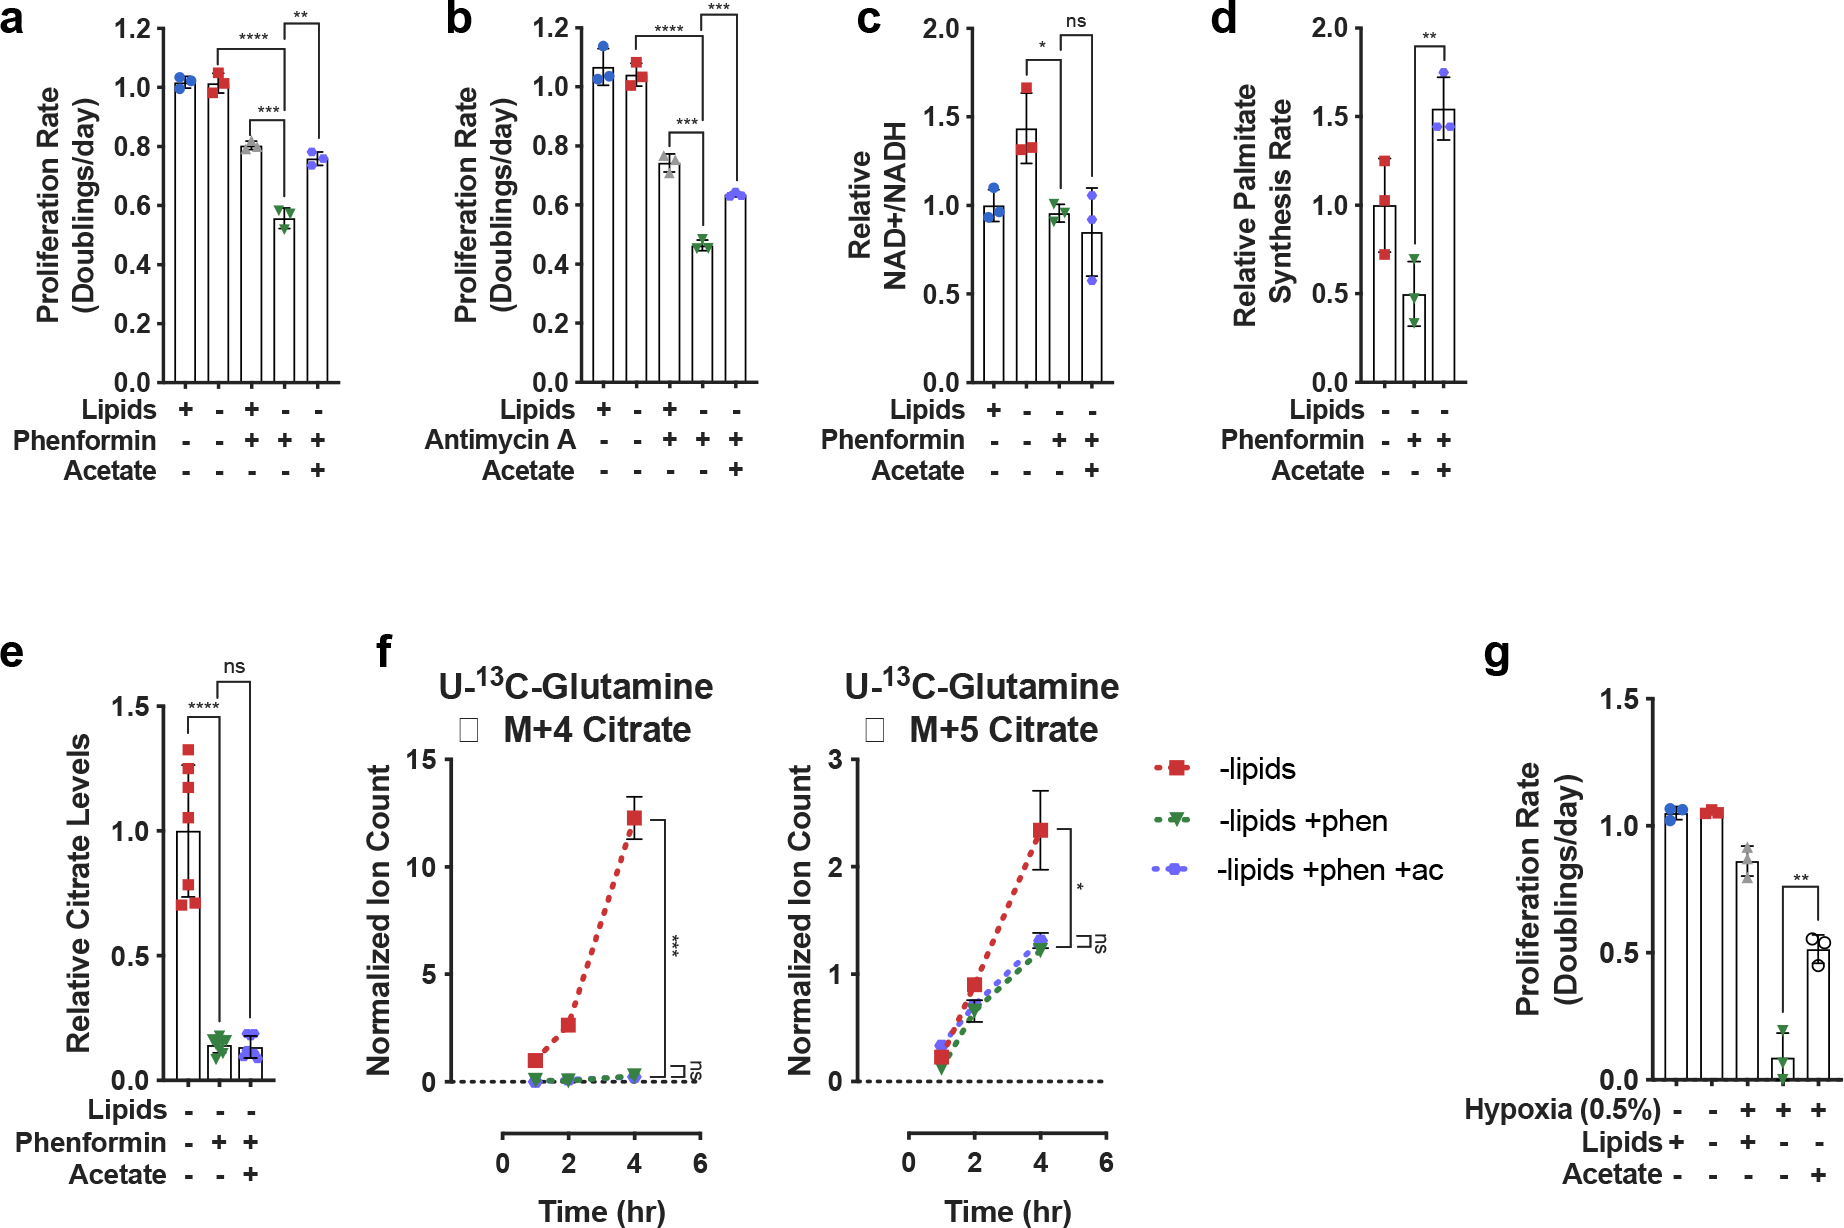
a, Proliferation rates of HeLa cells cultured in media +lipids or −lipids, without or with phenformin (100μM) or acetate (200 μM) as indicated (n=3 per condition from a representative experiment). b, Proliferation rates of HeLa cells cultured in media +lipids or −lipids, without or with antimycin A (200nM) or acetate (200 μM) as indicated (n=3 per condition from a representative experiment). c, Relative NAD+/NADH ratio in HeLa cells cultured in media +lipids or −lipids, without or with phenformin (100μM) or acetate (200 μM) as indicated (n=3 per condition from a representative experiment). d, Relative palmitate synthesis rates of HeLa cells cultured in media −lipids without or with phenformin (100μM) or acetate (200 μM) as indicated (n=3 per condition from a representative experiment). e, Relative intracellular citrate levels in HeLa cells cultured in media −lipids without or with phenformin (100μM) or acetate (200 μM) as indicated (n=3 per condition from a representative experiment). f, Assessment of M+4 and M+5 citrate production from U-13C-Glutamine over time in HeLa cells cultured in media −lipids without or with phenformin (100μM) or acetate (200 μM) as indicated. Data were normalized to M+4 citrate in −lipids at t=1hr (n=3 per condition from a representative experiment). g, Proliferation rates of HeLa cells cultured in media +lipids or −lipids, in normoxia (21% oxygen) or hypoxia (0.5% oxygen), and without or with acetate (200 μM) as indicated. Data from the first four conditions are the same as those presented in Fig. 2a. (n=3 per condition). All data represent mean ± s.d. *P < 0.05, **P < 0.01, ***P < 0.001, ****P < 0.0001, unpaired Student’s t-test. All experiments were repeated 3 times or more.
To explore whether de novo lipid synthesis in tumors may be affected by conditions where electron acceptors are limiting in vivo, we next investigated whether hypoxia was associated with coordinated changes in metabolic gene expression across human tumors. We used RNA-sequencing data from The Cancer Genome Atlas (TCGA) to calculate the correlations between mRNA expression of 87 KEGG-defined metabolic pathways75 and expression signatures of known tumor hypoxia markers55,76. Interestingly, analysis of over 10,000 different primary tumor samples demonstrated that among all metabolic pathways, lipid biosynthesis has one of the strongest negative correlations to the expression signature of tumor hypoxia (Pearson’s R = −0.39, p < 10−16) (Fig. 6a,b). The correlation was also significant when controlling for the potential effects of tumor proliferation rate, using either purine, pyrimidine, or tRNA synthesis as a proxy for proliferation rate (partial Pearson’s correlation R = –0.39, p < 10−16, R = −0.38, p < 10−16, and R = −0.32, p < 10−16, respectively). Out of the 34 investigated tumor types, 29 displayed a significant negative correlation (at 1% False Discovery Rate (FDR)) between hypoxia and fatty acid biosynthesis (Extended Data Fig. 9a,b). We also investigated the regulatory mechanisms that may mediate the transcriptional response of lipid biosynthesis genes to hypoxia across tumor types. While it is unlikely that a universal regulatory mechanism mediates this response in all tumors, we found that SREBP1/2 – canonical regulators of lipid biosynthesis – are strongly correlated with the expression of fatty acid biosynthesis genes across the entire expression range of hypoxia markers (Extended Data Fig. 10a)77. We also found that SREBP2 expression is significantly anti-correlated with hypoxia markers (Pearson r= −0.22, p<1e-16). These results suggest that SREBPs are likely to be involved in regulating lipid synthesis both in normoxia and hypoxia, but further investigation into the various mechanisms of lipid sensing in hypoxia and expression response in specific tumor types is warranted.
Fig. 6 |. Correlations between mRNA expression of fatty acid synthesis or lipid uptake genes and gene expression markers of tumor hypoxia.
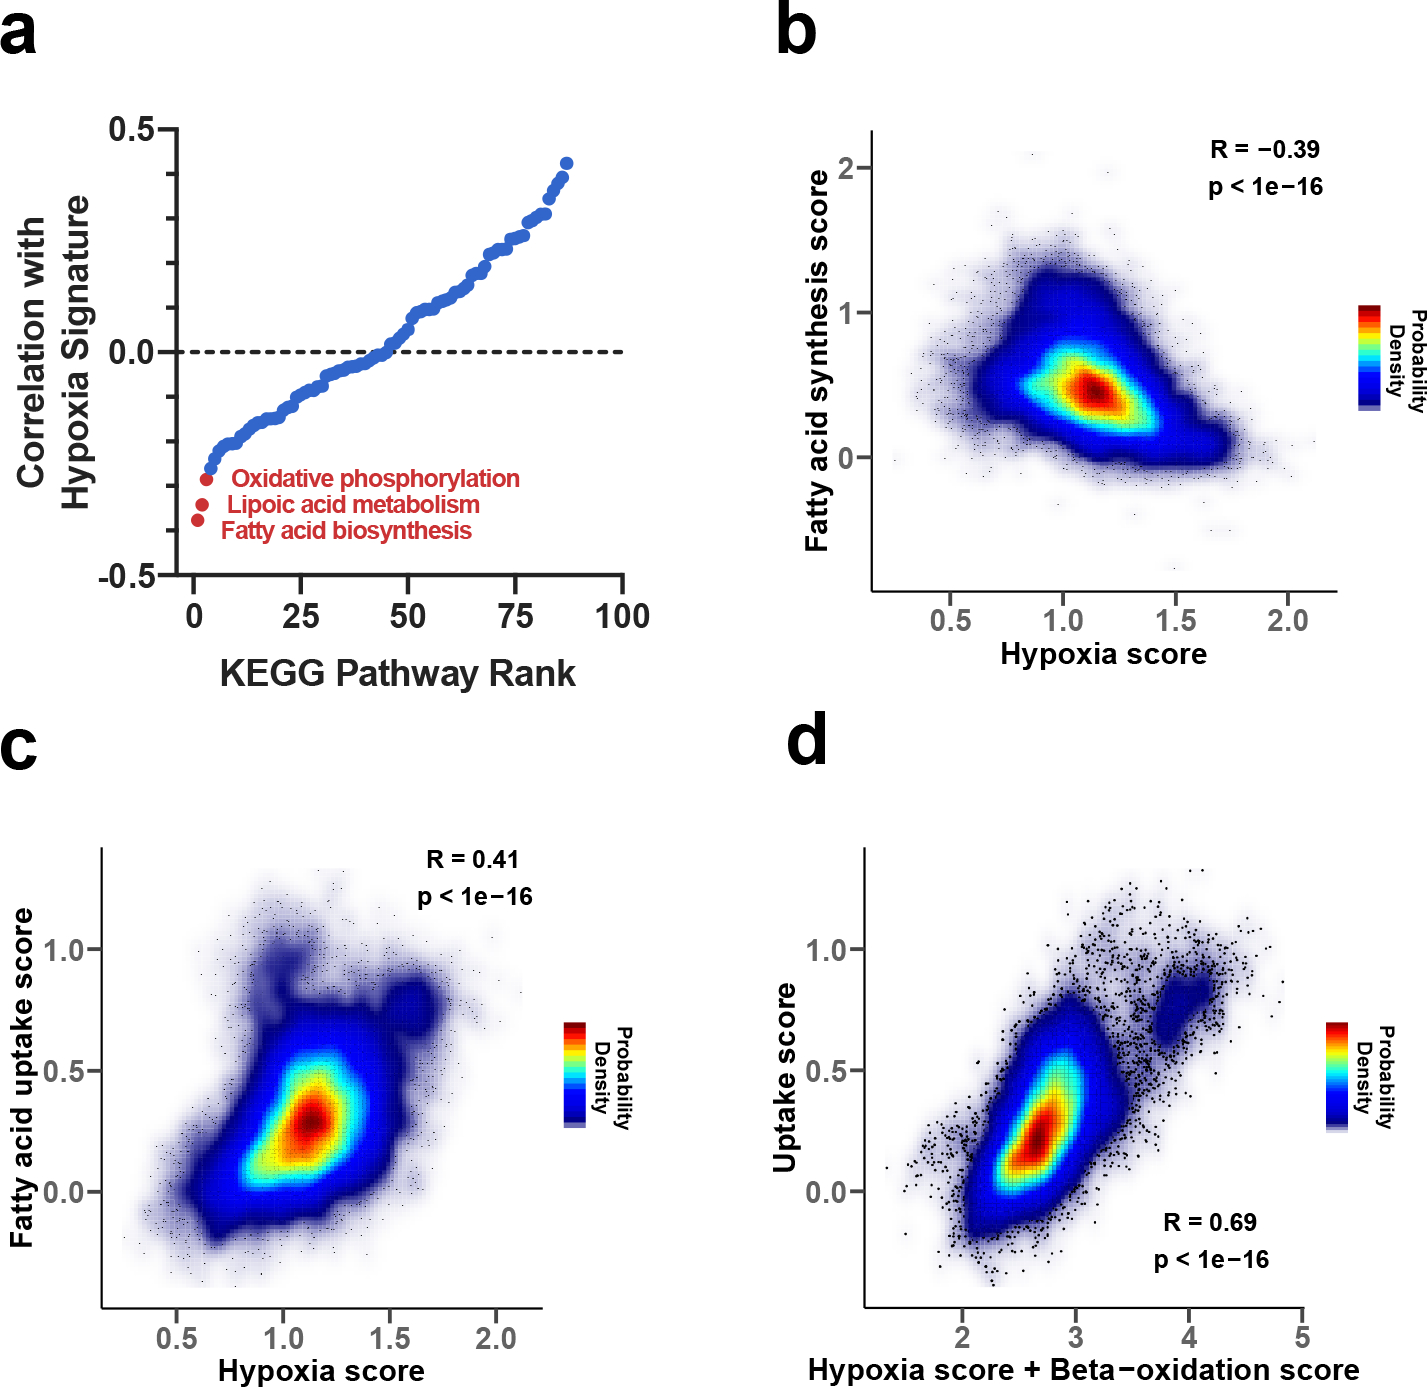
a, Ranking of 87 KEGG metabolic pathways based on the correlation between expression of their genes with expression of known markers of tumor hypoxia (tumor hypoxia scores); the correlations were calculated using TCGA expression data, such that stronger negative correlations correspond to stronger anti-correlations with hypoxia markers. b, Density plot of the correlation between the tumor hypoxia score and expression of genes involved in fatty acid synthesis. c, Density plot of the correlation between the tumor hypoxia score and expression of genes participating in fatty acid uptake. d, Density plot of the correlation between the mRNA expression of gene markers of lipid uptake and the sum of mRNA expression of gene markers of hypoxia and beta-oxidation scores.
We also observed that across all tumor samples, the hypoxia expression signature positively correlated with the expression of genes involved in fatty acid uptake (Pearson’s R = 0.41, p < 10−16) (Fig. 6c), and this finding was also significant in 28 out of the 34 tumor types analyzed individually (at 1% FDR, Extended Data Fig. 9a,c). Of note, while hypoxia markers strongly correlated with lipid uptake genes and anticorrelated with lipid biosynthesis genes (Fig. 6), the correlation between hypoxia markers and Stearoyl-CoA desaturase 1 (SCD1), a gene involved in lipid desaturation, was relatively weak (Extended Data Fig. 10b) both across all tumors (Pearson’s r=0.03, p=0.002), and for individual tumor types (out of 34 TCGA tumor types, 24 did not exhibit a significant correlation). These results are consistent with our biochemical analysis indicating that lipid desaturation is unlikely to be the primary or the only bottleneck for lipid synthesis in hypoxia. Taken together, this analysis suggests that multiple tumor types adapt to hypoxia by downregulating fatty acid synthesis gene expression and instead upregulating genes involved in lipid acquisition from the environment. This conclusion is consistent with previous work showing that hypoxia can alter lipid metabolism in vitro and in vivo25,26,71, and in agreement with our biochemical analysis demonstrating that lipid synthesis in cancer cells is strongly inhibited in hypoxia.
We further investigated the cellular processes that may explain the considerable variability of lipid uptake across tumors. We rationalized that in addition to growth-related uptake mediated by inhibition of de novo lipid synthesis in hypoxia, a substantial amount of lipid uptake variability may be also mediated by beta-oxidation, a process important for energy generation in some cancers with low or even intermediate hypoxia78. Interestingly, we indeed found that a simple linear combination of the expression of beta-oxidation gene markers and hypoxia gene markers can explain about half of the variance in the expression of lipid uptake markers across all tumors (Fig. 6d, Pearson r=0.69, ). This result suggests that the variability of hypoxia-driven lipid uptake and the utilization of lipids for beta-oxidation are the two major cellular processes explaining the diversity of lipid uptake across tumors.
Discussion
Cancer cells adapt metabolism to support proliferation in diverse tissue and environmental contexts5,6,9,79–81. Environmental metabolic constraints on cancer cell proliferation include the availability of nutrients, such as exogenous amino acids and lipids, as well as access to oxygen. An important metabolic role of environmental oxygen is to serve as a terminal electron acceptor for the regeneration of NAD+ via mitochondrial respiration to support oxidation reactions in cells. Some tumors, in contrast to many normal tissues, synthesize a substantial fraction of their lipids de novo78, and lipid synthesis can be essential for tumor growth in tissues where access to environmental lipids is limited82,83. Our computational and experimental analyses demonstrate that de novo lipid synthesis incurs a substantial NAD+ consumption cost, which may dominate the production costs of other biomass components. Notably, despite being canonically considered to be a reductive process our results demonstrate that up to 30% of the total oxygen uptake in cells growing without access to environmental lipids is likely due to de novo lipid biosynthesis. This can make lipid synthesis, specifically lipogenic citrate production, limiting for proliferation in hypoxia or other conditions where NAD+ regeneration is impaired. This limitation may substantially contribute to the acetate and lipid dependence of hypoxic tumors25,26,71.
Past work has shown that cancer cells can rewire metabolism to rely on reductive glutamine metabolism for lipid synthesis when mitochondrial respiration is impaired31–33. Because the usage of glutamine carbon to synthesize fatty acids is chemically net reductive, it might be expected that this pathway is favored in hypoxia or in the presence of mitochondrial electron transport inhibitors that compromise respiration and NAD+ regeneration. However, surprisingly, we find that this net reductive pathway is also impaired in the absence of exogenous electron acceptors. Notably, this impairment cannot be explained by known metabolic regulatory mechanisms, such as phosphorylation-mediated inhibition of PDH activity, or the requirement for molecular oxygen in lipid desaturation reactions. Rather, our data suggest that reductive carboxylation is gated by NAD+ availability for the conversion of glutamate to αKG, potentially explaining why this net reductive pathway cannot fully compensate for oxidative lipid synthesis from glucose when electron acceptors are limited. More generally, our work demonstrates that the availability of oxidizing or reducing equivalents required for specific reactions may gate biochemical pathways even when the overall pathway is net reductive or net oxidative.
Beyond de novo lipid synthesis, requirements for NAD+ regeneration to produce other biomass components has been shown in several contexts. A hypoxia-induced auxotrophy for aspartate has been reported in some tumors12,14, and select cancers are also sensitive to both serine and nucleotide levels81,84,85. Our model predicts that in addition to lipids, there can also be a considerable oxidative cost of arginine, glycine, and alanine production, consistent with evidence supporting sensitivity of select cancers to some of these nutrients in vivo86–88. A limitation for NAD+ regeneration in many tumors, required to synthesize diverse biomass components, may explain why various tumors become dependent on specific synthesis pathways or uptake of nutrients available in their environment.
Materials and Methods
Cell Culture Experiments
Cell lines were maintained in RPMI (Fisher Scientific, MT10040CV) supplemented with 10% fetal bovine serum. For all experiments, cells were washed three times in phosphate buffered saline (PBS), and then cultured in 4mL of RPMI with 10% dialyzed fetal bovine serum, and supplemented with lactate, pyruvate, acetate as indicated. The reagents used for the cell culture experiments are as follows: sodium pyruvate (Sigma, P2256), sodium L-lactate (Sigma, L7022), sodium acetate (Sigma, S2889), Lipid Mixture 1, Chemically Defined (Sigma, L0288), rotenone (Sigma, R8875), phenformin hydrochloride (Sigma, P7045 FLUKA), antimycin A from streptomyces sp. (A8676), GSK2194069 (Tocris, 5303), U-13C-Glucose (Cambridge Isotope Laboratories, CLM-1396), U-13C-Glutamine (Cambridge Isotope Laboratories, CLM-1822), U-13C-Pyruvate (Cambridge Isotope Laboratories, CLM-2440), U-13C-Lactate (Cambridge Isotope Laboratories, CLM-1579), 99% enriched deuterium oxide (Sigma, 151882). All cells were cultured at 37°C with 5% CO2. When indicated, +lipid culture conditions refer to RPMI supplemented with 10% delipidated serum and 1% Lipid Mixture 1.
Oxygen Consumption
An Agilent Seahorse Bioscience Extracellular Flux Analyzer (XF24) was used to measure oxygen consumption rates (OCR). Cells were plated at 50,000 cells per well in Seahorse Bioscience 24-well plates in 50 μL of RPMI supplemented with 10% dialyzed fetal bovine serum. An additional 500 μL of media was added following a 1 hour incubation. The following day, cells were washed three times with PBS and incubated in RPMI with the indicated treatment, OCR measurements were made after 5hrs of incubation. After OCR data acquisition, each well of the plate was collected for cell number analysis. Basal OCR was calculated by subtracting residual OCR following the addition of rotenone and antimycin A from the initial OCR measurements.
Proliferation Rates
Cells were plated in replicate six-well plates in 2mL at an initial seeding density of 20,000 cells. Cells were permitted to settle overnight and a six-well dish was counted to calculate the starting cell number at the initiation of the experiment. For all remaining plates, cells were washed three times with PBS and 4 mL of treatment media was added to each well. Three days after the initial treatment, cells were quantified using a sulforhdamine B (SRB) colorimetric assay. All SRB measurements are normalized to a blank. Proliferation rates were calculated using the equation described below:
GCMS Metabolite Measurements
Gas-chromatography coupled to mass spectrometry (GCMS) analysis was done as described previously1. For polar metabolites, dried samples were derivatized with 20μL of methoxamine (MOX) reagent (ThermoFisher TS-45950) and 25μL of N-tert-butyldimethylsilyl-N-methyltrifluoroacetamide with 1% tert-butyldimethylchlorosilane (Sigma 375934). Following derivatization, samples were analyzed using a DB-35MS column ((30m × 0.25mm i.d. × 0.25 μm, Agilent J&W Scientific) in an Agilent 7890 gas chromatograph (GC) coupled to an Agilent 5975C mass spectrometer (MS). For fatty acids, dried samples were first resuspended in 100μL toluene (Sigma, 650579) and 200uL of 2% sulfuric acid in methanol was added. Samples were incubated overnight at 50°C. The next day, 500uL 5% NaCl and 500uL hexane (Sigma, 34859) were added to the sample. The top fraction was collected, followed by a second hexane extraction with 500uL. The hexane fractions were pooled and dried down under nitrogen gas. The dried samples were resuspended in 50uL hexane and transferred into glass inserts for GCMS analysis. FAME samples were analyzed using a DB-FastFAME GC Column, 30 m x 0.25 mm x 0.25 μm, 7 in. configuration, Agilent J&W Scientific) in an Agilent 7890 gas chromatograph coupled to an Agilent 5975C mass spectrometer. The chromatograph method for fatty acid analysis was as follows: hold at 100 °C for 5 minutes, followed by a ramp of 8°C/min to 180 °C, then followed by a ramp of 1 °C/min to 230 °C. Data were analyzed and corrected for natural isotope abundance using in-house algorithms.
Dynamic U-13C-Glutamine tracing experiments
Cells were plated in six-well plates in at a seeding density of 150,000 cells per well. Cells were permitted to settle overnight. The following day, cells were washed three times with PBS and cultured in the indicated treatment conditions for 24 hours until metabolic steady-state is reached. For cells expressing pInducer20-EV, pInducer20-lbNOX, and pInducer20-mito-lbNOX, 500ng/mL of doxycycline was added to the media. Prior to the initiation of the dynamic isotope tracing, cells were washed once with PBS, and then cultured in 2mL media containing the 2mM U-13C-Glutamine and the indicated treatment condition. For cells expressing pInducer20-EV, pInducer20-lbNOX, and pInducer20-mito-lbNOX, 500ng/mL of doxycycline was also added to all treatment and tracer media. Following the appropriate incubation, wells were washed as quickly as possible with ice-cold blood bank saline and lysed on the dish with 400μL of ice-cold 80% HPLC grade methanol (Sigma, 646377) in HPLC grade water (Sigma, 270733) with 1μg/400μL norvaline (Sigma, N7627) to use as an internal extraction standard.
Dynamic U-13C-Glucose tracing experiments
Cells were plated in six-well plates in at a seeding density of 200,000 cells per well. Cells were permitted to settle overnight. The following day, cells were washed three times with PBS and cultured in the indicated treatment conditions for 24 hours until metabolic steady-state is reached. Prior to the initiation of the dynamic isotope tracing, cells were washed once with PBS, and then cultured in 1.5mL media containing 5mM unlabeled glucose and the indicated treatment condition for 5 hours. Then, 30μL of 1M U-13C-Glucose was added to each well to reach a final glucose enrichment of 80% and incubated for the indicated times. Following the appropriate incubation, cells were washed as quickly as possible with ice-cold blood bank saline and lysed on the dish with 400μL of ice-cold 80% HPLC grade methanol (Sigma, 646377) in HPLC grade water (Sigma, 270733) with 1μg/400μL norvaline (Sigma, N7627) to use as an internal extraction standard.
Palmitate Synthesis Rate
Cells were plated in six-well plates at a seeding density of 150,000 cells per well. Cells were permitted to settle overnight. Prior to the initiation of the experiment, cells were washed three times with PBS, and then cultured for 24 hours in the indicated treatment condition. After 24 hours, media with the indicated treatment condition and reconstituted with 99% deuterium oxide was added to each well to achieve a final deuterium oxide enrichment of 45%. After 2 hours of culture in tracer medium, wells were washed three times as quickly as possible with ice-cold blood bank saline and lysed on the dish with 700μL of (4:3) methanol:0.88% KCl in water with 0.25μg/mL tridecanoic acid (Sigma, T0502) to use as an internal extraction standard. Samples were scraped, collected into glass vials (Thermo Fisher Scientific, C4010–1), and 800uL HPLC-grade dichloromethane (Thermo Fisher Scientific, 402152) was added. Samples were vortexed for 10 minutes at 4°C and centrifuged at 5,000 × g for 10 minutes at 4°C. The bottom fraction was collected into glass vials and dried down under nitrogen gas for subsequent fatty acid methyl ester (FAME) analysis by GCMS. Palmitate synthesis rates were calculated by integrating the sum of all labeled species and normalized to cell number and time of label treatment.
NADP+/NADPH Measurements
Cells were seeded at 200,000 cells per well in six-well plates and permitted to adhere overnight. Next, cells were washed three times in PBS and incubated in 6 mL of the indicated treatment media and/or hypoxia for 24 hours. NADP+ and NADPH levels were measured using a colorimetric kit according to manufacturer’s instructions (Sigma, MAK038).
NAD+/NADH Measurements
Cells were seeded at 20,000 cells per well in six-well plates and permitted to adhere overnight. Next, cells were washed three times in PBS and incubated in 4 mL of the indicated treatment media for 5 hours. Cells were then rapidly washed three times in 4°C PBS and extracted in 100μL of ice-cold lysis buffer (1% dodecyltrimethylammonium bromide [DTAB] in 0.2 N of NaOH diluted 1:1 with PBS), snap-frozen in liquid nitrogen and frozen at −80°C. The NAD+/NADH ratio was measured using a protocol adapted from the manual of the NAD/NADH-Glo Assay kit (Promega G9072)2. To measure NAD+, 20μL of lysate was transferred to PCR tubes and diluted with 20μL of lysis buffer and 20μL 0.4 N HCl, and subsequently incubated at 60°C for 15 minutes. For NADH measurement, 20μL of freshly thawed lysate was transferred to PCR tubes and incubated at 75°C for 30 minutes. The acidic conditions permit for selective degradation of NADH, while the basic conditions degrade NAD+. Following the incubation, samples were spun on a bench-top centrifuge and quenched with 20μL neutralizing solution. The neutralizing solution consisted of 0.5 M Tris base for NAD+ samples and 0.25 M Tris in 0.2 N HCl for the NADH samples. The instructions in the Promega G9072 technical manual were then followed to measure NAD+ and NADH levels using a luminometer (Tecan Infinite M200Pro).
Immunoblotting
Cells washed with ice-cold PBS, and scraped into cold RIPA buffer containing cOmplete Mini protease inhibitor (Roche 11836170001) and PhosStop Phosphatase Inhibitor Cocktail Tablets (Roche 04906845001). Protein concentration was calculated using the BCA Protein Assay (Pierce 23225) with BSA as a standard. Lysates were resolved by SDS-PAGE and proteins were transferred onto nitrocellulose membranes using the iBlot2 Dry Blotting System (Thermo Fisher, IB21001, IB23001). Protein was detected with the primary antibodies anti-Pyruvate Dehydrogenase E1-alpha subunit (phospho S232) (EMD Millipore, AP1063), anti-Pyruvate Dehydrogenase E1-alpha subunit (phospho S293) (Abcam, ab92696), anti-Pyruvate Dehydrogenase E1-alpha subunit (phospho S300) (EMD Millipore, AP1064), anti-Pyruvate Dehydrogenase E1-alpha subunit (total) (Proteintech, 18068-1-AP), anti-PDHK1 (Cell Signaling Technologies, C47H1), anti-PDP1 (Cell Signaling Technologies, D8Y6L), anti-FASN (Cell Signaling Technologies, 3180S), anti-ACC1 (Cell Signaling Technologies, 4190S), anti-ACC1 (phospho S79) (Cell Signaling Technologies, 3661S), and anti-Vinculin (Sigma, V9131). The secondary antibody used was anti-rabbit IgG HRP-linked antibody (Cell Signaling Technologies, 7074S).
Extended Data
Extended Data Fig. 1 |. Effects of lipid depletion and fatty acid synthesis inhibition on cell proliferation.
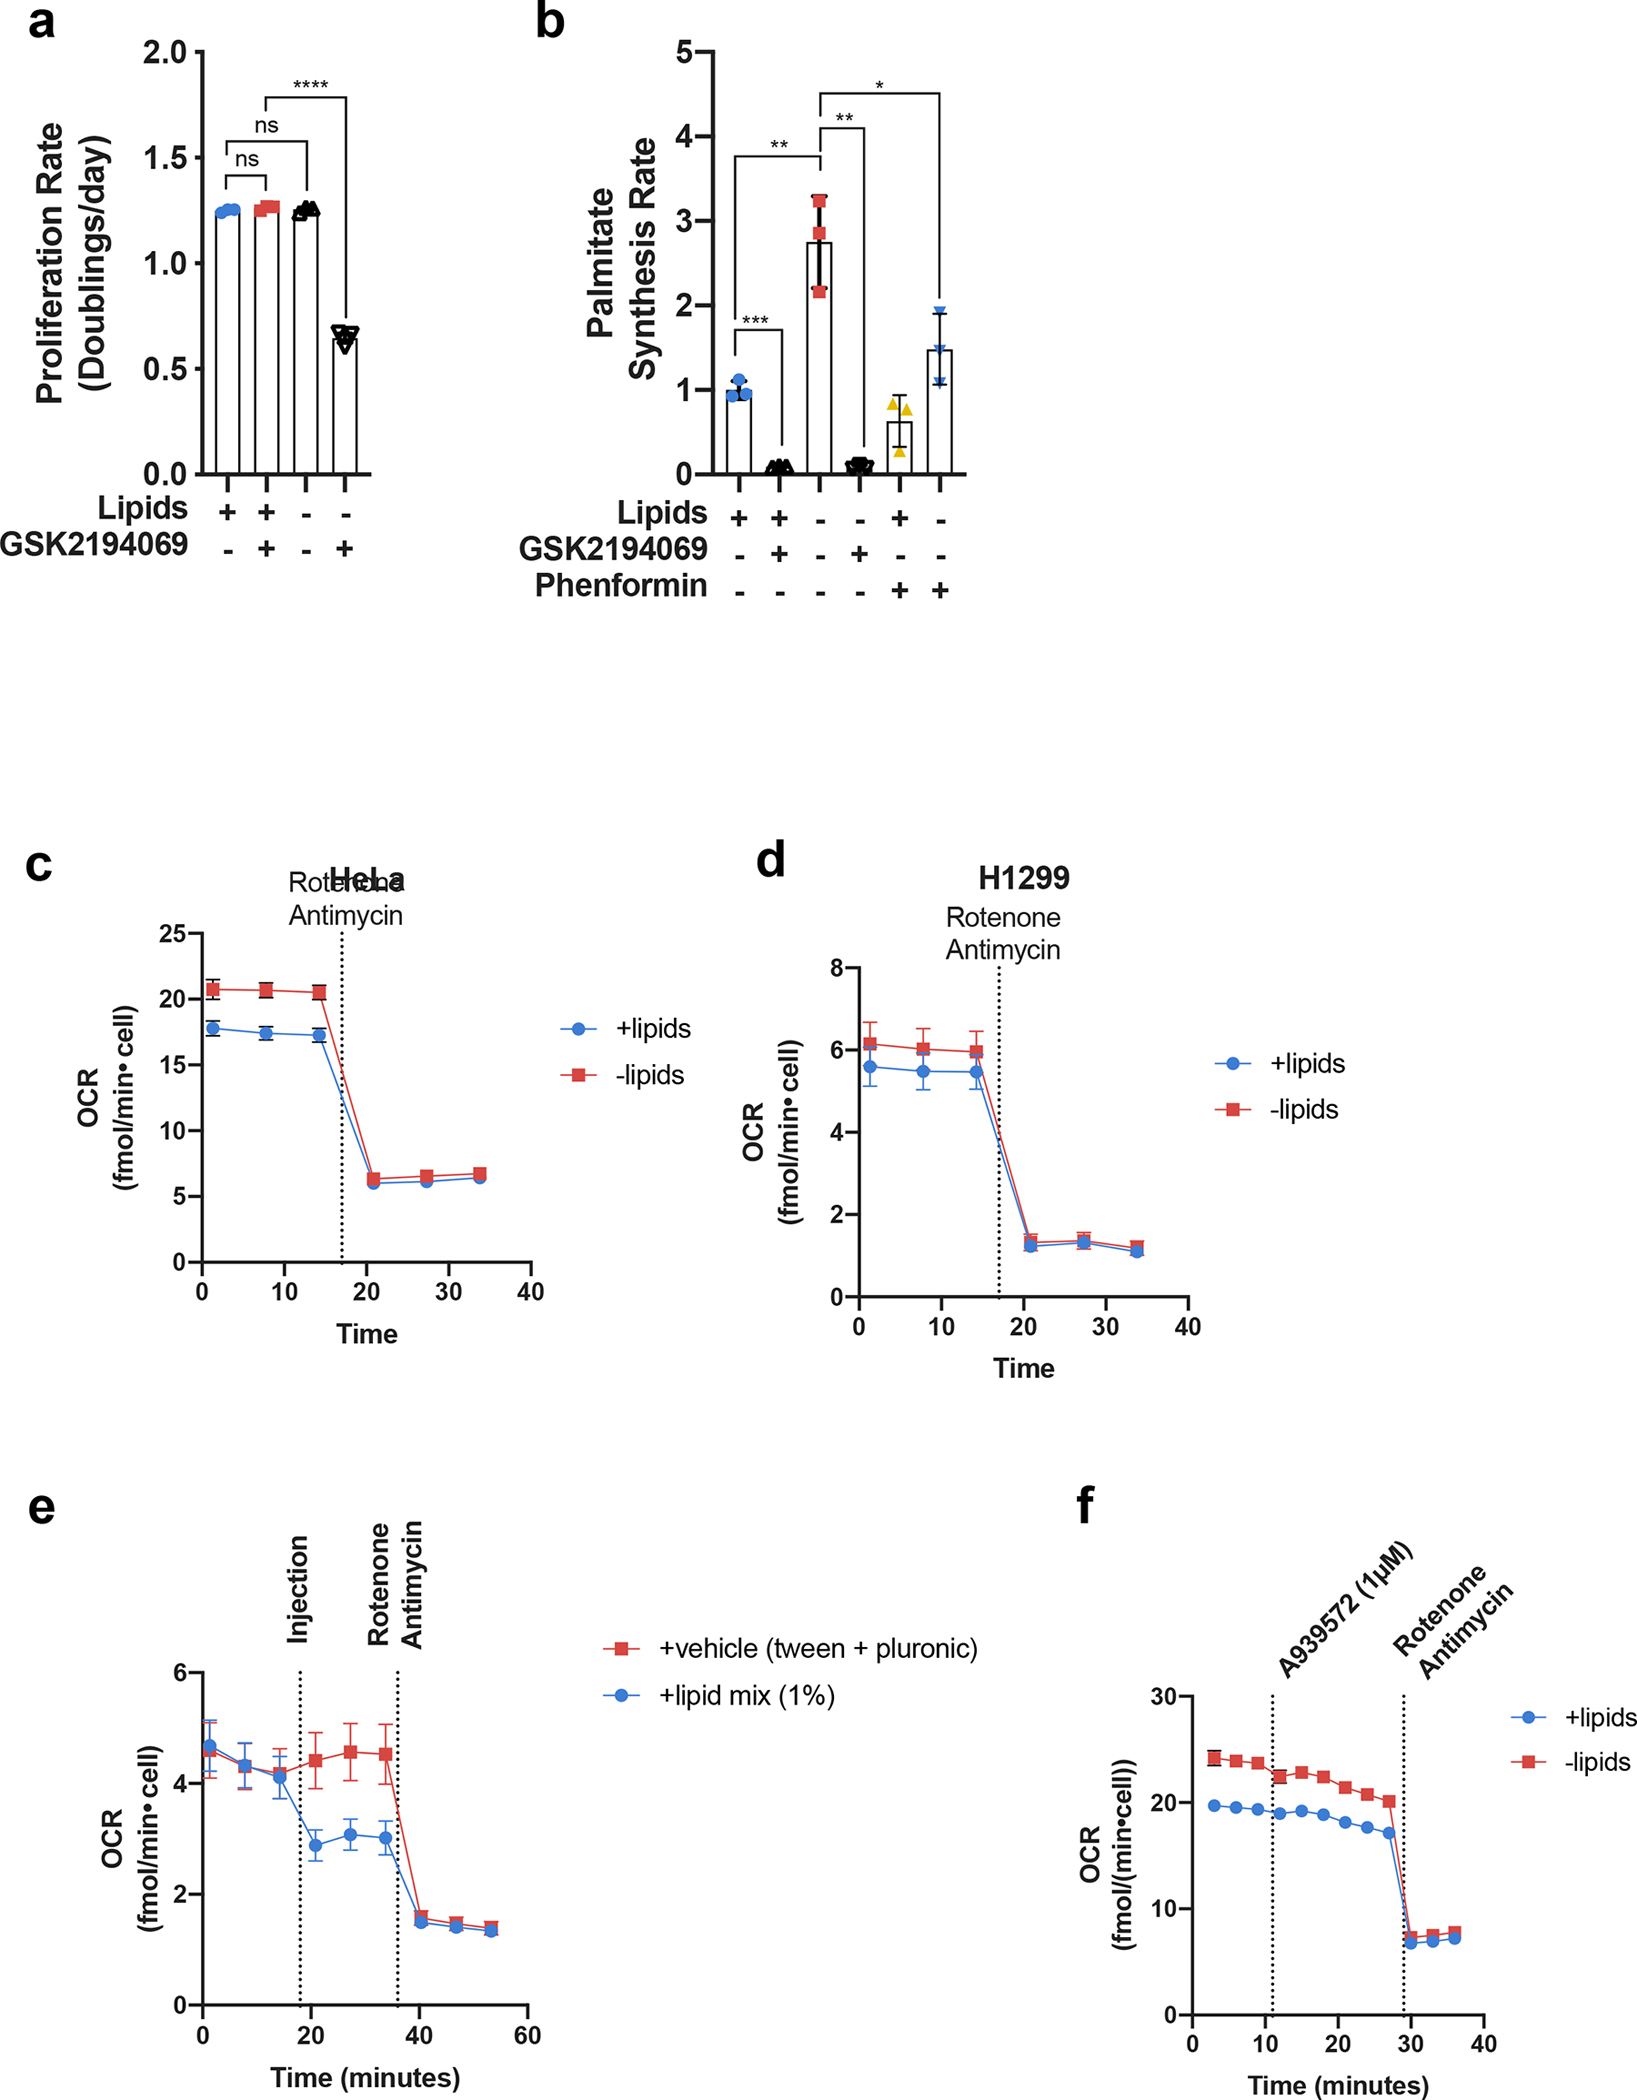
a, Cell culture media was prepared with delipidated serum, and then reconstituted with 1% Lipid Mixture (2 μg/ml arachidonic and 10 μg/ml each linoleic, linolenic, myristic, oleic, palmitic and stearic acid, and 0.22 mg/ml cholesterol) (+lipids) or vehicle (−lipids). Proliferation rates of HeLa cells cultured in media +lipids or −lipids without and with the FASN inhibitor GSK2194069 (0.3 μM) as indicated (n=3 per condition from a representative experiment). b, Relative palmitate synthesis rates of HeLa cells cultured in media +lipids or −lipids without and with GSK2194069 (0.3 μM), or with and without phenformin (100 μM) as indicated (n=3 per condition from a representative experiment). c, Oxygen consumption rate (OCR) of HeLa cells cultured in media +lipids or −lipids as indicated (n=10 per condition from a representative experiment). d, OCR of H1299 cells cultured in media +lipids or −lipids as indicated (n=10 per condition from a representative experiment). e, OCR of H1299 cells cultured in –lipid and acutely treated with 1% Lipid Mixture or Tween-80 and Pluronic F-68 equivalent to what is present in 1% Lipid Mixture. f, OCR of HeLa cells cultures in media +lipids or −lipids acutely treated with the SCD1 inhibitor A939572 (1μM) and rotenone (1.5μM) + antimycin A (1.5μM) as indicated (n=8 per condition from a representative experiment). All data represent mean ± s.d. *P < 0.05, **P < 0.01, ***P < 0.001, ****P < 0.0001, ns P > 0.05, unpaired Student’s t-test. All experiments were repeated 3 times or more.
Extended Data Fig. 2 |. Electron acceptor availability dictates proliferation rate in the absence of exogenous lipids.
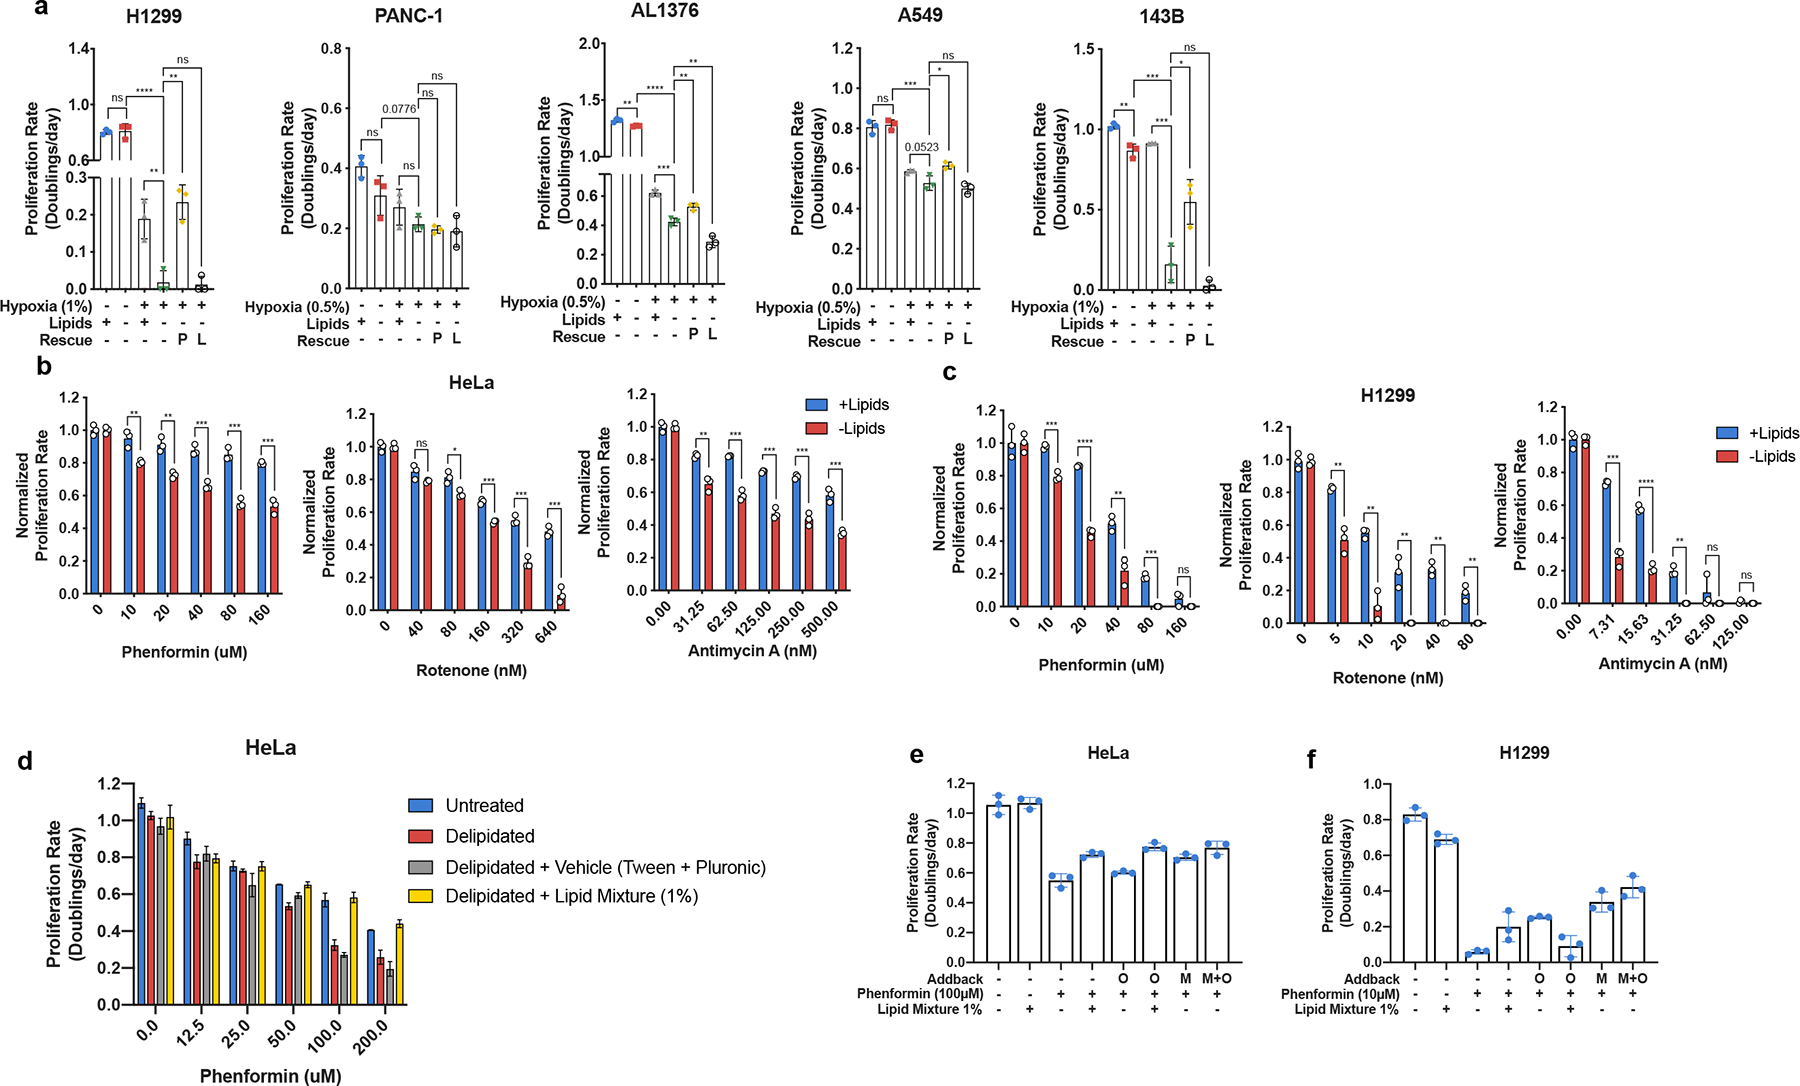
a, Proliferation rates of H1299, PANC-1, AL1376, A549, and 143B cells cultured in media +lipids or −lipids in normoxia (21% oxygen) or hypoxia (0.5% or 1% oxygen), without or with pyruvate (1mM, P) and/or lactate (10mM, L) as indicated (n=3 per condition from a representative experiment). b, Proliferation rate of HeLa cells cultured in media +lipids or −lipids with a titration of phenformin (Complex I inhibitor), rotenone (Complex I inhibitor), or antimycin A (Complex III inhibitor) as indicated (n=3 per condition from a representative experiment). c, Proliferation rate of H1299 cells cultured in media +lipids or −lipids with a titration of phenformin, rotenone, or antimycin A as indicated (n=3 per condition from a representative experiment). d, Proliferation rates of HeLa cells cultured in media containing the indicated doses of Phenformin with dialyzed fetal bovine serum that has been untreated, delipidated, delipidated and reconstituted with 1% Lipid Mixture (2 μg/ml arachidonic and 10 μg/ml each linoleic, linolenic, myristic, oleic, palmitic and stearic acid, and 0.22 mg/ml cholesterol), or delipidated and reconstituted with Tween-80 and Pluronic F-68 equivalent to what is present in 1% Lipid Mixture. e, Proliferation rates of HeLa cells cultured in media −lipids treated with phenformin (100μM), when indicated, and supplemented with either 1% Lipid Mixture or the equivalent amounts of oleate (O) and/or mevalonate (M) found in 1% Lipid Mixture f, Proliferation rates of H1299 cells cultured in media −lipids treated with phenformin (10μM), when indicated, and supplemented with either 1% Lipid Mixture or the equivalent amounts of oleate (O) and/or mevalonate (M) found in 1% Lipid Mixture. All data represent mean ± s.d. *P < 0.05, **P < 0.01, ***P < 0.001, ns P > 0.05, unpaired Student’s t-test. All experiments were repeated 3 times or more.
Extended Data Fig. 3 |. Orthogonal mechanisms of electron acceptor regeneration restores lipid synthesis under ETC inhibition.
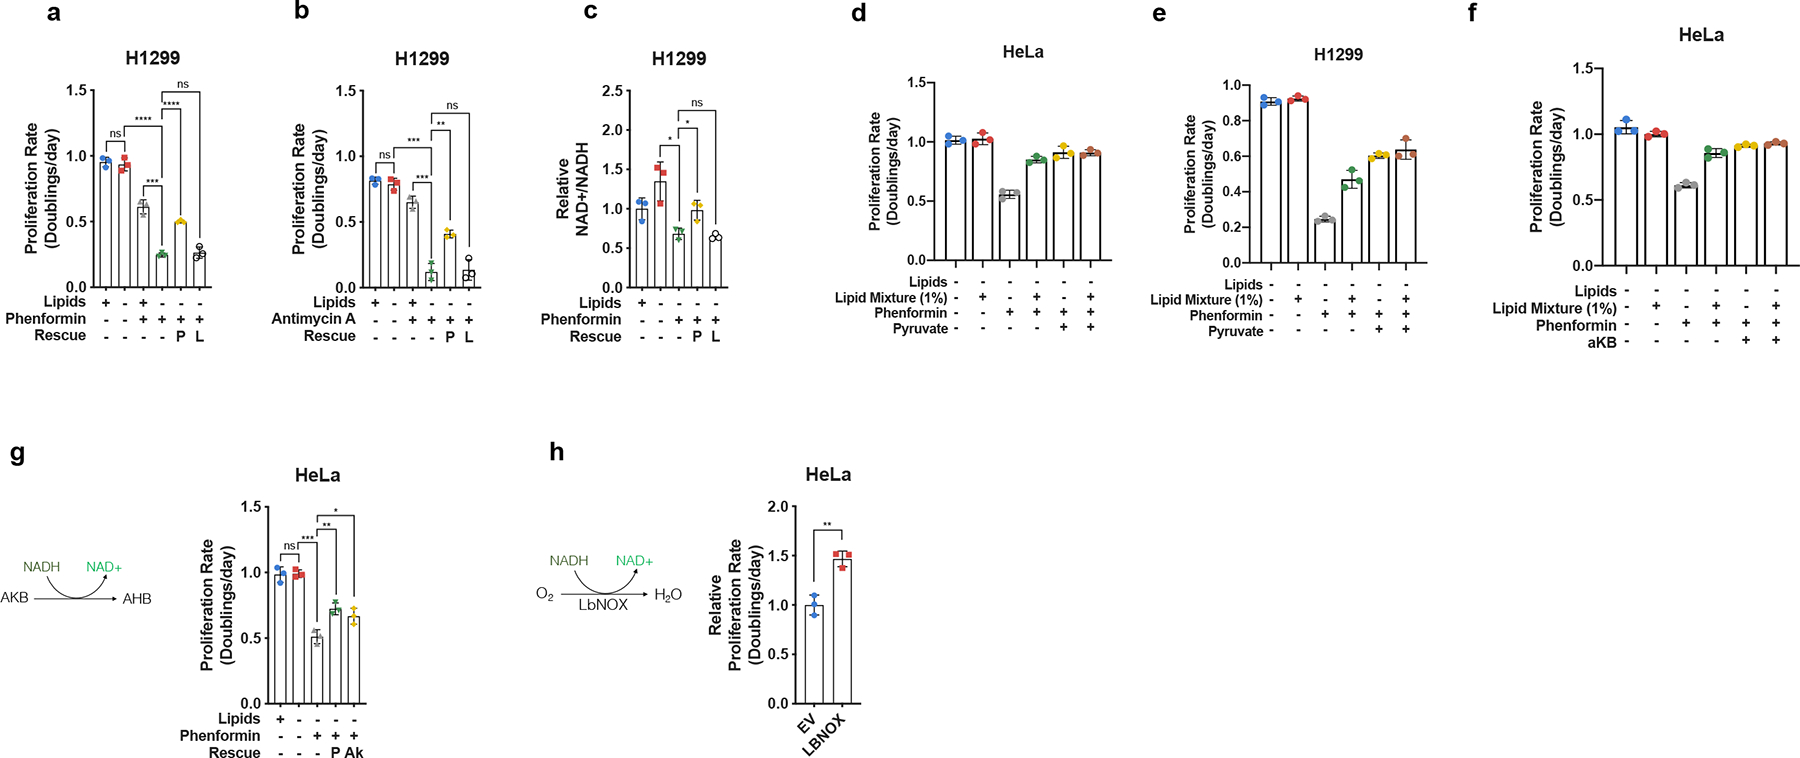
a, Proliferation rates of H1299 cells cultured in media +lipids or −lipids, without or with phenformin (10μM), pyruvate (1mM, P), and/or lactate (10mM, L) as indicated (n=3 per condition from a representative experiment). b, Proliferation rates of H1299 cells cultured in media +lipids or −lipids without or with antimycin A (15nM), pyruvate (1mM, P), and/or lactate (10mM, L) as indicated (n=3 per condition from a representative experiment). c, Relative NAD+/NADH ratio in H1299 cells cultured in media +lipids or −lipids without or with phenformin (10μM), pyruvate (1mM, P), and/or lactate (10mM, L) as indicated (n=3 per condition from a representative experiment). d, Proliferation rates of HeLa cells cultured in media −lipids without or with 1% Lipid Mixture, phenformin (100μM), and/or pyruvate (1mM, P), as indicated (n=3 per condition from a representative experiment). e, Proliferation rates of H1299 cells cultured in media −lipids without or with 1% Lipid Mixture, phenformin (10μM), and/or pyruvate (1mM, P), as indicated (n=3 per condition from a representative experiment). f, Proliferation rates of HeLa cells cultured in media −lipids without or with 1% Lipid Mixture, phenformin (100μM), and/or α-ketobutyrate (1mM, αKB), as indicated (n=3 per condition from a representative experiment). g, Proliferation rates of HeLa cells cultured in media +lipids or −lipids without or with phenformin (100μM), pyruvate (1mM, P), and/or alpha-ketobutyrate (1mM, Ak) as indicated (n=3 per condition from a representative experiment). h, Relative proliferation rates of HeLa cells expressing empty vector (EV) or lbNOX cultured in −lipids with phenformin (100μM) as indicated. Data were normalized to HeLa-EV cells (n=3 per condition from a representative experiment). All data represent mean ± s.d. *P < 0.05, **P < 0.01, ***P < 0.001, ns P > 0.05, unpaired Student’s t-test. All experiments were repeated 3 times or more.
Extended Data Fig. 4 |. Effects of aspartate on proliferation in the absence of lipids.

a, Proliferation rates of HeLa cells cultured in media +lipids or −lipids, without or with phenformin (100μM), and/or aspartic acid (10mM or 20mM) as indicated (n=3 per condition from a representative experiment). b, Proliferation rates of HeLa cells cultured in media +lipids or −lipids, without or with phenformin (100μM), and/or sodium aspartate (10mM) as indicated (n=3 per condition from a representative experiment). c, Proliferation rates of H1299 cells cultured in media +lipids or −lipids, without or with phenformin (10μM), and/or sodium aspartate (10mM) as indicated (n=3 per condition from a representative experiment). All data represent mean ± s.d. *P < 0.05, **P < 0.01, ***P < 0.001, ns P > 0.05, unpaired Student’s t-test. All experiments were repeated 3 times or more.
Extended Data Fig. 5 |. Effects of exogenous metabolites on ACC phosphorylation.

a, Immunoblot of total ACC and ACC serine 79 phosphorylation in HeLa cells cultured for 24 hours in media +lipids or −lipids without or with phenformin (100μM), pyruvate (1mM, Pyr), lactate (10mM, Lac), and/or acetate (200μM, Ac) as indicated. b, Immunoblot of FASN, phosphorylated PDHA (Serine 232, Serine 293, and Serine 300), total PHDA, PDK1, PDP1, and Vinculin in HeLa cells starved of lipids over time. c, Immunoblot of FASN, phosphorylated PDHA (Serine 293), total PDHA, and Vinculin in HeLa or H1299 cells overexpressing eGFP or constitutively mature SREBP1a. d, Immunoblot of phosphorylated PDHA (Serine 293) and Vinculin in HeLa cultured in −lipids for 24hrs, treated with vehicle, phenformin, antimycin, pyruvate, and/or alpha-ketobutyrate at the indicated doses.
Extended Data Fig. 6 |. Inhibition of mitochondrial electron transport decreases intracellular citrate levels.
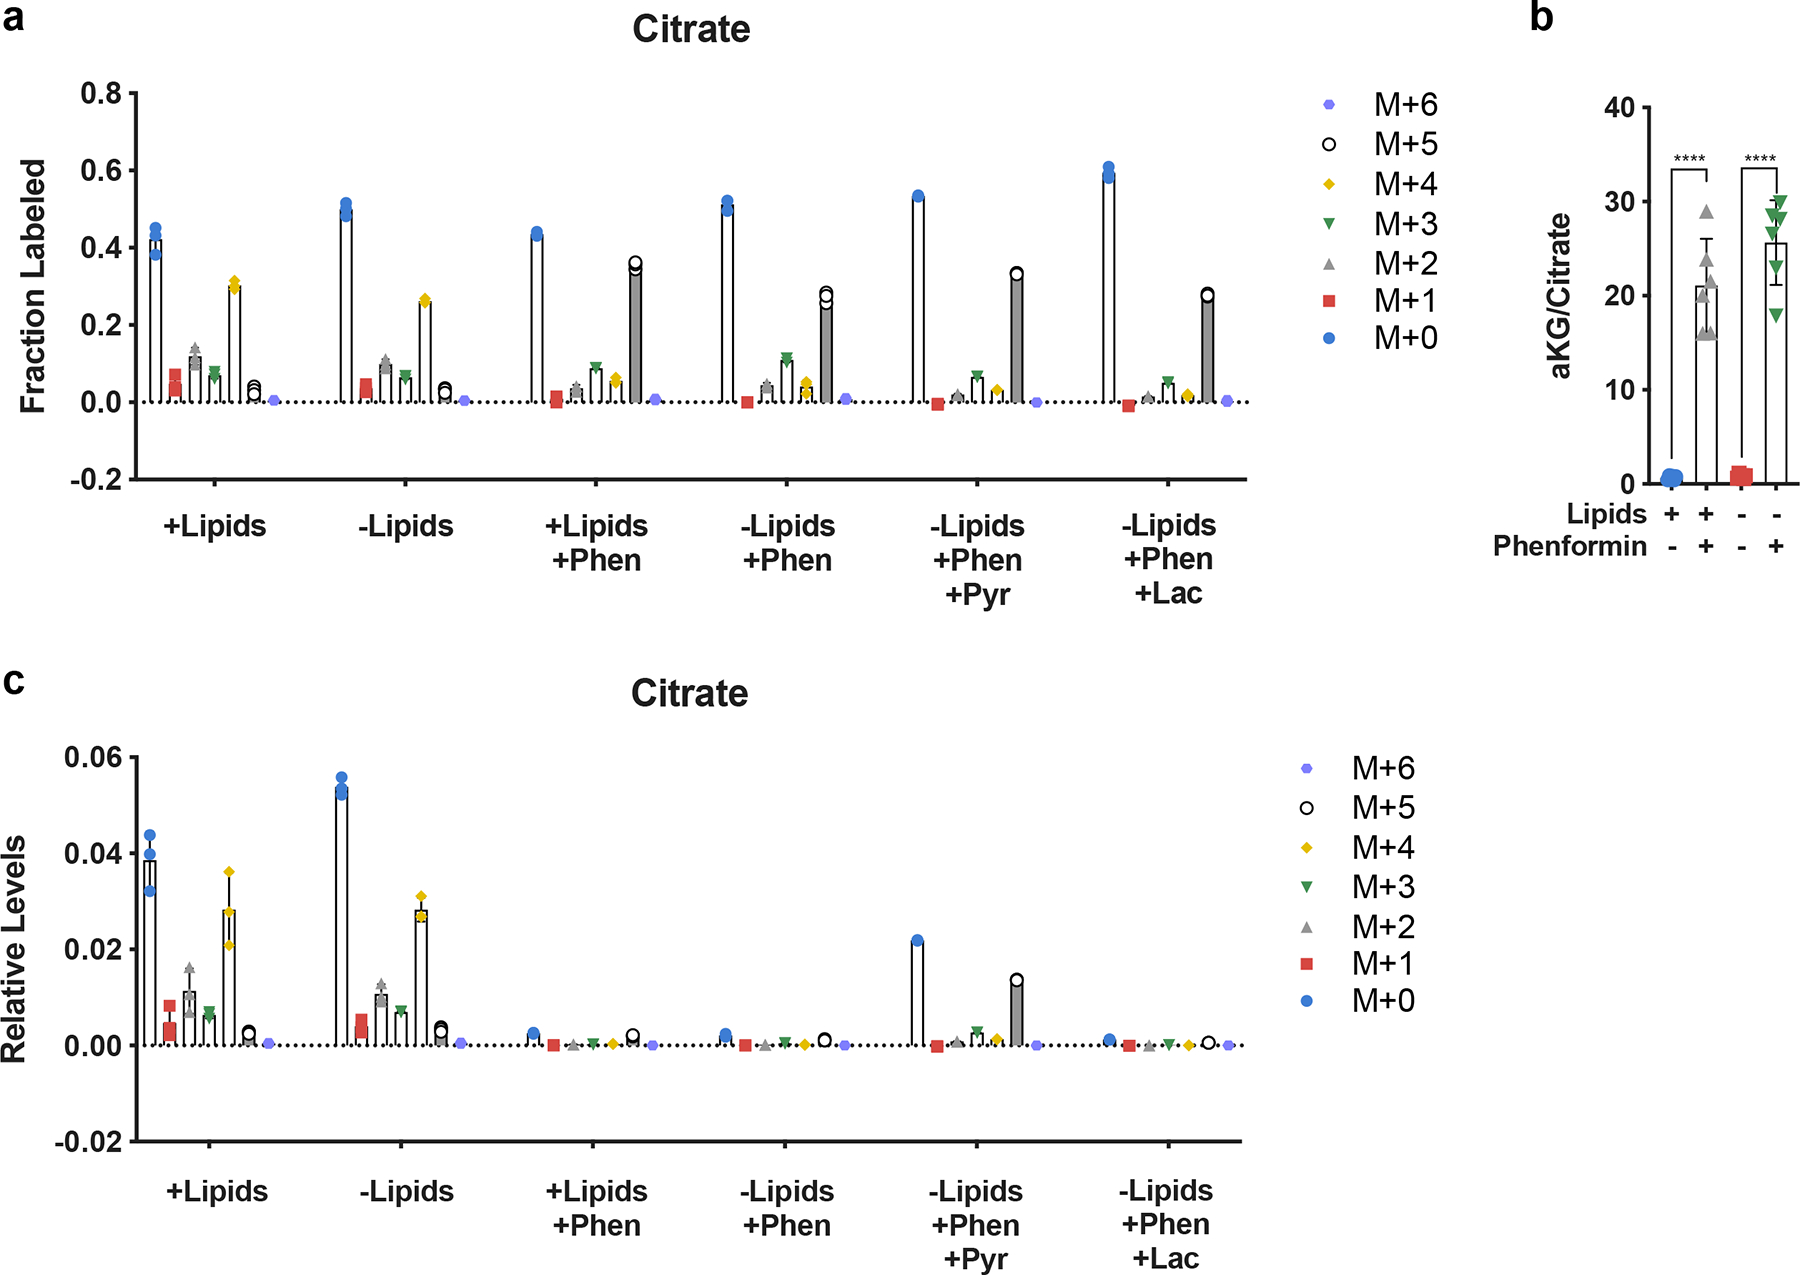
a, Relative fractional distribution of citrate isotopomers in HeLa cells cultured for 24 hours in media +lipids or −lipids with U-13C-Glutamine, without and with phenformin (100μM), pyruvate (1mM, Pyr), and/or lactate (10mM, Lac) as indicated. b, Normalized intracellular ratio of αKG to citrate in HeLa cells cultured in +lipids or −lipids with or without phenformin (100μM). (n=6 per condition from a representative experiment). c, Isotopomer distribution of total levels of intracellular citrate in HeLa cells cultured for 24 hours in media +lipids or −lipids with U-13C-Glutamine, without and with phenformin (100μM), pyruvate (1mM, Pyr), and/or lactate (10mM, Lac) as indicated. All data represent mean ± s.d. ****P < 0.0001, unpaired Student’s t-test. All experiments were repeated 3 times or more. (n=3 per condition from a representative experiment).
Extended Data Fig. 7 |. Bypassing oxidative steps in fatty acid synthesis rescues proliferation in electron acceptor deficient cells.
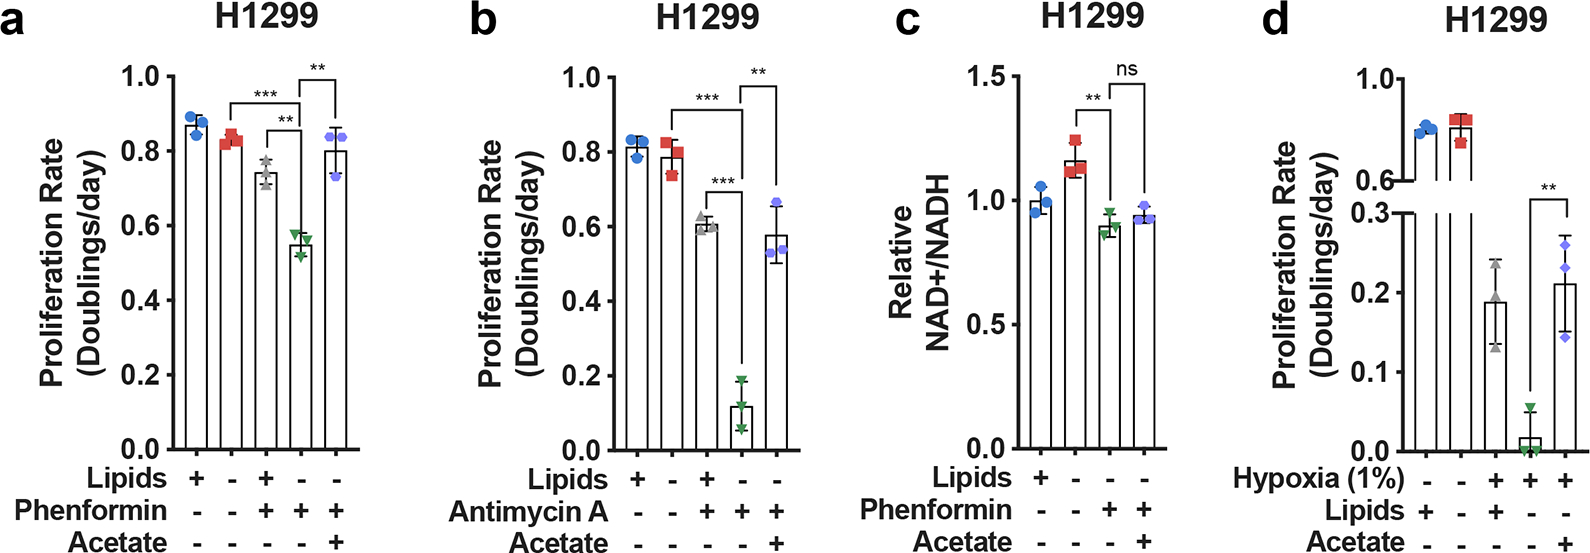
a, Proliferation rates of H1299 cells cultured in media +lipids or −lipids without or with phenformin (10μM) and/or acetate (200 μM) as indicated (n=3 per condition from a representative experiment). b, Proliferation rates of H1299 cells cultured in media +lipids or −lipids without or with antimycin A (15nM) and/or acetate (200 μM) as indicated (n=3 per condition from a representative experiment). c, Relative NAD+/NADH ratio in H1299 cells cultured in media +lipids or −lipids without or with phenformin (10μM) and/or acetate (200 μM) as indicated (n=3 per condition from a representative experiment). d, Proliferation rates of H1299 cells cultured in media +lipids or −lipids in normoxia (21% oxygen), hypoxia (1% oxygen), and/or acetate (200 μM) as indicated. Data from the first four conditions are the same as those presented in Extended Data Fig. 2a. (n=3 per condition from a representative experiment). e, NADP+/NADPH ratio in HeLa cells cultured in media +lipids or −lipids in hypoxia (1% oxygen) or phenformin (100 μM) with pyruvate (1mM), lactate (10mM), or acetate (200μM) added, as indicated. Ratios of NADP+/NADPH were normalized to normoxia samples or vehicle treated samples (n=3 per condition from a representative experiment). All data represent mean ± s.d. **P < 0.01, ***P < 0.001, ns P > 0.05, unpaired Student’s t-test. All experiments were repeated 3 times or more.
Extended Data Fig. 8 |. Effect of exogenous acetate on levels of TCA cycle intermediates.
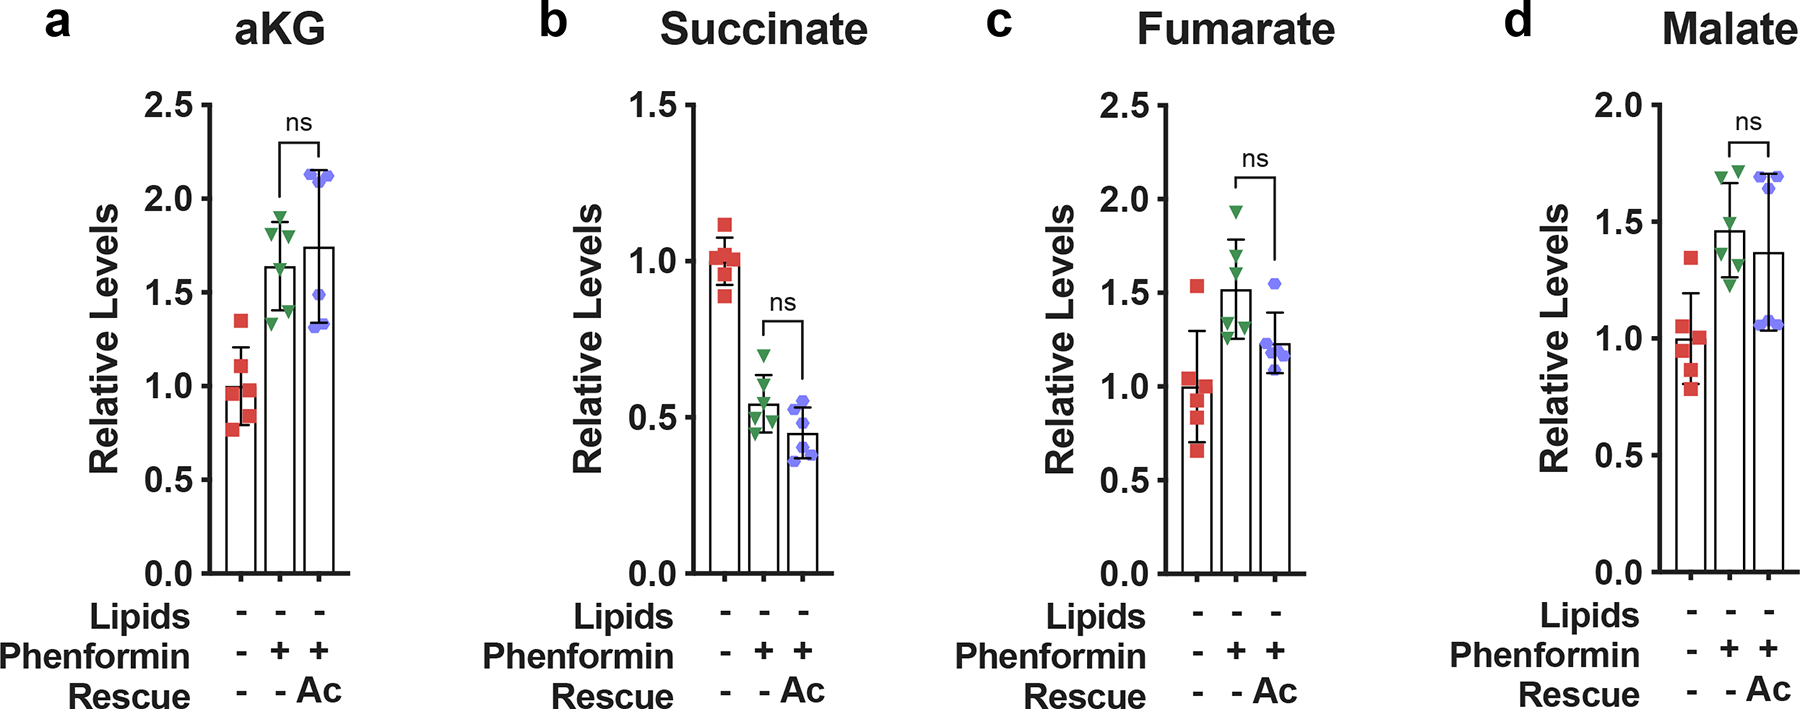
a, Relative intracellular alpha-ketoglutarate levels in HeLa cells cultured for 24 hours in media −lipids without or with phenformin (100μM) and/or acetate (200 μM) as indicated (n=6 per condition from a representative experiment). b, Relative intracellular succinate levels in HeLa cells cultured for 24 hours in media −lipids without or with phenformin (100μM) and/or acetate (200 μM) as indicated (n=6 per condition from a representative experiment). c, Relative intracellular fumarate levels in HeLa cells for 24 hours in media −lipids without or with phenformin (100μM) and/or acetate (200 μM) (n=6 per condition from a representative experiment). d, Relative intracellular malate levels in HeLa cells cultured for 24 hours in media −lipids without or with phenformin (100μM) and/or acetate (200 μM) (n=6 per condition from a representative experiment). All data represent mean ± s.d., ns P > 0.05, unpaired Student’s t-test. All experiments were repeated 3 times or more.
Extended Data Fig. 9 |. Gene expression correlations between lipid metabolism genes and hypoxia signature genes.
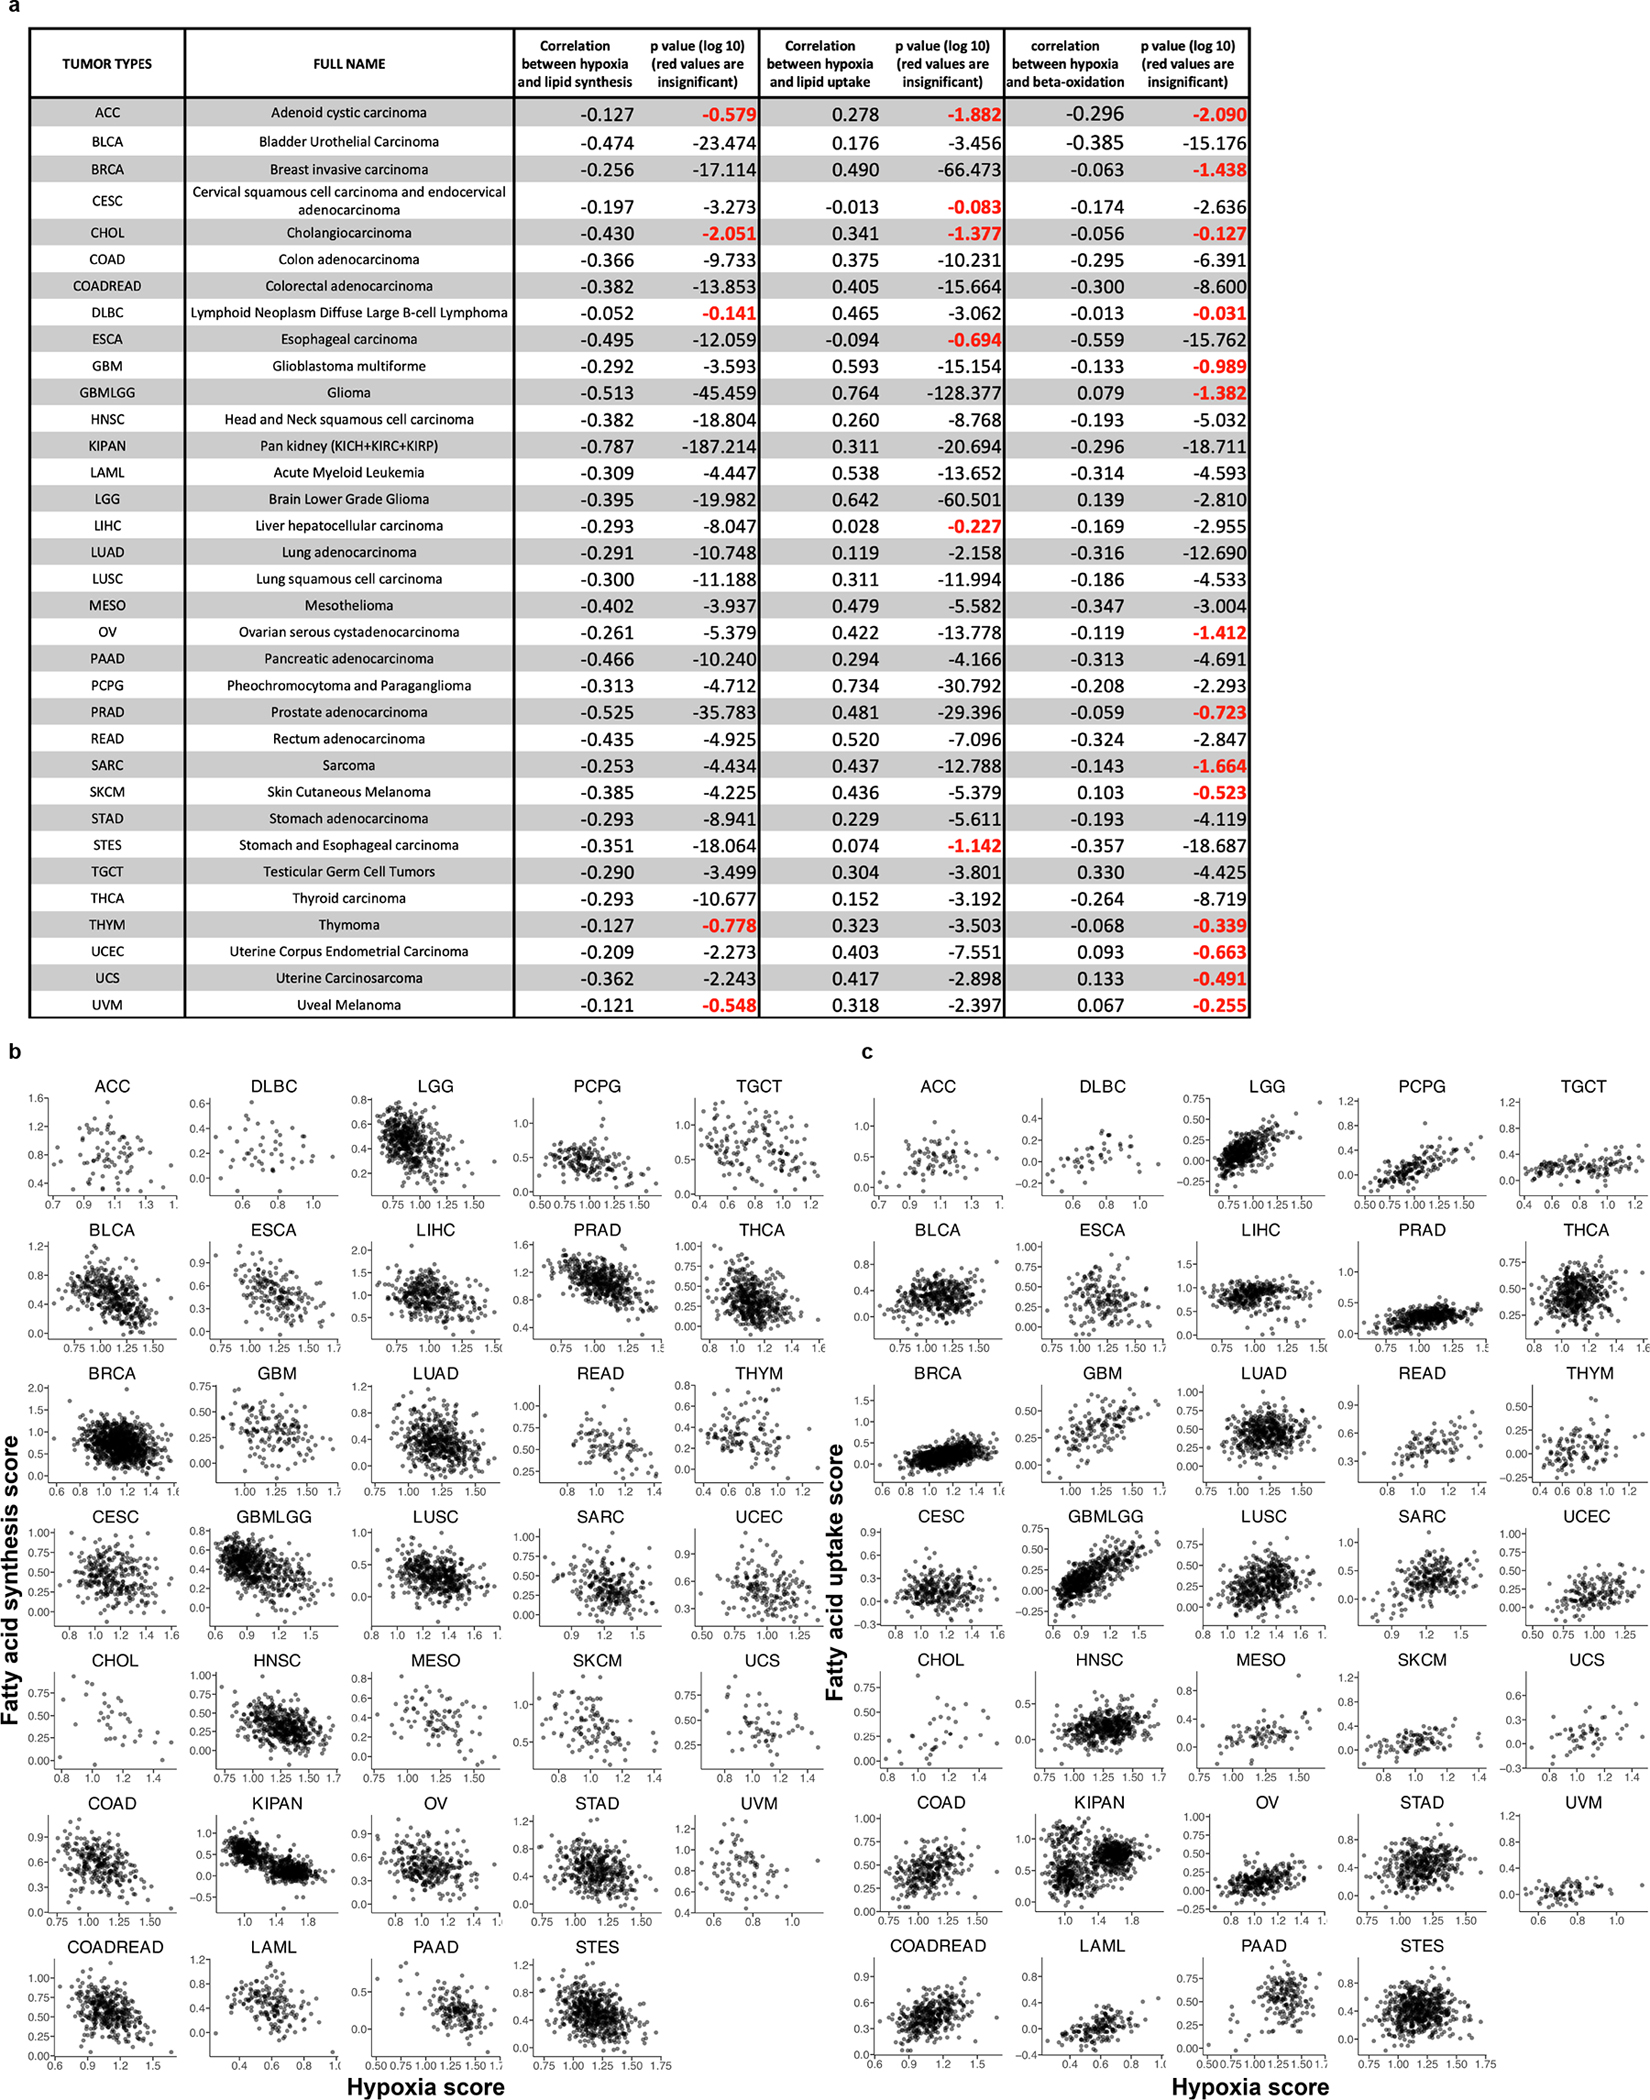
a, Pearson correlation coefficients and corresponding p-values, for each of 34 different tumor types, between expression of hypoxia signature genes and expression of fatty acid synthesis genes (third column), lipid uptake genes (fourth column), and beta-oxidation genes (fifth column). Insignificant correlations, based on the 1% FDR cutoff, are marked in red. b, Scatter plots showing, for each considered tumor type, the correlation between the tumor hypoxia score and expression of genes participating in fatty acid synthesis, with dots representing individual TCGA samples. c, Scatter plots showing, for each considered tumor type, the correlation between the tumor hypoxia score and expression of genes participating in lipid uptake, with dots representing individual TCGA samples.
Extended Data Fig. 10 |. Gene expression correlations between lipid metabolism genes and hypoxia signature genes.
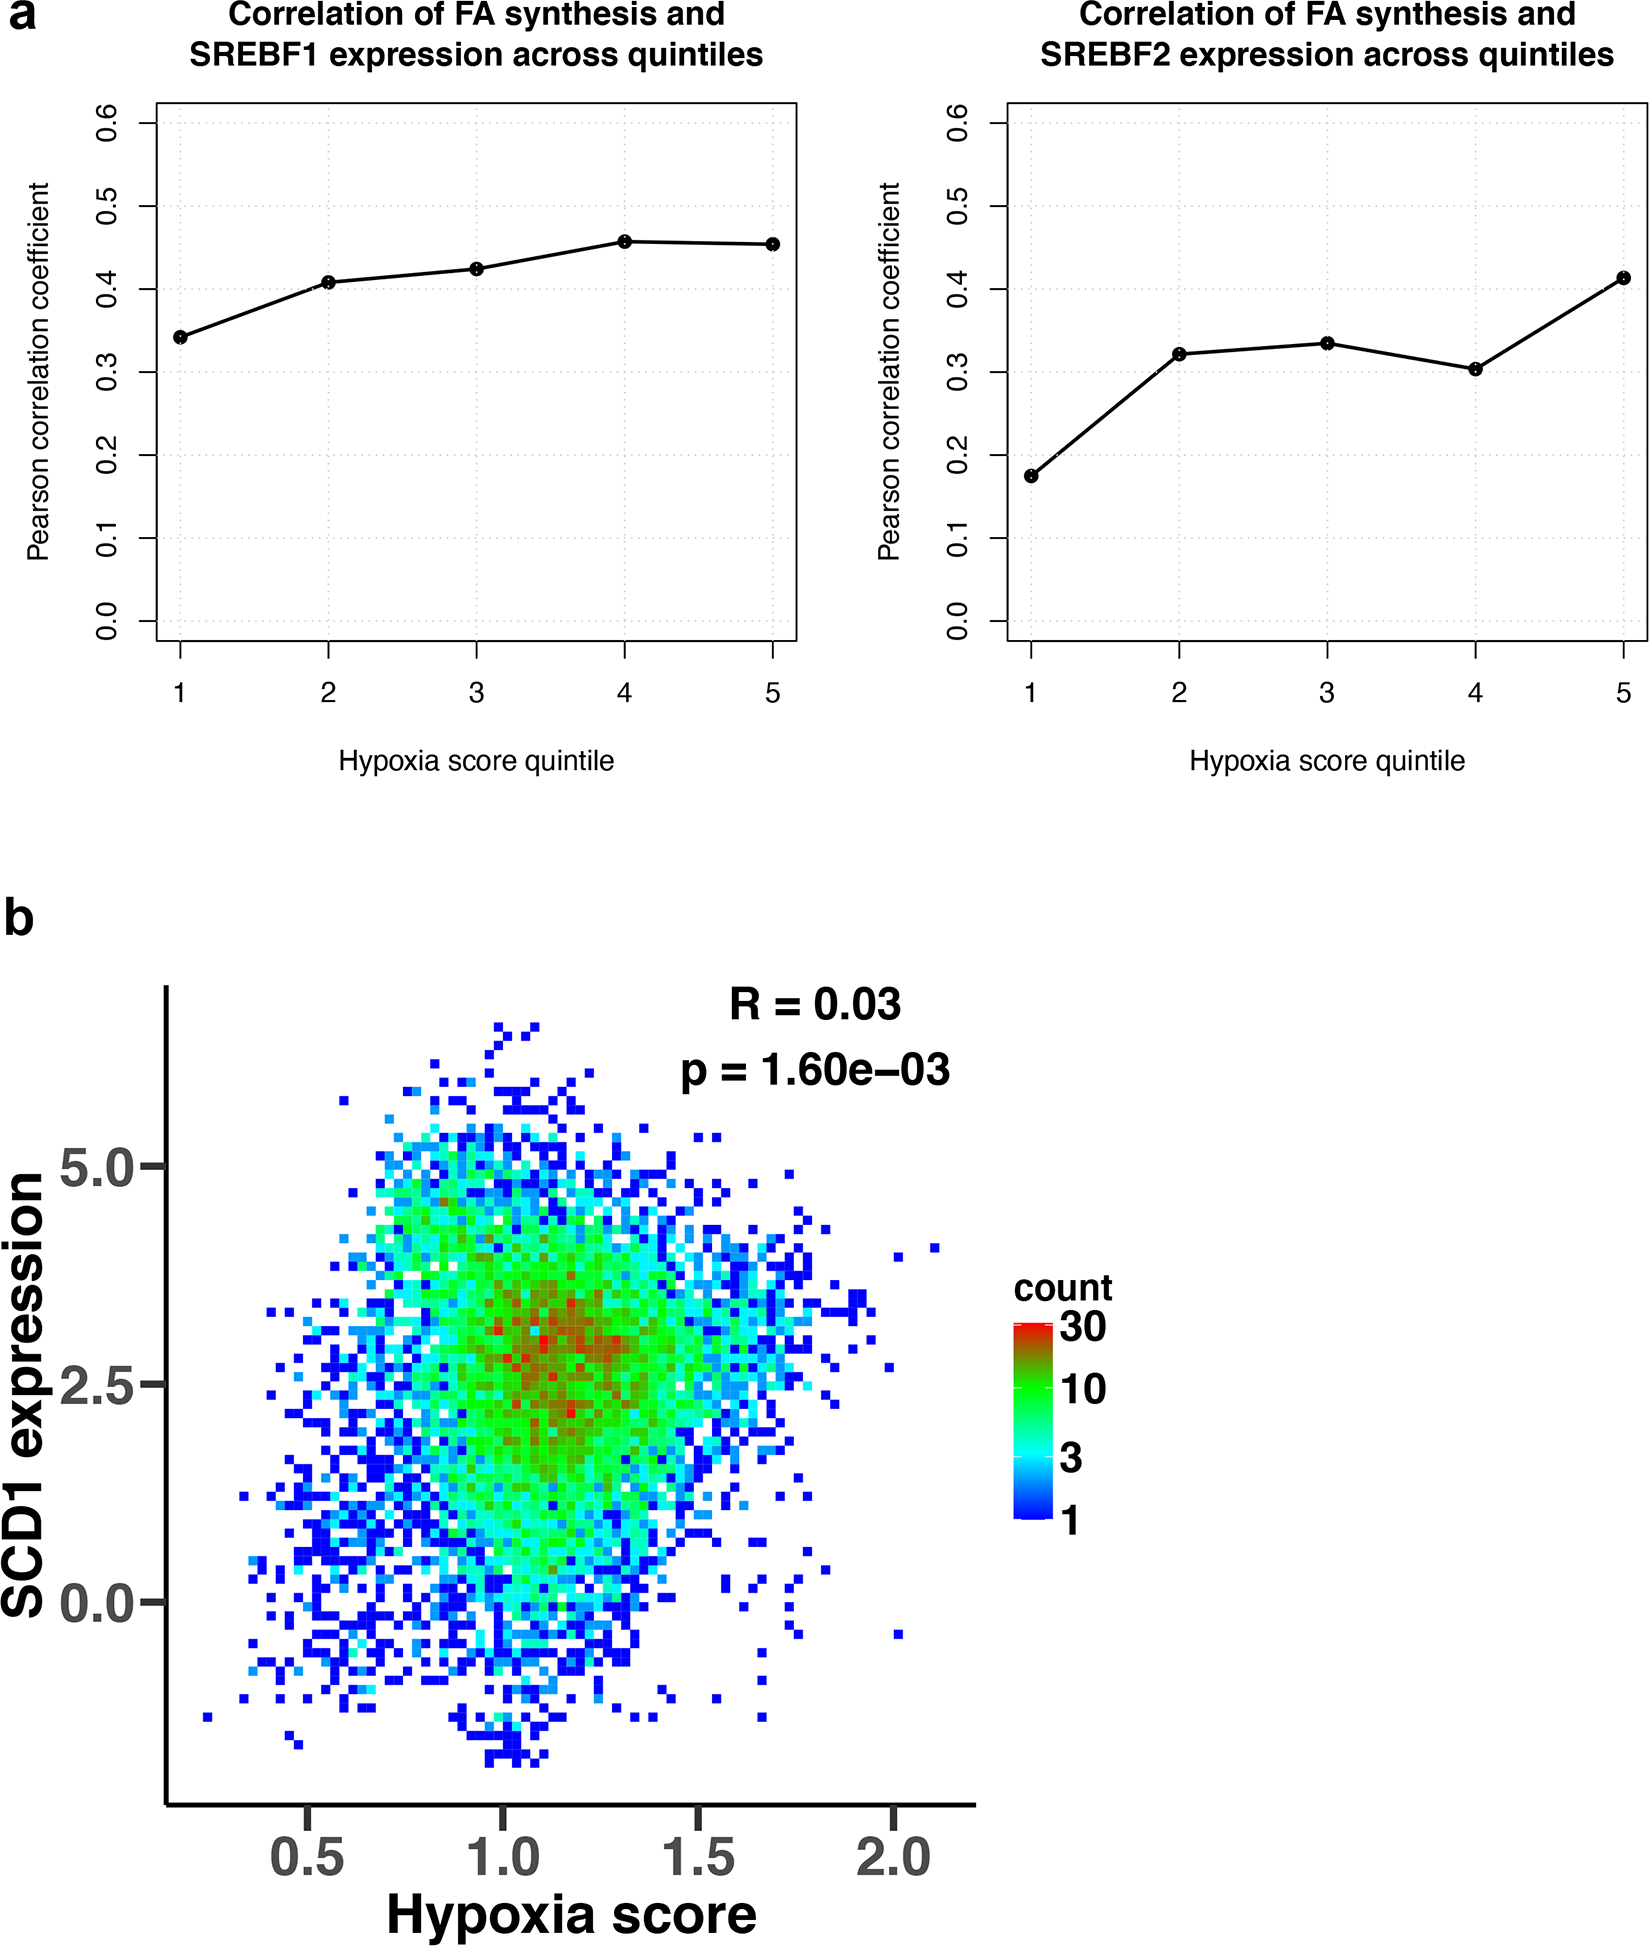
a, Correlation of mRNA expression of SREBF1/2 and of gene markers of fatty acid synthesis within individual hypoxia score quintiles. Pearson’s correlation coefficients were calculated for each of five equally-sized bins of TCGA samples, corresponding to five hypoxia score quintiles, for SREBF1 (left) and SREBF2 (right). TCGA samples were sorted into quintiles based on their hypoxia scores from the lowest hypoxia score (quintile 1) to the highest score (quintile 5). b, Density plot of the correlation between the average mRNA expression of gene markers of tumor hypoxia and mRNA expression of Stearoyl-CoA desaturase 1 (SCD1) gene. Density counts represent the number of TCGA samples with the corresponding expression values, with red color representing high density regions and blue color representing low density regions, and the Pearson’s correlation coefficient (R) and the p-value are shown in the figure.
Supplementary Material
Acknowledgements
We thank the members of the Vitkup and Vander Heiden lab for helpful discussions. The results published here are in part based upon data generated by the TCGA Research Network. This work is supported by the NIH grant R01CA201276 (D.V., M.G.V.H.), T32GM007367 (B.W.J.), the M.D.-Ph.D. program at Columbia University (B.W.J.), the NIH grant U54CA209997 (P.D., K.T., B.W.J., D.V.), and T32GM007287 (Z.L., K.L.A.). E.C.L. is a Damon Runyon Fellow supported by the Damon Runyon Cancer Research Foundation (DRG-2299-17). A.M.H. was supported by an HHMI International Student Fellowship. J.C.R. is supported by the Harvard/MIT MD-PhD Program NIH award T32GM007753. L.B.S. acknowledges support from a Pathway to Independence award from the NIH (K99CA218679/R00CA218679). E.F.G. was supported by the MIT MSRP program. M.G.V.H. also acknowledges support from the Lustgarten Foundation, SU2C, the Ludwig Center at MIT, the NCI (R35CA242379, P30CA014051), the MIT Center for Precision Cancer Medicine, the Emerald Foundation, and a Faculty Scholar award from HHMI. The content is solely the responsibility of the authors and does not necessarily represent the official views of the National Institute of General Medical Sciences or the National Institutes of Health.
References
- 1.Hosios AM et al. Amino acids rather than glucose account for the majority of cell mass in proliferating mammalian cells. Dev. Cell 36, 540–549 (2016). [DOI] [PMC free article] [PubMed] [Google Scholar]
- 2.Yao C-H et al. Exogenous Fatty Acids Are the Preferred Source of Membrane Lipids in Proliferating Fibroblasts. Cell Chemical Biology 23, 483–493 (2016). [DOI] [PMC free article] [PubMed] [Google Scholar]
- 3.Jain M et al. Metabolite Profiling Identifies a Key Role for Glycine in Rapid Cancer Cell Proliferation. Science 336, 1040 (2012). [DOI] [PMC free article] [PubMed] [Google Scholar]
- 4.Damaraju VL et al. Nucleoside anticancer drugs: the role of nucleoside transporters in resistance to cancer chemotherapy. Oncogene 22, 7524–7536 (2003). [DOI] [PubMed] [Google Scholar]
- 5.Muir A, Danai LV & Vander Heiden MG Microenvironmental regulation of cancer cell metabolism: implications for experimental design and translational studies. Disease Models & Mechanisms 11, dmm035758–12 (2018). [DOI] [PMC free article] [PubMed] [Google Scholar]
- 6.Sullivan MR et al. Quantification of microenvironmental metabolites in murine cancers reveals determinants of tumor nutrient availability. Elife 8, e44235 (2019). [DOI] [PMC free article] [PubMed] [Google Scholar]
- 7.Vaupel P, Kallinowski F & Okunieff P Blood flow, oxygen and nutrient supply, and metabolic microenvironment of human tumors: a review. Cancer Res 49, 6449 (1989). [PubMed] [Google Scholar]
- 8.Eales KL, Hollinshead KER & Tennant DA Hypoxia and metabolic adaptation of cancer cells. Oncogenesis 5, e190–8 (2016). [DOI] [PMC free article] [PubMed] [Google Scholar]
- 9.Hu J et al. Heterogeneity of tumor-induced gene expression changes in the human metabolic network. Nature Biotechnology 31, 522–529 (2013). [DOI] [PMC free article] [PubMed] [Google Scholar]
- 10.Gui DY et al. Environment Dictates Dependence on Mitochondrial Complex I for NAD+ and Aspartate Production and Determines Cancer Cell Sensitivity to Metformin. Cell Metabolism 24, 716–727 (2016). [DOI] [PMC free article] [PubMed] [Google Scholar]
- 11.Sullivan LB et al. Supporting Aspartate Biosynthesis Is an Essential Function of Respiration in Proliferating Cells. Cell 162, 552–563 (2015). [DOI] [PMC free article] [PubMed] [Google Scholar]
- 12.Sullivan LB et al. Aspartate is an endogenous metabolic limitation for tumour growth. Nature Cell Biology 20, 1–12 (2018). [DOI] [PMC free article] [PubMed] [Google Scholar]
- 13.Birsoy K et al. An Essential Role of the Mitochondrial Electron Transport Chain in Cell Proliferation Is to Enable Aspartate Synthesis. Cell 162, 540–551 (2015). [DOI] [PMC free article] [PubMed] [Google Scholar]
- 14.Garcia-Bermudez J et al. Aspartate is a limiting metabolite for cancer cell proliferation under hypoxia and in tumours. Nature Cell Biology 20, 1–12 (2018). [DOI] [PMC free article] [PubMed] [Google Scholar]
- 15.Fernandez-de-Cossio-Diaz J & Vazquez A Limits of aerobic metabolism in cancer cells. Sci. Rep. 7, 13488 (2017). [DOI] [PMC free article] [PubMed] [Google Scholar]
- 16.Titov DV et al. Complementation of mitochondrial electron transport chain by manipulation of the NAD+/NADH ratio. Science 352, 231–235 (2016). [DOI] [PMC free article] [PubMed] [Google Scholar]
- 17.Diehl FF, Lewis CA, Fiske BP & Vander Heiden MG Cellular redox state constrains serine synthesis and nucleotide production to impact cell proliferation. Nature Metabolism (2019). [DOI] [PMC free article] [PubMed] [Google Scholar]
- 18.Bao XR et al. Mitochondrial dysfunction remodels one-carbon metabolism in human cells. Elife 5, e10575 (2016). [DOI] [PMC free article] [PubMed] [Google Scholar]
- 19.Murphy JP et al. The NAD+ Salvage Pathway Supports PHGDH-Driven Serine Biosynthesis. Cell Reports 24, 2381–2391.e5 (2018). [DOI] [PMC free article] [PubMed] [Google Scholar]
- 20.Kim W et al. Polyunsaturated Fatty Acid Desaturation Is a Mechanism for Glycolytic NAD+ Recycling. Cell Metabolism 1–42 (2019). [DOI] [PMC free article] [PubMed] [Google Scholar]
- 21.Price NC & Stevens L Fundamentals of Enzymology. (Oxford University Press, 2000). [Google Scholar]
- 22.Los DA & Murata N Structure and expression of fatty acid desaturases. Biochimica et Biophysica Acta (BBA) - Lipids and Lipid Metabolism 1394, 3–15 (1998). [DOI] [PubMed] [Google Scholar]
- 23.Park SH et al. Phosphorylation-activity relationships of AMPK and acetyl-CoA carboxylase in muscle. Journal of Applied Physiology 92, 2475–2482 (2002). [DOI] [PubMed] [Google Scholar]
- 24.Schulz H Beta oxidation of fatty acids. Biochimica et Biophysica Acta (BBA) - Lipids and Lipid Metabolism 1081, 109–120 (1991). [DOI] [PubMed] [Google Scholar]
- 25.Kamphorst JJ et al. Hypoxic and Ras-transformed cells support growth by scavenging unsaturated fatty acids from lysophospholipids. Proc Natl Acad Sci USA 110, 8882 (2013). [DOI] [PMC free article] [PubMed] [Google Scholar]
- 26.Ackerman D et al. Triglycerides Promote Lipid Homeostasis during Hypoxic Stress by Balancing Fatty Acid Saturation. Cell Reports 24, 2596–2605.e5 (2018). [DOI] [PMC free article] [PubMed] [Google Scholar]
- 27.Bensaad K et al. Fatty acid uptake and lipid storage induced by HIF-1α contribute to cell growth and survival after hypoxia-reoxygenation. Cell Reports 9, 349–365 (2014). [DOI] [PubMed] [Google Scholar]
- 28.Jain IH et al. Genetic Screen for Cell Fitness in High or Low Oxygen Highlights Mitochondrial and Lipid Metabolism. Cell 181, 716–727.e11 (2020). [DOI] [PMC free article] [PubMed] [Google Scholar]
- 29.Luengo A et al. Increased demand for NAD(+) relative to ATP drives aerobic glycolysis. Mol. Cell 81, 691–707.e6 (2021). [DOI] [PMC free article] [PubMed] [Google Scholar]
- 30.Harris AL Hypoxia — a key regulatory factor in tumour growth. Nature Reviews Cancer 2, 38–47 (2002). [DOI] [PubMed] [Google Scholar]
- 31.Wise DR et al. Hypoxia promotes isocitrate dehydrogenase-dependent carboxylation of α-ketoglutarate to citrate to support cell growth and viability. Proc Natl Acad Sci USA 108, 19611 (2011). [DOI] [PMC free article] [PubMed] [Google Scholar]
- 32.Metallo CM et al. Reductive glutamine metabolism by IDH1 mediates lipogenesis under hypoxia. Nature 481, 380–384 (2012). [DOI] [PMC free article] [PubMed] [Google Scholar]
- 33.Mullen AR et al. Reductive carboxylation supports growth in tumour cells with defective mitochondria. Nature 481, 385–388 (2011). [DOI] [PMC free article] [PubMed] [Google Scholar]
- 34.Dupuy F et al. PDK1-Dependent Metabolic Reprogramming Dictates Metastatic Potential in Breast Cancer. Cell Metabolism 22, 577–589 (2015). [DOI] [PubMed] [Google Scholar]
- 35.Duarte NC et al. Global reconstruction of the human metabolic network based on genomic and bibliomic data. Proc Natl Acad Sci USA 104, 1777 (2007). [DOI] [PMC free article] [PubMed] [Google Scholar]
- 36.Orth JD, Thiele I & Palsson BØ What is flux balance analysis? Nature Biotechnology 28, 245–248 (2010). [DOI] [PMC free article] [PubMed] [Google Scholar]
- 37.Jerby L, Shlomi T & Ruppin E Computational reconstruction of tissue-specific metabolic models: application to human liver metabolism. Mol Syst Biol 6, 401 (2010). [DOI] [PMC free article] [PubMed] [Google Scholar]
- 38.Zielinski DC et al. Systems biology analysis of drivers underlying hallmarks of cancer cell metabolism. Sci. Rep. 7, 41241 (2017). [DOI] [PMC free article] [PubMed] [Google Scholar]
- 39.Saggerson ED The regulation of glyceride synthesis in isolated white-fat cells. The effects of acetate, pyruvate, lactate, palmitate, electron-acceptors, uncoupling agents and oligomycin. Biochem J 128, 1069–1078 (1972). [DOI] [PMC free article] [PubMed] [Google Scholar]
- 40.Wise EM, Jr & Ball, E. G. Malic enzyme and Lipogenesis. Proc Natl Acad Sci USA 52, 1255–1263 (1964). [DOI] [PMC free article] [PubMed] [Google Scholar]
- 41.Liu L et al. Malic enzyme tracers reveal hypoxia-induced switch in adipocyte NADPH pathway usage. Nat. Chem. Biol. 12, 345–352 (2016). [DOI] [PMC free article] [PubMed] [Google Scholar]
- 42.Hosios AM & Vander Heiden MG The redox requirements of proliferating mammalian cells. Journal of Biological Chemistry 293, 7490–7498 (2018). [DOI] [PMC free article] [PubMed] [Google Scholar]
- 43.DeBerardinis RJ et al. Beyond aerobic glycolysis: Transformed cells can engage in glutamine metabolism that exceeds the requirement for protein and nucleotide synthesis. Proc Natl Acad Sci USA 104, 19345 (2007). [DOI] [PMC free article] [PubMed] [Google Scholar]
- 44.Santos CR & Schulze A Lipid metabolism in cancer. FEBS Journal 279, 2610–2623 (2012). [DOI] [PubMed] [Google Scholar]
- 45.Hosios A, Li Z, Lien E & Vander Heiden M Preparation of Lipid-Stripped Serum for the Study of Lipid Metabolism in Cell Culture. BIO-PROTOCOL 8, 1–8 (2018). [DOI] [PMC free article] [PubMed] [Google Scholar]
- 46.Gameiro PA et al. In Vivo HIF-Mediated Reductive Carboxylation Is Regulated by Citrate Levels and Sensitizes VHL-Deficient Cells to Glutamine Deprivation. Cell Metabolism 17, 372–385 (2013). [DOI] [PMC free article] [PubMed] [Google Scholar]
- 47.Kaplon J et al. A key role for mitochondrial gatekeeper pyruvate dehydrogenase in oncogene-induced senescence. Nature 498, 109–112 (2013). [DOI] [PubMed] [Google Scholar]
- 48.Linn TC, Pettit FH & Reed LJ α-keto acid dehydrogenase complexes, X. Regulation of the activity of pyruvate dehydrogenase complex from beef kidney mitochondria by phosphorylation and dephosphorylation. Proc Natl Acad Sci USA 62, 234 (1969). [DOI] [PMC free article] [PubMed] [Google Scholar]
- 49.Schell JC et al. A Role for the Mitochondrial Pyruvate Carrier as a Repressor of the Warburg Effect and Colon Cancer Cell Growth. Mol. Cell 56, 400–413 (2014). [DOI] [PMC free article] [PubMed] [Google Scholar]
- 50.Vacanti NM et al. Regulation of Substrate Utilization by the Mitochondrial Pyruvate Carrier. Mol. Cell 56, 425–435 (2014). [DOI] [PMC free article] [PubMed] [Google Scholar]
- 51.Yang C et al. Glutamine Oxidation Maintains the TCA Cycle and Cell Survival during Impaired Mitochondrial Pyruvate Transport. Mol. Cell 56, 414–424 (2014). [DOI] [PMC free article] [PubMed] [Google Scholar]
- 52.Bricker DK et al. A Mitochondrial Pyruvate Carrier Required for Pyruvate Uptake in Yeast, Drosophila, and Humans. Science 337, 96 (2012). [DOI] [PMC free article] [PubMed] [Google Scholar]
- 53.Herzig S et al. Identification and Functional Expression of the Mitochondrial Pyruvate Carrier. Science 337, 93 (2012). [DOI] [PubMed] [Google Scholar]
- 54.Fendt S-M et al. Reductive glutamine metabolism is a function of the α-ketoglutarate to citrate ratio in cells. Nature Communications 4, 2236 (2013). [DOI] [PMC free article] [PubMed] [Google Scholar]
- 55.Harris AL Hypoxia — a key regulatory factor in tumour growth. Nature Reviews Cancer 2, 38–47 (2002). [DOI] [PubMed] [Google Scholar]
- 56.Owen MR, Doran E & Halestrap AP Evidence that metformin exerts its anti-diabetic effects through inhibition of complex 1 of the mitochondrial respiratory chain. Biochem J 348 Pt 3, 607–614 (2000). [PMC free article] [PubMed] [Google Scholar]
- 57.Bücher T et al. State of Oxidation-Reduction and State of Binding in the Cytosolic NADH-System as Disclosed by Equilibration with Extracellular Lactate/Pyruvate in Hemoglobin-Free Perfused Rat Liver. Eur J Biochem 27, 301–317 (1972). [DOI] [PubMed] [Google Scholar]
- 58.Hung YP, Albeck JG, Tantama M & Yellen G Imaging Cytosolic NADH-NAD+ Redox State with a Genetically Encoded Fluorescent Biosensor. Cell Metabolism 14, 545–554 (2011). [DOI] [PMC free article] [PubMed] [Google Scholar]
- 59.Hatzivassiliou G et al. ATP citrate lyase inhibition can suppress tumor cell growth. Cancer Cell 8, 311–321 (2005). [DOI] [PubMed] [Google Scholar]
- 60.Faubert B et al. Lactate Metabolism in Human Lung Tumors. Cell 171, 358–371.e9 (2017). [DOI] [PMC free article] [PubMed] [Google Scholar]
- 61.Hui S et al. Glucose feeds the TCA cycle via circulating lactate. Nature 551, 115–118 (2017). [DOI] [PMC free article] [PubMed] [Google Scholar]
- 62.Zhao Y et al. In vivo monitoring of cellular energy metabolism using SoNar, a highly responsive sensor for NAD+/NADH redox state. Nat Protoc 11, 1345–1359 (2016). [DOI] [PubMed] [Google Scholar]
- 63.Garcia D & Shaw RJ AMPK: Mechanisms of Cellular Energy Sensing and Restoration of Metabolic Balance. Mol. Cell 66, 789–800 (2017). [DOI] [PMC free article] [PubMed] [Google Scholar]
- 64.Birsoy K et al. An Essential Role of the Mitochondrial Electron Transport Chain in Cell Proliferation Is to Enable Aspartate Synthesis. Cell 162, 540–551 (2015). [DOI] [PMC free article] [PubMed] [Google Scholar]
- 65.Latasa MJ, Moon YS, Kim KH & Sul HS Nutritional regulation of the fatty acid synthase promoter in vivo: sterol regulatory element binding protein functions through an upstream region containing a sterol regulatory element. Proc Natl Acad Sci USA 97, 10619–10624 (2000). [DOI] [PMC free article] [PubMed] [Google Scholar]
- 66.Lewis CA et al. SREBP maintains lipid biosynthesis and viability of cancer cells under lipid- and oxygen-deprived conditions and defines a gene signature associated with poor survival in glioblastoma multiforme. 34, 5128–5140 (2015). [DOI] [PubMed] [Google Scholar]
- 67.Roche TE & Hiromasa Y Pyruvate dehydrogenase kinase regulatory mechanisms and inhibition in treating diabetes, heart ischemia, and cancer. Cellular and Molecular Life Sciences 64, 830 (2007). [DOI] [PMC free article] [PubMed] [Google Scholar]
- 68.Comerford SA et al. Acetate Dependence of Tumors. Cell 159, 1591–1602 (2014). [DOI] [PMC free article] [PubMed] [Google Scholar]
- 69.Mashimo T et al. Acetate Is a Bioenergetic Substrate for Human Glioblastoma and Brain Metastases. Cell 159, 1603–1614 (2014). [DOI] [PMC free article] [PubMed] [Google Scholar]
- 70.Schug ZT et al. Acetyl-CoA synthetase 2 promotes acetate utilization and maintains cancer cell growth under metabolic stress. Cancer Cell 27, 57–71 (2015). [DOI] [PMC free article] [PubMed] [Google Scholar]
- 71.Bulusu V et al. Acetate Recapturing by Nuclear Acetyl-CoA Synthetase 2 Prevents Loss of Histone Acetylation during Oxygen and Serum Limitation. Cell Reports 18, 647–658 (2017). [DOI] [PMC free article] [PubMed] [Google Scholar]
- 72.Liu X et al. Acetate Production from Glucose and Coupling to Mitochondrial Metabolism in Mammals. Cell 175, 502–513.e13 (2018). [DOI] [PMC free article] [PubMed] [Google Scholar]
- 73.Röhrig F & Schulze A The multifaceted roles of fatty acid synthesis in cancer. Nature Reviews Cancer 16, 732–749 (2016). [DOI] [PubMed] [Google Scholar]
- 74.Jones ME, Lipmann F, Hilz H & Lynen F On the enzymatic mechanism of Coenzyme A acetylation with adenosine triphosphate and acetate. J. Am. Chem. Soc. 75, 3285–3286 (1953). [Google Scholar]
- 75.Kanehisa M & Goto S KEGG: Kyoto Encyclopedia of Genes and Genomes. Nucleic Acids Res. 28, 27–30 (2000). [DOI] [PMC free article] [PubMed] [Google Scholar]
- 76.Mense SM et al. Gene expression profiling reveals the profound upregulation of hypoxia-responsive genes in primary human astrocytes. Physiological Genomics 25, 435–449 (2006). [DOI] [PubMed] [Google Scholar]
- 77.Horton JD, Goldstein JL & Brown MS SREBPs: activators of the complete program of cholesterol and fatty acid synthesis in the liver. J Clin Invest 109, 1125–1131 (2002). [DOI] [PMC free article] [PubMed] [Google Scholar]
- 78.Santos CR & Schulze A Lipid metabolism in cancer. FEBS Journal 279, 2610–2623 (2012). [DOI] [PubMed] [Google Scholar]
- 79.Davidson SM et al. Environment Impacts the Metabolic Dependencies of Ras-Driven Non-Small Cell Lung Cancer. Cell Metabolism 23, 517–528 (2016). [DOI] [PMC free article] [PubMed] [Google Scholar]
- 80.Davidson SM et al. Direct evidence for cancer-cell-autonomous extracellular protein catabolism in pancreatic tumors. Nat Med 23, 235–241 (2017). [DOI] [PMC free article] [PubMed] [Google Scholar]
- 81.Sullivan MR et al. Increased Serine Synthesis Provides an Advantage for Tumors Arising in Tissues Where Serine Levels Are Limiting. Cell Metabolism 29, 1410–1421.e4 (2019). [DOI] [PMC free article] [PubMed] [Google Scholar]
- 82.Savino AM et al. Metabolic adaptation of acute lymphoblastic leukemia to the central nervous system microenvironment depends on stearoyl-CoA desaturase. Nature Cancer 1, 998–1009 (2020). [DOI] [PMC free article] [PubMed] [Google Scholar]
- 83.Jin X et al. A metastasis map of human cancer cell lines. Nature 588, 331–336 (2020). [DOI] [PMC free article] [PubMed] [Google Scholar]
- 84.Maddocks ODK et al. Modulating the therapeutic response of tumours to dietary serine and glycine starvation. Nature 544, 372–376 (2017). [DOI] [PubMed] [Google Scholar]
- 85.Li L et al. Identification of DHODH as a therapeutic target in small cell lung cancer. Science Translational Medicine 11, eaaw7852 (2019). [DOI] [PMC free article] [PubMed] [Google Scholar]
- 86.Sousa CM et al. Pancreatic stellate cells support tumour metabolism through autophagic alanine secretion. Nature 536, 479–483 (2016). [DOI] [PMC free article] [PubMed] [Google Scholar]
- 87.Parker SJ et al. Selective Alanine Transporter Utilization Creates a Targetable Metabolic Niche in Pancreatic Cancer. Cancer Discov 10, 1018 (2020). [DOI] [PMC free article] [PubMed] [Google Scholar]
- 88.Hsueh EC et al. Deprivation of arginine by recombinant human arginase in prostate cancer cells. Journal of Hematology & Oncology 5, 17 (2012). [DOI] [PMC free article] [PubMed] [Google Scholar]
Methods References
- 1.Lewis CA et al. Tracing Compartmentalized NADPH Metabolism in the Cytosol and Mitochondria of Mammalian Cells. Mol. Cell 55, 253–263 (2014) [DOI] [PMC free article] [PubMed] [Google Scholar]
- 2.Gui DY et al. Environment Dictates Dependence on Mitochondrial Complex I for NAD+ and Aspartate Production and Determines Cancer Cell Sensitivity to Metformin. Cell Metabolism 24, 716–727 (2016). [DOI] [PMC free article] [PubMed] [Google Scholar]
Associated Data
This section collects any data citations, data availability statements, or supplementary materials included in this article.


