

Abstract
Large-section ultra-heavy steel plates feature low cooling rate of central part during quenching process, as well as great differences in texture and performance along thickness direction. Wet jet impingement quenching test apparatus and multi-channel temperature recorder were developed to explore the temperature drop characteristics and its influential factors of ultra-heavy steel plate. The temperature drop curves of plates with different thickness (160, 220, and 300 mm) and weight (23–43 tons) were recorded during the quenching process, accompanied with the exploration on distribution rules of temperature gradient, heat flux density and cooling rate along thickness direction under different water volumes (9000–9400 m3/h) and pressures (0.4–0.8 MPa), upon which the three-dimensional inverse heat conduction model, surface heat transfer coefficient model and thermophysical parameter model were established using finite element and optimization methods. The overall results indicate the symmetric heat transfer between the upper and lower plate surfaces can be realized, when the water flow ratios of the upper and lower surfaces were 1:1.25 and 1:1.4 under pressures of 0.8 MPa and 0.4 MPa, respectively. The “temperature return” phenomenon was accompanied with changing heat flux density of wall surface of 220 mm- and 300 mm-thick plates. The lowest cooling rate along thickness direction appeared at 1/4 thickness position for the 160 mm- and 220 mm- thick plates during quenching, which was attributable to the synergy between heat flux density and temperature gradient. This work may pave a way for improving the cooling rate and quenching uniformity of ultra-heavy steel plates along thickness direction.
Keywords: Ultra-heavy steel plates, large section, three-dimensional inverse heat conduction model, temperature drop, quenching
Introduction
Ultra-heavy steel plate with high toughness and large section constites the key material in major equipment manufacturing and main engineering construction. Heat treatment after rolling is of necessity to homogenize and refine the texture and improve roughness of steel plate, among which varied heating and cooling schedules were utilized to tailor plate texture and finally realize advanced performances.1–3 Currently, immersion quenching is generally applied for the quenching of ultra-heavy steel plate with thickness of 150–300 mm. However, the low cooling efficiency, poor homogeneity and uncontrollable cooling rate remain the bottleneck in terms of high-quality heat treatment of unltra-heavy steel plate.
Being different from other heat transfer patterns, the jet impingement water cooling based on roller quenching technology can realize large convective heat flux when the superheat degree of steel wall surface is high. Also, the heat flux density changes obviously along with the subtle variation of wall surface temperature.4,5 In this regard, it offers new pathway for high-strength and high-homogeniety quenching of ultra-heavy steel plate. Despite of these beneficial attributes, steel plates will be subjected to heating at 900°C–1000°C prior to roller quenching, the jet impingement quenchign process includes internal three-dimensional heat conduction, jet heat transfer in stagnation zone, nucleate-transition boiling heat transfer, film boiling heat transfer, and radiation heat transfer, etc. The intercoupled single-phase forced covection and boiling heat transfer generally lead to complicated heat exchange process. 6 Along with this, the surface heat transfer of steel plates is correlated with a diverse class of factors, such as jet velocity, jet diameter, jet angle, supercooling degree, and superheat degree of wall surface, which adds difficulty in tailoring the internal temperature field and temperature gradient of steel plates. 7 Therefore, it is of great necessity to investigate the factors that affect temperature field during quenching process of ultra-heavy steel plates and determine the evolution laws of cooling rate along thickness direction, upon which the prediction of quenching technological parameters and optimization of performances can be realized.
To date, experimental studies focused on jet impingement water cooling process of high-temperature steel plates are generally limited in transient or stable conditions, the relationship among surface heat flux density, heat transfer coefficient, jet parameters and processing parameters of thin steel plates (H ≤ 25 mm) have been investigated,4,8 accompanied with the measurement of Nu number distribution of wall surface under low Re value (Re ≤ 20,000) condition, as well as the establishment of numerical model.9,10 Lee et al. 11 investigated the surface heat transfer law of ANSI304 stainless steel (thickness: 20 mm) with double-circular holes during rapid jet cooling process, the heat flux density and wall surface temperature were calculated based on transient temperature variation. Using similar method and parameters, researchers 12 found that the aggregation of cooling water helped to reduce the momentum of jet impingement and further decrease surface heat flux density. The local boiling curve under stable condition was also recorded using the temperature control system designed by Agrawal et al., 13 who pointed out that supercooling degree and jet parameters exerted little impact on heat flux density, but affected maximum heat flow (MHF) obviously. Also, the evident effect of temperature gradient on MHF was revealed by Jahedi et al. 14
Along with the study on heat transfer of high-temperature steel plate under jet cooling, extensive efforts have also been devoted toward the relationship between surface heat transfer and internal heat conduction, upon which heat transfer model was established and temperature field was solved. The numerical model established on numerical simulation method was proposed to predict local surface temperature, heat flux density as well as surface temperature gradient of plate (H = 2 mm). 15 The inverse heat transfer and regularization methods with undesirable limitations were also previously designed, and the temperature-field analytical method gradually evolved into three-dimensional inverse heat transfer problems (IHTP) with the development of IHTP technology.16–20 However, this method generally requires a large number of measured temperature values and the establishment of objective functions to realize converged simulation of temperature field.21,22 In this regard, a diverse class of numerical methods, including finite difference method, FEM and finite volume method, were utilized to solve the internal temperature field of steel plates.4,5,23
As indicated by the above discussion, current studies on heat transfer of high-temperature steel plate during jet impingement quenching process mainly focus on small steel plate sample (H ≤ 25 mm, B ≤ 500 mm, L ≤ 500 mm), the temperature drop and surface heat transfer were determined by simple home-made test apparatus. The key issue is that both experimental methods and apparatus fail to satisfy the demands in the quenching and temperature-drop tests of large-section ultra-heavy steel plate (H = 150–300 mm), large deviation of experimental results were obtained, only. At least two issues should be well addressed to realize such goals. First, the width and length of test plate should be much larger than thickness to minimize the effect of lateral temperature drop on temperature field, so the quenching device with sufficiently large size, circulating water volume and jet pressure should be rationally designed, which is anticipated to realize continuously tailorable jet parameters and complete the test when combined with other facilities, such as high-power heating furnace and crown block. Second, the initial wall surface temperature of steel plate is higher than 900°C and quenching duration time is longer than 30 min. The micro-heater jet measurement method 24 and temperature oscillation IR thermography (TOIRT) method 25 are not suitable candidates for this situation, high-precision devices and methods with continuous temperature measurement of ultra-heavy plate should be developed. In addition, the difficulties in smelting and rolling of raw materials, as well as the deficiencies in mathematical models and solutions preclude in-depth investigation of heat transfer of ultra-heavy steel plate during quenching process.
In this work, the experimental apparatus of roller jet impingement quenching and multi-channel temperature recorder were specially developed for the continuous roller quenching experiment of ultra-heavy steel plate (H: 160–300 mm, B: 2.3 m, L: 8 m), upon which the temperature-drop curves at typical positions along thickness direction of surfaces and longitudinal sections in large-section ultra-heavy steel plate were obtained for the first time. Specifically, the jet water volume and pressure were dynamically regulated according to the dynamic temperature variation of wall surface, the variation laws of temperature field, temperature gradient and heat flux density under multi-row jet impingement condition were also well studied, three-dimensional non-steady heat conduction function for steel plate quenching was further established. The IHTP method was employed to calculate the temperature field of the zone along thickness direction out of temperature measurement point, accompanied with the comparison of cooling rates along thickness direction under different surface heat transfer conditions. In terms of the calculation in more details, three-dimensional FEM based on non-linear shape function was adopted in solving heat conduction function, while the solution of distribution function of heat transfer coefficient was completed with a method similar with Fi, the distribution function of heat flux density was solved using the optimization method based on Quasi-Newton method and BFGS algorithm. This work provides theoretical algorithm and experimental data for further study on the quenching rate and cooling homogeneity of ultra-heavy steel plate along thickness direction, which also provides efficient regulation method for improving the mechanical and operation properties of ultra-heavy steel plate.
Materials and methods
Experimental materials
The alloy steel plates after hot rolling were purchased from HBIS Group Co., Ltd, China. The chemical composition in weight percent is as follows: 0.14 C, 0.08 Si, 0.52 Mn, 0.006 P, 0.0006 S, 2.4 Cr, 1.07 Mo, 0.07 Ni, 0.04 Cu, Ceq = 0.932. Three steel plates with equal B (2300 mm) and equal L (8000 mm), but different H (160 mm, 220 mm, and 300 mm) were selected. The critical temperatures were determined as follows: Ac1: 766°C, Ac3: 860°C, Ms: 425°C, Mf: 210°C. Prior to test, the surface of plates was polished by 360-mesh abrasive paper, the measured surface roughness was 0.3 μm.
The YL-100AI bench drilling machine was utilized to drill on the side face of steel plates, the hole depth and diameter were 350 mm and 5.1 mm, respectively. The WRNK-191 sheathed thermocouple (Φ5 mm × 12000 mm, wire diameter: 0.8 mm) composed of NiCrSi-NiSiMg was inserted into the hole, the temperature measurement range was 0°C–1100°C (accuracy: ±1°C). The projective jacket of thermocouple with a wall thickness of 0.05 mm was made of 2520 stainless steel. Prior to inserting the thermocouple, the hole was filled with high-temperature thermally conductive adhesive (λ = 9.1 W/(m·K)) to reduce the thermal contact resistance between thermocouple and plate. The end part of plate was slotted, upon which the RAL-31-K temperature recorder can be placed, the lateral side was wrapped with refractory fiber. The temperature recorder was connected with thermocouple to record the real-time temperature of different temperature measurement points. The sampling period and measurement accuracy were 0.4 s and ±0.01°C, respectively. Temperature recorder was taken out after test and further connected to visualization terminal to record the data, the operation software was TrendReporter 7. The location of temperature measurement points in plates are shown in Figure 1. Note that the points from P1-1 to P1-5 aimed to measure the temperature of upper surface, upper 1/4 H, center, lower 1/4 H, and lower surface of plate head, respectively. While the points from P2-1 to P2-5 aimed to measure the temperature of upper surface, upper 1/4 H, center, lower 1/4 H, and lower surface of plate tail, respectively. The points P3-1 and P3-2 aimed to measure the temperature of upper 1/4 H and center of the middle part of plate.
Figure 1.

Location and layout of temperature measurement points of steel plate.
Experimental apparatus
The apparatus for roller quenching experiment of ultra-heavy steel plate is shown in Figure 2, the experimental layout is shown in Figure 3. The apparatus with a total length of 20 m was composed of high- and low-pressure water supply system, water supply pipe, control valves, jet nozzles, roller and transmission system, fixed-mobile frame and control center. The inlet side was high-pressure cooling zone (Zone I) with a length of 4 m, which consisted of four sets of symmetrically arranged slit jet nozzles. The jet water pressure and maximum jet water volume were 0.8 MPa and 4400 m3/h, respectively. The outlet side was low-pressure cooling zone (Zone II) with a length of 16 m, which consisted of 24 sets of longitudinally symmetrical arrangement of multi-row circular-hole jet nozzles. The jet water pressure and maximum jet water volume were 0.4 MPa and 5500 m3/h, respectively. Malinowski et al. 23 demonstrated that the interaction of water flow strengthened turbulence effect and multi-row jet nozzles were of higher heat transfer efficiency.The upper and lower surfaces of steel plate were individually collocated with a set of roller, which was alternatively arranged with nozzles. The lower roller was applied for transporting plate and the upper one was utilized to realize zonal flow control. The width and diameter of roller were 3.5 m and Φ400 mm, respectively. The velocity can be controlled within 1–40 m/min. The heat transfer forms of upper and lower surfaces during the quenching process were different. Specifically, the nucleate or film boiling heat transfer zone was formed by the coverage of residual water, in addition to the jet heat transfer of upper and lower surfaces. Due to the gravity effect that made the residual water fall, the lower surface only showed jet and radiation heat transfer. Therefore, the structure of jet nozzles and water flow density of upper and lower surfaces were differently designed to realize symmetric cooling. Tracking and positioning indicators were collocated at inlet and outlet to realize accurate tracking of plate locations (deviation < ±5 mm) within the experimental apparatus.
Figure 2.

The outlook of experimental apparatus: (a) steel plate released from furnace after heating, (b) during quenching experiment, and (c) after quenching experiment.
Figure 3.

Layout of quenching apparatus system. B: open and close valve; C: control valve; C-B Line: control and feedback cables; F: flowmeter; G: multi-row round-hole jet nozzle; H-W: high-pressure water supply system; L-W: low-pressure water supply system; P: pressure sensor; PCS: control center; R: roller; S: gap jet nozzle; W: water thermometer.
During quenching temperature-drop tests, cooling water was supplied by frequency-conversion water supply system, the temperature was determined using water thermometer and the water jet pressure was subjected to closed-loop control using electric control valve coupled with pressure sensor. The moving speed of plate was also under closed-loop control using roller frequency converter coupled with encoder. The control system consisting of SIEMENS S7-400 PLC and high-performance server can record real-time water temperature, water pressure and water volume, upon which the water jet parameters can also be accurately controlled when coupled with relevant devices. The control accuracy of water volume and water pressure were both determined to be ±1%, while the measurement accuracy of water temperature and control accuracy of roller speed were ±0.5°C and ±0.01 m/min, respectively.
Experimental procedures and parameters
After heating to processing temperature by external mechanized furnace, the experimental steel plates were transported onto roller bed via external mechanized arm (Figure 2(a)) and passed through zones I and II in sequence with a certain speed (Figure 2(b)), which was further subjected to swinging in zone II until the temperature was decreased to be lower than that of Mf point. The plates were finally exported from the experimental apparatus by roller (Figure 2(c)). The parameters including heating temperature (Th), heating time (th), moving speed (v), cooling time of quenching (tq), the water volume in zone I (WH), and zone II (WL), are shown in Table 1. During quenching experiment, these parameters can be dynamically displayed on visual interface of control center. A total of 3.24 × 10⁶ temperature points were collected during the tests.
Table 1.
Set values of experimental processing parameters.
| H (mm) | 160 | 220 | 300 |
|---|---|---|---|
| Th (°C) | 915 | 915 | 915 |
| th (min) | 403 | 476 | 742 |
| v (m/min) | 8 | 8 | 8 |
| tq (min) | 35 | 50 | 60 |
| WH (m3/h) | 4000 | 4200 | 4200 |
| WL (m3/h) | 5000 | 5200 | 5200 |
Based on the proposed calculation methods,6,26 the outflux speed (vN) of gap jet nozzles in high-pressure cooling zone and multi-row round-hole jet nozzles, water flow density (ρw) of jet impingement heat transfer zone, Re number of jet impingement and jet impingement speed of plate surface (vJ) can be obtained, which are displayed in Table 2.
Table 2.
Jet parameters of plate surface.
| Cooling zone | Gap jet nozzle (high pressure) | Multi-row round-hole nozzle (low pressure) |
|---|---|---|
| vN (m/s) | 23.2 | 14.8 |
| ρw (L/(m2·min)) | 6780 | 4650 |
| Re | 65,400 | 44,200 |
| vJ (m/s) | 23.05 | 14.91 |
Mathematical model
Heat conduction functions and equations in IHTP
Based on the real-time temperature-drop curves of temperature measurement points, the quenching temperature field of ultra-heavy steel plates can be calculated using IHTP combined with the differential function of heat conduction. In this work, three-dimensional non-steady heat conduction function which considered that the thermophysical parameters changed with temperature, is shown in equation (1). Note that complicated phase transformation would be involved during the quenching process, which is not the research focus in our work. Instead, the latent heat of phase transformation was incorporated into the average specific heat to establish heat conduction function with absence of internal heat source.
| (1) |
The third boundary condition in heat conduction function, that is, the heat transfer coefficient (HCP) of plate surface is known. The IHTP method covers the full thickness of steel plate, which is shown in Figure 4. Assuming that the lateral heat flux density was zero (actually, the later heat flux density was lower than 0.08% of that of upper and lower surfaces) and no heat exchange occurred within the upper half-H and lower half-H (completely symmetric cooling), the initial and boundary conditions can be expressed as follows:
Figure 4.

Calculated coordinates and boundary conditions in three-dimensional heat conduction issue during the quenching process of steel plates.
| (2) |
Due to the fact that the circulating water can be high up to 9000–9400 m3/h, the variation of water temperature produced by heat transfer can be neglected (the real-time water temperature increased by 0.3°C). The initial temperature field of steel plates prior to quenching can be determined according to real-time temperature-drop curves.
During the quenching process, the distribution of heat flux density at upper and lower surfaces can be obtained by solving the minimum value of objective function f(pi), which defines the difference between measured and calculated values of surface temperature, as shown in the following equation:
| (3) |
where can be obtained by the solving expression using FEM, which will be shown afterwards.
Based on IHTP and measured near-surface temperature of steel plates, the HTC distribution of upper and lower surfaces can be subjected to approximate calculation using cubic shape functions from serendipity family, which is:
| (4) |
As for the cubic unit, corner-node linear shape function can be expressed as follows 25 :
| (5) |
The edge-node linear shape function can be expressed as follows:
| (6) |
In equation (4), the function describes the variation of HTC of each unit node with a certain time period, which is:
| (7) |
where Wj is parabolic-spline function, pij is minimized parameter can be denoted by node HTC.
In equation (3), the minimum value of objective function f(pi) can be solved by Quasi-Newton Methods. Symmetric positive definite matrix which resembles Hesse Matrix can be obtained using BFGS algorithm, 27 in which the objective function value in equation (3) and its corresponding derivative were needed. Therefore, equation (3) can be converted into the following equation:
| (8) |
To terminate unconstrained optimization, the following rule was utilized to control the decrease of objective function value:
| (9) |
FEM for solving heat conduction function
The steel plate shown in Figure 4 is divided into eight node cubic units to further explore the heat conduction issue. The shape function Hi adopts Hermitain interpolation polynomial, upon which the internal temperature field of steel plate can be expressed as:
| (10) |
The integral form of equation (1) was obtained by Zienkiewicz and Taylor 28 :
| (11) |
For a certain unit, the matrix Aij and Bij as well as the vector Ci can be denoted as follows:
| (12) |
| (13) |
| (14) |
In equations (12)–(14), the Hermitain interpolation function which integrated node temperature and derivative can be shown as follows:
| (15) |
where is Gi is cubic spline function. Assuming that the temperature linearly varied with time within a minimum time period, the equation (11) can be simplified into linear system of equations using Galerkin integration scheme, which is:
| (16) |
The matrix A and B as well the vector C can be expressed by the above equation by choosing weight and shape function.
Models for thermophysical parameters
In this work, the variation tendencies of specific heat coefficient, heat conduction coefficient and density were subjected to real-time measurement to enhance the solving accuracy of three-dimensional heat conduction function. The specific heat test was completed with DSC-404-C differential scanning calorimeter (NETZSCH, Germany), the heat conduction coefficient test adopted LFA-447 laser thermal conductivity meter (NETZSCH, Germany). The JmatPro simulation software was utilized to determine the phase composition of test steel under different temperature, upon which the average density of test steel can be calculated according to the density of each phase. The fitting calculation equations for determining thermophysical parameters can be expressed as follows:
| (17) |
| (18) |
| (19) |
Results and discussion
Measured and calculated temperature drop curves
The IHTP method was utilized to calculate surface heat transfer coefficient based on the measured near-surface temperature of steel plates, upon which the temperature drop curves of temperature measurement points were calculated using FEM. Figure 5 shows the comparison diagram between calculated and measured temperature-drop curves of temperature measurement points P1-1, P1-2, and P1-3 (H = 300 mm). It was found that they were mutually anastomosed with a deviation less than 4%. As stated above, the measurement error mainly consisted of temperature measurement error using thermocouple (±1°C), the measurement error of jet parameters (±1%) and the error of plate position (±5 mm). As for model calculation, the error between calculated and measured values of thermophysical parameters was 0.5%, due to the use of fitting function. In addition, the FEM based on Hermitain interpolation polynomial shape function was utilized to solve the heat conduction function, while the FEM based on the cubic shape functions from serendipity family was utilized to obtain HTC, the discrete solution would bring about 1% error. Note that the lateral heat of phase transformation was incorporated into average specific heat to calculate the temperature field, there was a 1% error when calculating average specific heat, due to the non-simultaneous phase transformations of steel plates.
Figure 5.

Comparison between calculated and measured values of temperature-drop curves of plate quenching.
The HTC can be inversely calculated based on the temperature curve of plate surface. Due to the limited temperature measurement points on surface, the surface HTC would be much closer to measured value when the points were much closer to actual temperature measurement points, and eventually, more accurate calculation results of temperature field can be obtained. It is worthwhile to mention that the thickness zone along longitudinal section that was near to temperature measurement points constituted the main research focus in this work, the high accuracy indicates favorable calculated results for further analysis.
The temperature-drop curves of ultra-heavy steel plates with different H measured by using the processing parameters in Table 1 are displayed in Figure 6. For the center of the plates with H of 160, 220, and 300 mm that cooled down to 200°C, the quenching time were 13.9, 29.6, and 49.3 min, respectively. For the 160 mm-thick plate, the temperature drop of 1/4 H was generally faster than that of the center. When the temperature went below 500°C, the temperature drop curves of the two positions were basically the same. However, the surface temperature-drop curves significantly differed from that of 1/4 H and center. With increasing H to 220 and 300 mm, the difference of temperature-drop curves between 1/4 H and center got obviously increased. Ding et al. 29 pointed out that the variation of H would result in the gradient variation of center-surface temperature and therefore enlarged difference of temperature drop curves. Consequently, the temperature gradient of center-1/4 H zone exerted more significant impact on the temperature drop of plate center, this finding kept good consistence with the measured temperature drop curves in this work.
Figure 6.

Measured temperature-drop curves of ultra-heavy steel plates with a thickness of: (a) 160 mm, (b) 220 mm, and (c) 300 mm.
Analysis on “Temperature return”
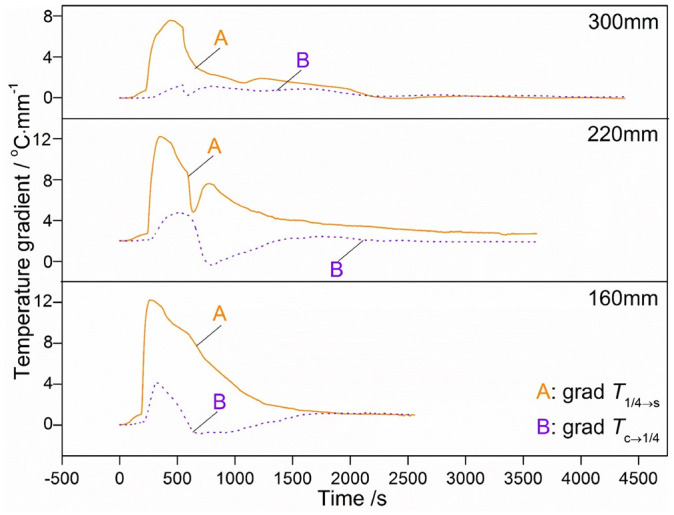
A comparison among Figure 6(a) to (c) reveals that when the steel plate entered from high-pressure cooling zone (zone I) into low-pressure cooling zone (zone II), the quenching temperature-drop curves of 220 mm- and 300 mm-thick plates featured “temperature return” phenomenon. Specifically, for 220 mm-thick plate, the temperature return of surface and 1/4 H were 102°C–196°C and 55°C–104°C, respectively. For 300 mm-thick plate, the temperature return of surface and 1/4 H were 150°C–250°C and ∼52°C, respectively. Note that no such return occurred in the center of the two plates. Figure 7 gives the distribution of temperature gradient within half-H of plate head when the plate entered from zone I into zone II. It was found that when the 160 mm-thick plate was cooled in zone I, grad T1/4→s would rapidly increase to 12°C/mm at first and maintained at this value, grad Tc→1/4 also rapidly increased to about 4°C/mm. These results indicate that the plate along thickness direction formed large temperature gradient due to the high cooling strength in zone I, thereby leading to obvious temperature at 1/4 H and center positions. After entering into zone II, both grad T1/4→s and grad Tc→1/4 maintained high value and decreased slowly, the temperature of plate surface continuously decreased, while conducted heat from center to 1/4 H and from 1/4 H to surface did not change with the varying forms of surface heat transfer, thus resulting into non-obvious “temperature return” phenomenon.
Figure 7.

Distribution of heat transfer forms of upper and lower surfaces during roller quenching process of ultra-heavy steel plates.
As for 220-mm thick plate, grad T1/4→s firstly increased and then continuously decreased when the plate was cooled in zone I, while grad Tc→1/4 gradually increased and maintained at ∼4°C/mm, implying that the MHF point along thickness direction gradually moved from 1/4 H-surface zone to center-1/4 H zone, and the temperature of 1/4 H was low (∼530°C). When entering into zone II, grad T1/4→s further decreased significantly, while grad Tc→1/4 still maintained at ∼4°C/mm for 50 s and then decreased significantly. Therefore, the heat within 1/4 H-surface zone rapidly conducted onto surface and showed “temperature return.” While the heat within center-1/4 H zone also conducted rapidly toward 1/4 H, thus making obvious “temperature return” of 1/4 H. As grad Tc→1/4 would maintain for 50 s and then decreased when the plate entered into zone II, it was found that the “temperature return” of 1/4 H (P1-2, P1-4, P2-2, P2-4, and P3-1) lagged behind that of surface (P1-1, P1-5, P2-1, and P2-5) when combined with Figure 6(b).
With increasing H to 300 mm, grad T1/4→s in zone I continuously increased and maintained at ∼7°C/mm, while grad Tc→1/4 increased gradually, indicating that the MHF point along thickness featured slow temperature drop within 1/4 H-surface and center-1/4 H zones, the temperature of 1/4 H was high (∼700°C). When entering into zone II, grad T1/4→s decreased significantly and continuously, grad T1/4→s also decreased accordingly, indicating that the heat flux density increased significantly within 1/4 H-surface zone, and the plate surface showed obvious “temperature return.” Also, the heat flux density within center-1/4 H increased and the 1/4 H also showed “temperature return.” According to law of conservation of energy, the center of plates with different H continuously deliver heat, and no “temperature return” occurred. Being identical with previous analysis, 14 “temperature return” was correlated with the varied surface heat flux density of plates with different H, as well as the varied position of MHF points induced by temperature gradient along thickness direction.
Distribution of surface heat transfer zones
Figure 8 shows the distribution of heat transfer zone of upper and lower surfaces during jet cooling process, the inclination angle of jet was set as 135°. According to our previous analysis 30 , that is, the cooling water with a certain speed (such as 20 m/s) ejected from nozzles, upon which jet stagnation points of upper surface formed jet impingement heat transfer zone (zone A) toward the bilateral expansion zone with a water flow width that was several folds of jet water. Specifically, zone A can be divided into free jet zone (zone A-1), stagnation zone (zone A-2), and adherent jet zone (zone A-3), based on the flow structure. The MHF density within zone A can be high up to 5 × 10⁷ W/m2. Along with the radial flow of cooling water, the fluid gradually transferred from laminar flow to turbulent one, the thickness of flow and thermal boundary layers increased accordingly. The cooling water near high-temperature wall surface was heated and started to boil, forming nucleate-transitional boiling zone with a narrow range (zone B). With increasing temperature of surface-stagnated water, stable steam membrane layer would form on high-temperature plate surface, upon which film boiling heat transfer zone (zone C) occurred. The boiling and vaporization of cooling water aggregated and formed discontinuous small liquid-state accumulation zone (zone D) on plate surface outside of zone C. The zone which was not covered by cooling water would form radiant heat transfer zone (zone E). As for the upper and lower surfaces of steel plate which were subjected to gravity of cooling water, the two sides of jet stagnation points formed asymmetric jet impingement heat transfer zone (zone A) and nucleate boiling zone with small range (zone B). To realize symmetric temperature drop of upper and lower surfaces, the water flow density and average heat flow density of the surfaces were adjusted to offset the temperature drop difference induced by the different heat transfer forms of two surfaces. The water flow density ratio of upper surface to lower surface was 1:1.25 in zone I and 1:1.4 in zone II. A comparison between the temperature-drop curves of upper and lower surfaces of plate head (P1-1/P1-5 and P2-1/P2-5) reveals that the curves in Figure 6 are almost overlapped, with an average temperature deviation lower than 12°C, favorable symmetry of temperature drop between upper and lower surfaces can also be found. It was further evaluated that the boiling heat transfer of upper surface in zone I accounted for about 25% of total heat transfer, which was about 40% in zone II.
Figure 8.

Temperature gradient in half-thickness zone of steel plates (temperature measurement point of plate head).
Effect of temperature gradient on temperature drop curves
Further analysis reveals that when the surface temperature measurement points of 220 mm-thick plates entered from zone I to zone II, the temperature drop curve would firstly show “platform” and then increased rapidly (as indicated by the temperature-drop curve of P1-1, P1-5, P2-1, and P2-5 in Figure 6(b)). For 300 mm-thick plate, however, the surface temperature drop curve showed no “platform.” Nobari et al. 31 pointed out that the superheat degree of wall surface affected the heat transfer form of jet cooling and further heat transfer efficiency. Combined with equations (1), (2), and Figure 7, it was acknowledged that the surface heat transfer coefficient can be high up to 25000 W/(m2°C) when the 220 mm-thick plate passed through zone I, continuous high-strength cooling gave rise to decreased superheat degree (<150°C), the ability of surface convection and heat transfer got weakened. Meanwhile, grad T1/4→s continuously decreased while grad Tc→1/4 continuously increased, thus resulting weakened heat conduction ability of 1/4 H-surface along thickness direction, and maintaining the equilibrium state between surface heat transfer and internal heat conduction, and finally, resulting in the “platform” of surface temperature drop curve. In contrast, T1/4→s decreased slowly when the 300 mm-thick plate passed through zone I, which made the internal heat of plate continuously deliver onto surface and the superheat degree of wall surface continuously decrease, no “platform” occurred in surface temperature drop curve. It is therefore deduced that continuous high-strength cooling (zone I) rendered large temperature gradient along thickness direction, while the ability of surface conduction and heat transfer got weakened with decreasing wall surface superheat degree. Subsequently, reasonable decrease of cooling strength (zone II) can increase the wall surface superheat degree and maintain large temperature gradient along thickness, which was beneficial for the temperature-drop within the center-1/4 H zone of ultra-heavy plate.
Heat flux density distribution
Figure 9 shows the distribution of heat flux density during the cooling process. As indicated by the identical curves between upper half-H and lower half-H, favorable cooling symmetry of upper and lower surfaces was obtained, which further verified the validity of the boundary condition in equation (2). It can be seen from Figure 8 that the distribution of jet heat transfer zone of the two surfaces were different, the upper surface mainly adopted the jet impingement heat transfer. To realize symmetric cooling, the water flow density of lower surface increased and conduction heat transfer coefficient increased accordingly, thus strengthening the ability of single-phase forced convection heat transfer and resulting in larger MHF value of lower surface which was ∼20% higher than that of upper surface.
Figure 9.

Heat flux density curves of steel plates during cooling process.
The “temperature return” phenomenon in temperature-drop curves of Figure 6(b) and (c) can also be explained by the curves of heat flux density. Specifically, according to Newton cooling law, the heat flux density of plate surface is correlated with the superheat degree of wall surface. Typically, when high-temperature plate contacted with jet cooling water, the large superheat degree of wall surface would make the heat flux density reach MHF value rapidly. Subsequently, the superheat degree of wall surface decreased and maintained at <150°C, and the surface heat flux density reached minimum value (MHF’). At this moment, grad T1/4 had already reached or exceeded maximum value. When the plate entered into zone II, the variation of water flux density destroyed the balance between wall surface heat transfer and internal heat conduction, making increased superheat degree and appearance of “temperature return.” The increase of surface heat flux density contributed to significantly decreased grad T1/4→s, which further resulted in obvious decrease of temperature at 1/4 H. Based on Fourier law, the internal heat flux density along thickness direction is related with temperature gradient, the obvious temperature drop at 1/4 H resulted in increased grad Tc→1/4, and the “temperature return” phenomenon also occurred at 1/4 H.
Cooling rate along thickness direction
Figure 10 shows the comparison of cooling rates along thickness direction of test plates between two temperature-drop zones (900°C–200°C and 900°C-Ms), the H was in inverse relationship with cooling rate at the same position. The difference of surface Cave within the two temperature-drop zones were obvious (>1°C/s), while only small difference of Cave was observed between 1/4 H and plate center. In addition, the Cmin appeared at 1/4 H instead of the center of the 160 mm- and 220 mm-thick plates, which, however, appeared at the center of 300 mm-thick plate. Figure 11 gives the variation of temperature gradient during the cooling process. Combined with above analysis, it was found that the rapid decrease of wall surface temperature resulted in rapid increase of grad T1/4→s when the 160 mm- and 220 mm-thick plates were cooled in zone I. When the superheat degree of wall surface decreased to low values, the surface heat flux density also decreased, grad T1/4→s showed rapid decrease and maintained low value for a long time, thus resulting the gradual decrease to 200°C of 1/4 H in the following long time. For example, the time for decreasing to 200°C was 2700 s for the 220 mm-thick plate cooled in zone II. Due to the cross-section effect along thickness direction, grad Tc→1/4 also increased accordingly, while the peak point lagged behind that of grad T1/4→s, thereby giving rise to the lagged appearance of MHF point of plate center when compared with that of 1/4 H, the time for the temperature of plate center that decreased to 200°C was shorter than that of 1/4 H, and finally, Cave was higher in the center. Note that when the plated entered from zone I to zone II, the “temperature return” phenomenon further increased Cave values of 1/4 H and center. As for the 300 mm-thick plate cooling in zone I, the rapid increase of grad T1/4→s temperature gradient contributed to the appearance of MHF point within 1/4 H-surface zone, the cooling rate of 1/4 H can maintain high value and the temperature of 1/4H position decreased continuously when the plate entered into zone II, despite of the continuous decrease of grad T1/4→s. In contrast, grad Tc→1/4 reached MHF point at 335 s and maintained at low value (<0.8°C/mm). The relatively slow decrease of central temperature resulted in the appearance of Cmin in plate center.
Figure 10.

Comparison diagram of cooling rates of steel plates under different temperature-drop stages.
Figure 11.
Temperature gradient curves of steel plates during the cooling process.
Texture and physical property of as-quenched plates
Figure 12 shows the comparison of texture and physical properties of 220 mm-thick plate after quenching. The tensile strength of test points along thickness direction fell in 838–855 MPa, highest value (855 MPa) was found in lower surface, while 1/4 H and 3/4 H showed lower values. The inset of Figure 12 displays the typical metallographic structure of upper surface (100% martensite), 1/4 H (70% martensite and 30% lath bainite), and center (85% martensite and 15% lath bainite). Combined with Figure 10, it was acknowledged that the cooling rate along thickness direction was in accordance with the performance of metallographic structure. Higher cooling rate resulted in higher tensile strength and hardness, as well as higher proportion of martensite within the texture. These results further verify the highest cooling rate of plate surface, and the cooling rate of center was slightly higher than that of 1/4 H position.
Figure 12.

Comparison of quenching texture and performance of steel plates along thickness direction.
Conclusions
In this work, the roller jet impingement quenching test apparatus and multi-channel temperature recorder were developed to fully investigate the quenching experiment of ultra-heavy steel plates (L = 8 mm, B = 2.3 m, H = 160–330 mm, and weight = 23,000–43,000 kg). The temperature-drop curves of 5 points at plate head, center and tail along thickness direction were recorded. The heat conduction model along thickness direction, surface heat transfer coefficient model and thermophysical parameter model were established based on IHTP method. The FEM and numerical analysis were employed to solve the above models, upon which the temperature field along thickness direction, heat flux density and temperature gradient of steel plates were calculated with a deviation less than 4%. The main conclusions are as follows:
The upper surface of ultra-heavy steel plate mainly comprised jet impingement heat transfer zone and boiling heat transfer zone, while the lower surface mainly consisted of jet impingement heat transfer zone. To realize symmetric cooling, the water flow density ratio of upper to lower surface in high-pressure cooling zone was determined to be 1:1.25, which was 1:1.4 in low-pressure cooling zone.
When entering from high-pressure to low-pressure cooling zone, “temperature return” occurred at the upper and lower surfaces as well as 1/4 H position of 220 mm- and 300 mm-thick plates, this finding was associated with the changed surface heat flux density, as well as the changed position of MHF point induced by varied temperature gradient along thickness direction.
The minimum cooling rate appeared at 1/4 H position instead of the center for the 160 mm- and 220 mm-thick plates, “temperature return” phenomenon occurred at upper and lower surfaces as well as 1/4 H position, as manifested by the texture and physical properties of steel plates. The reason lies in the fact that the changed superheat degree of wall surface resulted in varied surface heat flux density and affected the temperature gradient along thickness direction, which, in turn, affected the heat flux density. The synergetic effect of temperature gradient and heat flux density exerted impact on the temperature field during plate quenching.
To realize high-quality quenching of ultra-heavy steel plates, new quenching strategies featuring uniform heat transfer and high cooling rate are highly desired. In terms of microstructure and performance control, some dominant factors such as temperature drop and cooling uniformity are of great importance. In this work, the experimental results pave a way for improving the cooling rate of ultra-heavy steel plate and formulating optimized quenching strategy, which also provides important reference for optimizing texture and performance of ultra-heavy steel plate during thermal treatment, as well as quenching reduction.
Author biographies
Tianliang Fu, born in 1981, PhD, is a Professor and Doctoral Supervisor at Northeastern University. The main research field is the heat treatment technology of metal plate and strip.
Xiangtao Deng, born in 1983, PhD, is an associate professor at Northeastern University. The main research field is the microstructure and properties control of material.
Xiuhua Tian, born in 1993, is a doctoral candidate of Northeastern University. The main research field is heat transfer mechanism of plate quenching process.
Guohuai Liu, born in 1983, PhD, is an associate professor at Northeastern University. The main research field is the development of new materials.
Zhaodong Wang, born in 1968, PhD, is a Professor and Doctoral Supervisor at Northeastern University. The main research field is the material processing engineering.
Appendix
Nomenclature
Ac1 austenite formation temperature of test steel
Ac3 complete transformation temperature of austenite of test steel
Am heat conduction matrix
B plate width
Bm heat capacity matrix
Ceq carbon equivalent of test plate
Cave average cooling rate during quenching
Cmin minimum cooling rate during quenching
c(T) specific heat function of steel plate
CV thermal load vector
Fi cubic shape functions from serendipity family
FN number of as-formed functions, in this work, FN=64
f(pi) objective function defined by equation (1)
Gi cubic spline function
H plate thickness
grad T1/4→s average temperature gradient from 1/4 H to surface of steel plate
grad Tc→1/4 average temperature gradient from center part to 1/4 H of steel plate
Hi Hermitian shape function
h(y,z,τ) surface heat transfer coefficient of steel plate
KT number of time period
L plate length
Ms starting temperature of martensite transformation of test steel
Mf final temperature of martensite transformation of test steel
Np temperature number recorded at one temperature measuring point
Nt number of temperature measuring point
Pi function for the variation of heat transfer coefficient of node unit per unit time
pi minimization parameter
(x,y,z) heat flux density of steel plate within the plane
Se unit surface range
Ss state of boundary conditions, Ss=1 if conditions are known, otherwise Ss=0
T three-dimensional temperature field of steel plate
Th heating temperature of steel plate
th heating time of steel plate
Tm n calculated temperature of temperature measuring point m at time τn
Tem n measured temperature of temperature measuring point m at time τn
Tm unknown temperature at unit node
tq cooling time during quenching
Ts surface temperature of plate
Tw water temperature
V range of cubic unit
v moving velocity of steel plate
vJ jet impingement velocity
vN outflux velocity of circular nozzle
WH water volume of high-pressure cooling zone
Wj quadratic spline function
WL water volume of low-pressure cooling zone
x,y,z Cartesian coordinates
ε number of minimum value criterion, ε=1×e-10
ξ1, ξ2, ξ3 natural coordinates of cubic unit
ηx, ηy, ηz natural coordinates of Hermitain interpolation function
λ(T) heat conduction coefficient function of steel plate
ρ(T) density function of steel plate
ρw water flow density in jet impingement zone
τ time
ΔDave average derivative value of objective function
ΔTave average deviation between measured and calculated temperature
Φ initial temperature field of steel plate
Footnotes
The author(s) declared no potential conflicts of interest with respect to the research, authorship, and/or publication of this article.
Funding: The author(s) disclosed receipt of the following financial support for the research, authorship, and/or publication of this article: We acknowledge the financial support from National Key Research and Development Programs of China (Grant No.: 2016YFB0300600 and 2017YFB0305100) and Basic Research Funding for Major Scientific and Technological Programs of Northeastern University in China (Grant No.: N160708001).
ORCID iD: Tianliang Fu  https://orcid.org/0000-0003-1832-6220
References
- 1.Wei Y, Gaosheng L, Qingwu C. Effect of a novel gradient temperature rolling process on deformation, microstructure and mechanical properties of ultra heavy plate. J Mater Process Tech 2015; 217: 317–326. [Google Scholar]
- 2.Zhou T, Yu H, Wang SY. Microstructural characterization and mechanical properties across thickness of ultra-heavy steel plate. Steel Research Int 2017; 88: 1700132. [Google Scholar]
- 3.Liu BX, Wang S, Fang E, et al. Microstructure and mechanical properties of hot rolled stainless steel clad plate by heat treatment. Mater Chem Phys 2018; 216: 460–467. [Google Scholar]
- 4.Nobari AH, Prodanovic V, Militzer M. Heat transfer of a stationary steel plate during water jet impingement cooling. Int J Heat Mass Transf 2016; 101: 1138–1150. [Google Scholar]
- 5.Lam PAK, Prakash KA. Thermodynamic investigation and multi-objective optimization for jet impingement cooling system with Al2O3/water nanofluid. Energy Convers Manag 2016; 111: 38–56. [Google Scholar]
- 6.Agrawal C. Surface quenching by jet impingement-a review. Steel Res Int 2019; 90: 1800285. [Google Scholar]
- 7.Shukla AK, Dewan A. Flow and thermal characteristics of jet impingement: comprehensive review. Int J Heat Tech 2017; 35: 153–166. [Google Scholar]
- 8.Kulkarni GA, Nallathambi AK, Specht E. Eulerian steady state solution of boiling curve for impinging water jet on moving hot metal plate. Heat Mass Transf 2019; 55: 1819–1828. [Google Scholar]
- 9.Schuhler E, Lecordier B, Yon J, et al. Experimental investigation of a low Reynolds number flame jet impinging flat plates. Int J Heat Mass Transf 2020; 156: 119856. [Google Scholar]
- 10.Ligrani PM, Ren Z, Buzzard WC. Impingement jet array heat transfer with small-scale cylinder target surface roughness arrays. Int J Heat Mass Transf 2017; 107: 895–905. [Google Scholar]
- 11.Lee SG, Kaviany M, Lee J. Quench subcooled-jet impingement boiling: two interacting-jet enhancement. Int J Heat Mass Tranf 2018; 126: 1302–1314. [Google Scholar]
- 12.Karwa R. Heat transfer in condensing vapours and boiling liquids. In: Kumar A.(ed) Heat and mass transfer. Singapore: Springer, 2020, pp.931–965. [Google Scholar]
- 13.Agrawal C, Kumar R, Gupta A, et al. Determination of maximum surface heat flux during jet impingement surface quenching with a sharp edge nozzle. Steel Res Int 2018; 89: 1800113. [Google Scholar]
- 14.Jahedi M, Berntsson F, Wren J, et al. Transient inverse heat conduction problem of quenching a hollow cylinder by one row of water jets. Int J Heat Mass Tranf 2018, 117: 748–756. [Google Scholar]
- 15.Waldeck S, Woche H, Specht E, et al. Evaluation of heat transfer in quenching process with impinging liquid jets. Int J Therm Sci 2018; 134: 160–167. [Google Scholar]
- 16.Duda P. A general method for solving transient multidimensional inverse heat transfer problems. Int J Heat Mass Transf 2016; 93: 665–673. [Google Scholar]
- 17.Maciejewska B, Strak K, Piasecka M. The solution of a two-dimensional inverse heat transfer problem using two methods: The Trefftz method and the Beck method. Int J Numer Methods Heat Fluid Flow 2018; 28: 206–219. [Google Scholar]
- 18.Sun Y, He S. A meshless method based on the method of fundamental solution for three-dimensional inverse heat conduction problems. Int J Heat Mass Transf 2017; 108: 945–960. [Google Scholar]
- 19.Zhang B, Mei J, Cui M, et al. A general approach for solving three-dimensional transient nonlinear inverse heat conduction problems in irregular complex structures. Int J Heat Mass Transf 2019; 140: 909–917. [Google Scholar]
- 20.Mohebbi F, Sellier M. Estimation of thermal conductivity, heat transfer coefficient, and heat flux using a three dimensional inverse analysis. Int J Therm Sci 2016; 99: 258–270. [Google Scholar]
- 21.Chang CW, Liu CH, Wang CC. Review of computational schemes in inverse heat conduction problems. Smart Sci 2018; 6: 94–103. [Google Scholar]
- 22.Zhou JH, Zhang YW, Chen JK, et al. Inverse estimation of front surface temperature of a plate with laser heating and convection-radiation cooling. Int J Therm Sci 2012; 52: 22–30. [Google Scholar]
- 23.Malinowski Z, Telejko T, Hadała B. Dedicated three dimensional numerical models for the inverse determination of the heat flux and heat transfer coefficient distributions over the metal plate surface cooled by water. Int J Heat Mass Tranf 2014; 75: 347–361. [Google Scholar]
- 24.Vutha AK, Rozenfeld T, Shin JH, et al. Spatial temperature resolution in single-phase micro slot jet impingement cooling. Int J Heat Mass Transf 2018; 118: 720–733. [Google Scholar]
- 25.Ferrarini G, Bison P, Bortolin A, et al. Thermal response measurement of building insulating materials by infrared thermography. Energy Build 2016; 133: 559–564. [Google Scholar]
- 26.Choo K, Friedrich BK, Glaspell AW, et al. The influence of nozzle-to-plate spacing on heat transfer and fluid flow of submerged jet impingement. Int J Heat Mass Transf 2016; 97: 66–69. [Google Scholar]
- 27.Boggs PT, Byrd RH. Adaptive, limited-memory BFGS algorithms for unconstrained optimization. SIAM J Optim 2019; 29: 1282–1299. [Google Scholar]
- 28.Zienkiewicz OC, Taylor RL. The Finite Element Method. 5th ed. Oxford: Butterworth-Heinemann, 2000, pp.140. [Google Scholar]
- 29.Ding JG, Zhao Z, Jiao ZJ, et al. Central infiltrated performance of deformation in ultra-heavy plate rolling with large deformation resistance gradient. Appl Therm Eng 2016; 98: 29–38. [Google Scholar]
- 30.Fu TL, Wang ZD, Li Y, et al. The influential factor studies on the cooling rate of roller quenching for ultra heavy plate. Appl Therm Eng 2014; 70: 800–807. [Google Scholar]
- 31.Nobari AH, Prodanovic V, Militzer M. Heat transfer of a stationary steel plate during water jet impingement cooling. Int J Heat Mass Tranf 2016; 101: 1138–1150. [Google Scholar]