

Summary
Dietary components and metabolites have a profound impact on immunity and inflammation. Here, we investigated how sensing of cholesterol metabolite oxysterols by γδ T cells impacts their tissue residency and function. We show that dermal IL-17 producing γδ T (Tγδ17) cells essential for skin barrier homeostasis require oxysterols sensing through G protein receptor 183 (GPR183) for their development and inflammatory responses. Single-cell transcriptomics and murine reporter strains revealed that GPR183 on developing γδ thymocytes is needed for their maturation by sensing medullary thymic epithelial cell-derived oxysterols. In the skin, basal keratinocytes expressing the oxysterol enzyme cholesterol 25-hydroxylase (CH25H) maintain dermal Tγδ17 cells. Diet-driven increases in oxysterols exacerbate Tγδ17 cell-mediated psoriatic inflammation, dependent on GPR183 on γδ T cells. Hence, cholesterol-derived oxysterols control spatially distinct but biologically linked processes of thymic education and peripheral function of dermal T cells, implicating diet as a focal parameter of dermal Tγδ17 cells.
Introduction
Immunocytes in mucocutaneous barrier tissues have garnered increasing prominence as the first responders to infections, while also contributing to tissue homeostasis and organogenesis.1 The latter facet of tissue-resident lymphocytes is especially critical in early animal development and abnormalities have been proposed to contribute to child developmental defects ranging from behavioral alterations to immune hypersensitivity in diverse tissues.2–4 The skin, lung and gut are replete with non-conventional T cells: innate T cells and innate lymphoid cells (ILCs) that are preprogrammed for effector function preferentially populate barrier tissues and confer immediacy in responses to perturbations. This specialization contrasts to adaptive lymphocytes that differentiate into effector subsets days after encounter with pathogens. Moreover, to perform homeostatic maintenance in tissues, the mucosal immune system often senses non-pathogen derived products that reflect tissue health and metabolic states.5,6
Tissue-resident Type 3 cytokine (IL-17, IL-22) producing T cells are prototypic innate T cells that serve critical function in skin, lung, and adipose tissue homeostasis. One prominent T3L subset in mice is IL-17 producing γδ T cells (Vγ2TCR+ Tγδ17, Raulet nomenclature7) that originate from fetal progenitors and populate the dermis soon after birth.8 These neonatal Tγδ17 cells are essential to prevent adult-onset atopic dermatitis,9 but are also critical for driving inflammation in a widely utilized mouse model of psoriasis.10 How Tγδ17 cells, and other T3L (CD4+ Th17, ILC3, MAIT17, NKT17), populate specific non-lymphoid tissues to mediate context-dependent function remains unclear. Possible drivers of anatomical specificity of T3L are the two G protein-coupled receptors (GPCRs) CCR6 and GPR183 (also known as Ebi2) expressed on nearly all T3L in rodents11 and humans.12 While CCR6-CCL20 function in the extravasation of T cells from circulation is well established, Ccr6−/− Tγδ17 cells do not exhibit significant deficits in effector function in mouse models of psoriasis.13 GPR183 is critical for proper localization of many immune cells, including: tissue positioning of follicular B cells,14 Tfh clustering with activated dendritic cells,15 naive CD4 T cells intranodal localization,16 and ILC3-mediated colonic lymphoid microstructure formations.11 The ligand for GPR183 is the oxysterol 7α,25-hydroxycholesterol (HC) and its production is controlled by cholesterol 25-hydroxylase (CH25H).17 Cholesterol homeostasis impacts production of two cytokines that drive the activation of T3L, IL-2318,19 and IL-1, in dendritic cells (DCs) and macrophages,20 respectively.
Here we demonstrated that Tγδ17 cell development and skin localization proceed by sensing anatomical depots of oxysterols via GPR183. In the thymus, we showed that a specific subset of Sox4+Ch25h+ medullary thymic epithelial cells (mTECs) enforced maturation checkpoints to permit Tγδ17 cell homing to the dermis. Severity of skin inflammatory responses in humans is linked to diet with high fat content.3 In the skin, Tγδ17 cell-mediated psoriasis induction was regulated by Ch25h+ cells. Mice fed high cholesterol food experienced more severe psoriasis and this disease progression required GPR183-sufficient Tγδ17 cells. Hence, spatially discreet dietary cholesterol metabolites are the major determinant of skin innate T3L generation and function. The GRP183-oxysterol pathway emerges as the candidate mechanism underpinning high fat diet-induced aberrant tissue inflammation in humans.
Results
CCR6 and GPR183 are co-expressed on mature Tγδ17 thymocytes and required for their development.
To identify the earliest gene circuits that specify mucocutaneous tissue homing of γδ T cells, we performed single cell RNA-sequencing (scRNA-seq) analyses on developing γδTCR+ thymocytes. Unsupervised principal-component analysis (PCA), and t-stochastic neighbor embedding (tSNE) identified 7 clusters, to generate the three distinct effector subsets, Tγδ17, Type 1 cytokine secreting γδ T cells (Tγδ1) and dual IFNγ and IL-4 secreting γδTCR+ NKT cells (γδNKT) (Figures 1A and S1A). Most γδ thymocytes expressed Cd24 and Sox13 High Mobility Group transcription factor (HMG TF), markers of immaturity and γδ T cell lineage, respectively. At the immature stage, two bifurcating effectors subsets marked by RORγt and LEF1 were discerned (Figure 1B). RORγt regulates Il17 transcription and LEF1 HMG TF is linked to Tγδ1 programming.10,21 Similar to other T3L, mature Tγδ17 cells uniquely express Ccr6 and Gpr183 (Ebi2), with the expression of Gpr183 detected in some immature γδ thymocytes. Using a Gpr183 transcriptional reporter (Gpr183Egfp) model we verified Gpr183 and CCR6 co-expression patterns in mature Tγδ17 cells (Figures 1C, 1D). There are two Tγδ17 cell subtypes in mice: Vγ4+ (Vγ6 by the Tonegawa nomenclature) T cells that arise exclusively during fetal development and are functionally critical in several tissues,22 and neonatal-origin Vγ2+ T cells with non-redundant function in the skin and lung.9 Gpr183 and CCR6 coexpression was only observed in mature (CD24neg) Vγ2+ CD27neg thymocytes, and to a lesser extent, mature Vγ4+ (identified here as cells that do not stain with Ab to Vγ1.1 and Vγ2TCR, the two dominant subtypes in the thymus) cells, at all ages (Figures 1C and S1B). Expression of the scavenger receptor SCART2 is skewed to Vγ2+ Tγδ17 cells23 and nearly all mature SCART2+ (CD27neg) thymocytes coexpressed Gpr183 and CCR6. Among αβ T cell lineage thymocytes, there was virtually no CCR6 expression, and most did not transcribe Gpr183, with only the mature CD4+ thymocytes being the exception (Figure S1C). In the skin, nearly all dermal Vγ2+, and majority of Vγ4+, Tγδ17 cells co-expressed Gpr183 and CCR6, while Vγ3+ dendritic epidermal T cells (DETCs) did not express either marker (Figures 1D and S1D). None of dermal αβTCR+ T3L24 showed the homogeneous dual Gpr183 and CCR6 expression pattern (Figure S1D).
Figure 1. Intrathymic programming of Ccr6 and Gpr183 coexpression on mature Tγδ17 thymocytes.
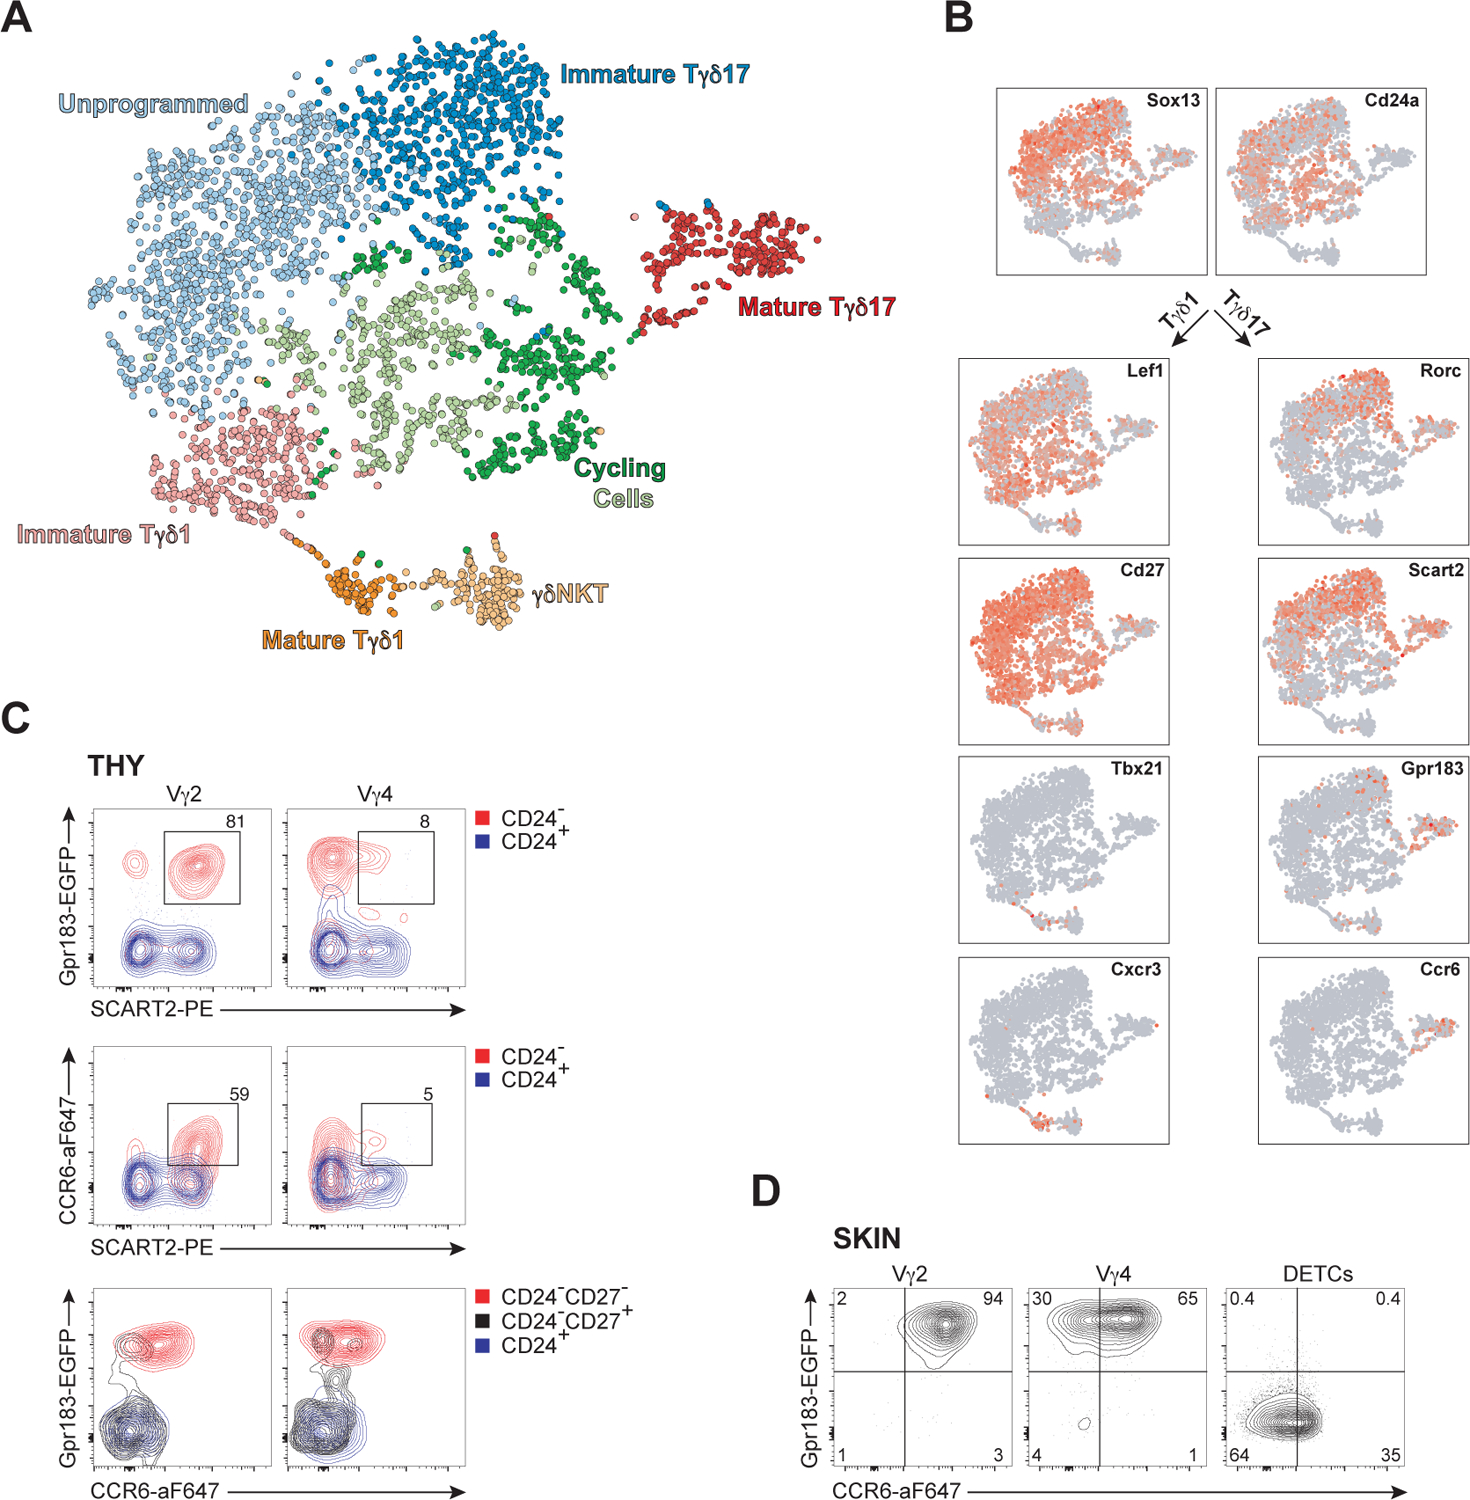
(A) Two-dimensional tSNE graphical representation of 3,749 single TCRδ+ thymocytes sorted from 12 day old mice (n=7), clustered into seven color-coded TCRδ+ developmental intermediates.
(B)Feature plots of distribution of cells expressing select signature genes of Tγδ17 and Tγδ1 subtypes, superimposed onto the two-dimensional graphs.
(C)Representative flow cytometric contour plots depicting expression of Gpr183, CCR6, and SCART2 on immature (CD24+, blue) and mature (CD24−, red) Tγδ17 thymocytes (CD27neg at the mature stage) from Gpr183 reporter mice.
(D) Representative flow cytometric analysis of expression amounts of Gpr183 and CCR6 of skin γδ T subsets distinguished by TCRγ chain (DETCs express Vγ3TCR) from Gpr183 reporter mice.
Data in (C-D) are representative of at least three independent experiments.
CCR6 contributes to immunocyte migration to skin25 but it is reported to be not essential for skin γδ T cells.13,26 Function of GPR183 on skin T cells is unknown. We generated Gpr183−/−Ccr6−/− double gene knock-out (DKO) mice to determine contributions of each GPCR to dermal T cell localization. In the skin, there were no significant differences in total lymphoid cellularity, and γδ DETCs and αβ T cell subset distributions in all genotype combinations assessed were unaltered (Figures 2 and S2A). In sharp contrast, neonatal-origin Tγδ17 cells were severely depleted in the skin of DKO mice (Figures 2A, 2B and 2C). While compound heterozygotes had diminished or comparable neonatal Tγδ17 cell frequency relative to Gpr183/- or Ccr6−/− mice, respectively (Figures S2B and S2C), only double deficiency virtually abolished these cells in the skin. That the loss of dermal Vγ2+ Tγδ17 cells was not primarily caused by a block in transit from LNs to the skin was suggested by the specific paucity of IL-17+ Vγ2+ T cells already in skin draining LNs (sLNs) of DKO mice (Figures 2D, 2E and 2F). Moreover, the defect in Vγ2+ Tγδ17 cell maturation was precociously evident in the thymus of DKO mice, where mature, but not immature, Vγ2+ Tγδ17 thymocytes were significantly depleted (Figures 2G and 2H), while all other thymocyte subsets were phenotypically and numerically in the normal range (Figure S2D), as previously shown also for Gpr183−/− or Ccr6−/− mice.27 The maturation-deficit in Tγδ17 cells was not observed in compound heterozygotes (Figure S2E). Thus, while either GPR183 or CCR6 is sufficient for Vγ2+ Tγδ17 cell production, their concomitant absence is not permissive for Tγδ17 cell terminal maturation in the thymus.
Figure 2. CCR6 and GPR183 are required for dermal Vγ2+ Tγδ17 cell production in the thymus.
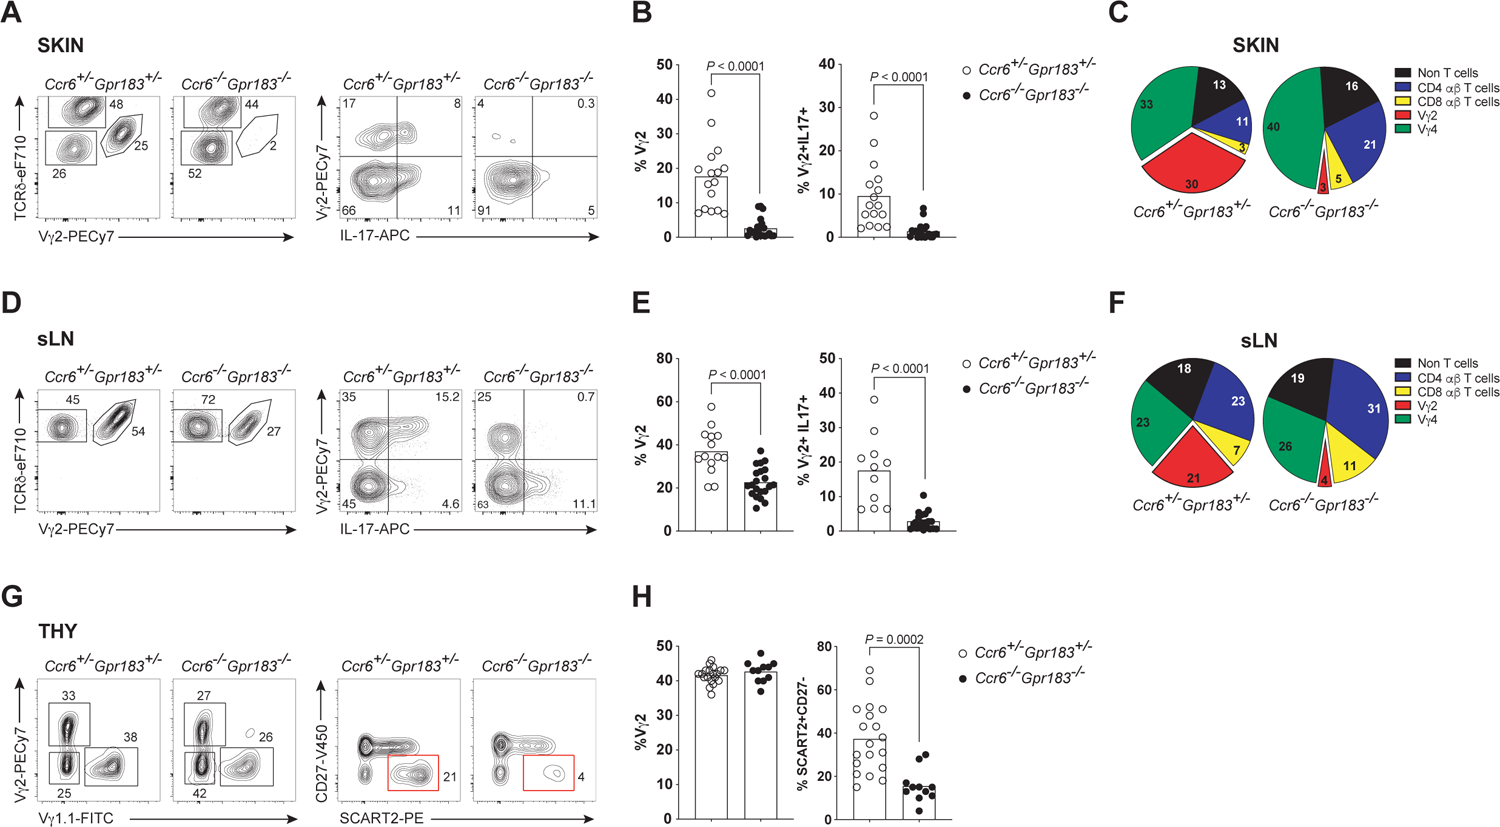
(A) Representative flow cytometric plots of γδTCR+ subsets (left) and intracellular IL-17 (right) expression amongst γδ T cells in the skin of adult Ccr6+/−Gpr183+/− compound heterozygotes and Ccr6−/−Gpr183−/− DKO mice. TCRδhiVγ2TCRneg cells are DETCs.
(B) Summary of the compiled flow cytometric data of A (n≥11 mice per genotype). P values determined by unpaired t-test.
(C) Pie charts showing the frequencies of different T cell subsets making up IL-17+ skin cells of compound heterozygotes and DKO mice analyzed in A.
(D-F) Corresponding sets of data from sLN.
(G) Representative flow cytometric plots of γδTCR+ thymic subsets (left; Vγ2−Vγ1.1− cells are mostly Vγ4TCR+) and Vγ2TCR+ thymocytes distinguished by CD27 and SCART2 expression (right; red box indicates mature Tγδ17 thymocytes) in adult compound heterozygotes and DKO mice.
(H) Summary of the compiled flow cytometric data as in G (n≥11 mice per genotype).i
Data in (A-H) are representative of at least three independent experiments.
In addition to 7α,25-HC whose production relies on CH25H, GPR183 can also recognize 7α,27-HC (Figure S2F), an oxysterol produced by the enzyme CYP27A1,17 albeit with lower potency. Therefore, to test whether CH25H plays a dominant role in producing the GPR183 ligand required for Tγδ17 cells, we generated mice lacking both CCR6 and CH25H. In these animals, Vγ2+ Tγδ17 cells were depleted in the skin and sLNs and phenocopied Ccr6−/−Gpr183−/− DKO mice (Figures S2G and S2H). In the thymus of Ccr6−/−Ch25h−/− mice, mature Vγ2+ Tγδ17 cell production was significantly impaired, but not blocked (Figure S2I). These results suggest that while CH25H is the dominant enzyme involved in the generation of GPR183 ligand that assures proper maintenance of Tγδ17 cells extrathymically, CYP27A1 may partly compensate for the loss of CH25H in the thymus.
A subset of medullary thymic epithelial cells expresses Ch25h to position Tγδ17 thymocytes
The block in the generation of mature Tγδ17 thymocytes in DKO mice unexpectedly suggests that coordinated sensing of oxysterols and CCL20 in the thymus is a prerequisite for proper maturation and egress to peripheral tissues. Normal thymic epithelial cells (TECs) are required for Vγ2+ Tγδ17 cell development.28,29 While CCL20 is produced by several types of mTECs and oxysterols are detectable in thymus extracts,30 the cellular source of thymic GPR183 ligand is unknown. To establish the spatial organization of oxysterol production during Tγδ17 development, we generated a tdTom reporter mouse line that tracks the transcriptional activity of Ch25h, encoding for the key enzyme to generate 7α,25-HC.
In Ch25h-tdTom mice the reporter expressing cells were restricted to the medulla, with virtually no expression in the cortex (Figure 3A). This pattern was observed in all ages tested (Figure 3B). Aire expression (marking mTEC2, nomenclature based on31) was excluded from Ch25h+ cells (Figure 3B), while Ccl21 (CCR7 ligand) expression was coincident (Figure 3C). In comparison, Ccl20 expression was widespread in mTECs (Figure 3C). We extended these findings with scRNAseq analyses of thymic epithelial subsets (Figures 3D and S3). There exists a unique cluster of Ch25h expressing mTECs that belonged to Ccl21+ mTEC1.32 Some of these Ch25h+ mTECs also expressed Cyp7b1 and other enzymes in the sterol synthesis pathway, but not Hsd3b7, a dehydrogenase that inactivates GPR183 ligand to generate bile acid precursors, as illustrated by a transcriptome heatmap (Figure 3D) and feature plots of expression of select signature genes of TEC subsets and sterol biosynthetic pathway (Figures S3A, S3B, S3C and S3D), with additional verification of expression of key genes by RT-qPCR (Figure S3E). Ch25h was not detected in Aire+ mTEC2 and Il25+ mTEC4,31,33 which mediate tolerance induction to tissue antigens and promote the development of Type 2 cytokine producing innate-like thymocytes, respectively (Figures 3D, S3A, S3B and S3C). Human thymus sc transcriptome public database indicates a homologous Ch25h expression pattern in human TECs,34 suggesting that the thymic oxysterol niche is conserved in mammalian evolution.
Figure 3. Ch25h+ mTEC1 constitutes the oxysterol thymic niche for Tγδ17 cell maturation.
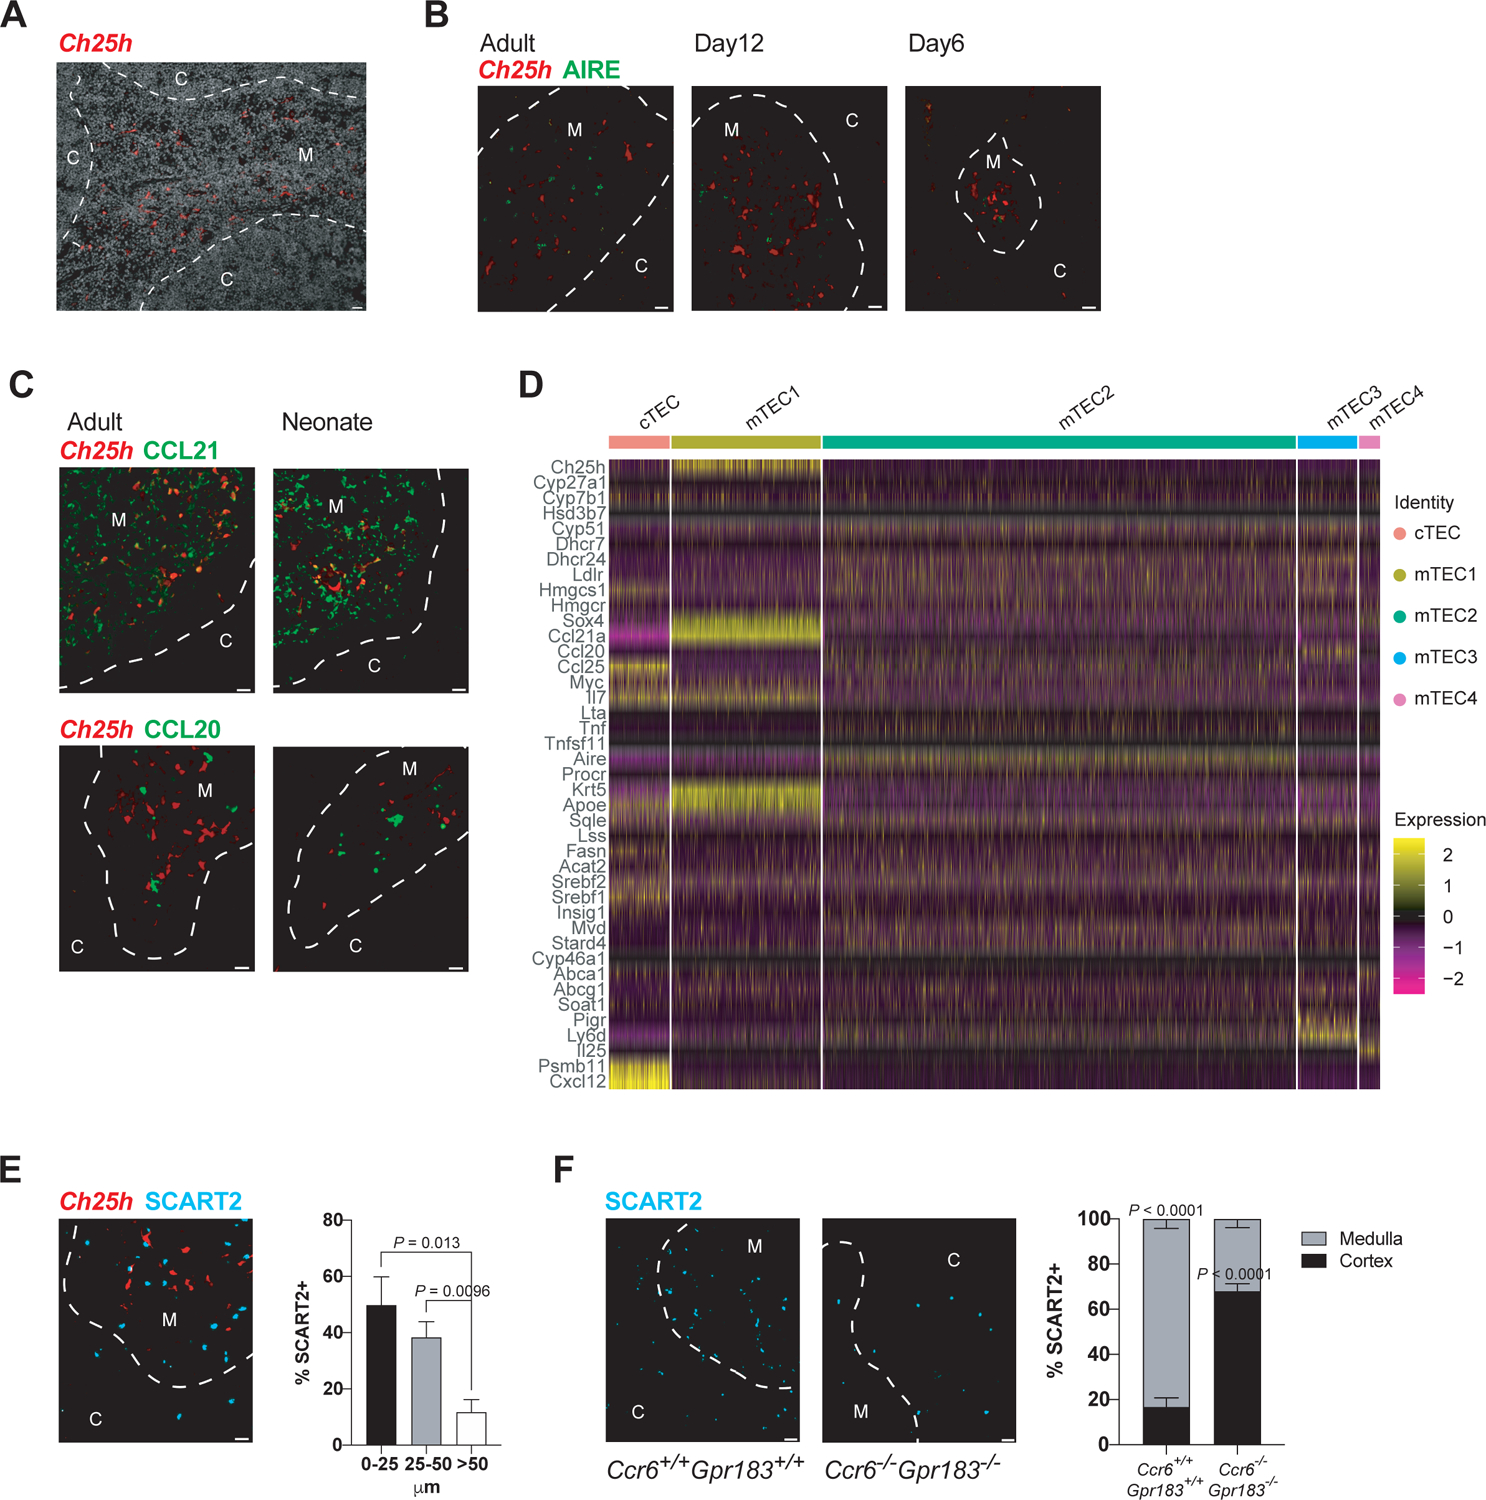
(A) Representative immunofluorescence (IF) image (from 5 experiments) of adult Ch25h reporter thymus stained with anti-RFP Ab (red, capturing tdTom expression). M, medulla; C, cortex. Dashed white line demarcates cortico-medullary junction. Scale bar is 20 μm throughout.
(B-C) Representative IF images (from 5 experiments) of adult and neonatal Ch25h reporter thymi stained with anti-RFP (red) and anti-AIRE (green) Abs and corresponding zoom-in details (B); with anti-CCL21 Ab (green, top row) and with anti-CCL20 Ab (green, bottom row) (C).
(D) Heatmap showing differential single cTEC and mTEC expression of select signature genes of TEC subsets and genes in the sterol metabolic pathway. Color bars (top) represent identities of five distinct TEC subsets.
(E) Representative IF image (from 5 experiments) of Ch25h reporter thymus stained with anti-RFP (red) and anti-SCART2 (blue) Abs. The distance of SCART2-expressing cells from Ch25h-expressing cells was measured using ImageJ, and percentage of SCART2-expressing cells between 0–25, 25–50, and >50μM distance was plotted (≥350 cells analyzed; P values determined by unpaired t-test).
(F) Representative IF images (from 3 experiments) of SCART2-expressing cells in adult WT and DKO thymi stained with anti-SCART2 Ab (blue). Frequencies of SCART2-expressing cells localized in the medulla or the cortex are recorded for both genotypes (≥300 cells per genotype analyzed; P values determined by unpaired t-test).
Data in (A-C and E-F) are representative of at least 3 independent experiments.
To visualize the homeostatic positioning of Tγδ17 cells in the thymus, we stained thymi from Ch25h-tdTom mice with Abs to γδTCR and the unique marker of Vγ2+ Tγδ17 cells SCART2. Maturing SCART2+ Tγδ17 cells were seen at the cortical medullary junction and in the medulla, with ~90% of SCART2+ cells within 50um of Ch25h+ mTECs (Figure 3E). We next analyzed the positioning of Vγ2+ Tγδ17 cells in the thymus of DKO mice. While Tγδ17 cells in the thymi of WT mice were primarily observed at the cortical medullary junction and in the medulla, in DKO thymi SCART2+ Tγδ17 cells were mainly localized in the cortex, at considerable distance from the cortical medullary junction (Figure 3F). These results demonstrates that the thymus contains epithelial depots of oxysterols, required for normal positioning of developing Tγδ17 cells at the medulla. The coincident inability to sense 7α,25-HC and CCL20 disrupts Tγδ17 positioning and maturation.
Sox4 in TEC controls Tγδ17 thymocyte development
To determine whether Ch25h+ mTECs are specifically required for Tγδ17 cell development necessitated the identification of a factor regulating their development or maintenance. Survey of all significantly expressed TFs (570) in the TEC scRNAseq datasets identified SOX4,10,21 a TF involved in various lymphocyte developmental processes, with well-defined function in innate T3L development, as enriched in Ch25h+ mTEC (Figures 3D and S3F). To determine whether Ch25h-expressing cells were also expressing Sox4, we generated double reporter mice (Ch25htdTom;Sox4Egfp). Analysis of thymus revealed that all the Ch25h+ mTEC also expressed Gfp, with minimal Gfp expression in other TEC subsets (Figure 4A), including Aire+ mTEC2, in line with the scRNAseq data.
Figure 4. Sox4 expressing TECs control Tγδ17 thymic development.
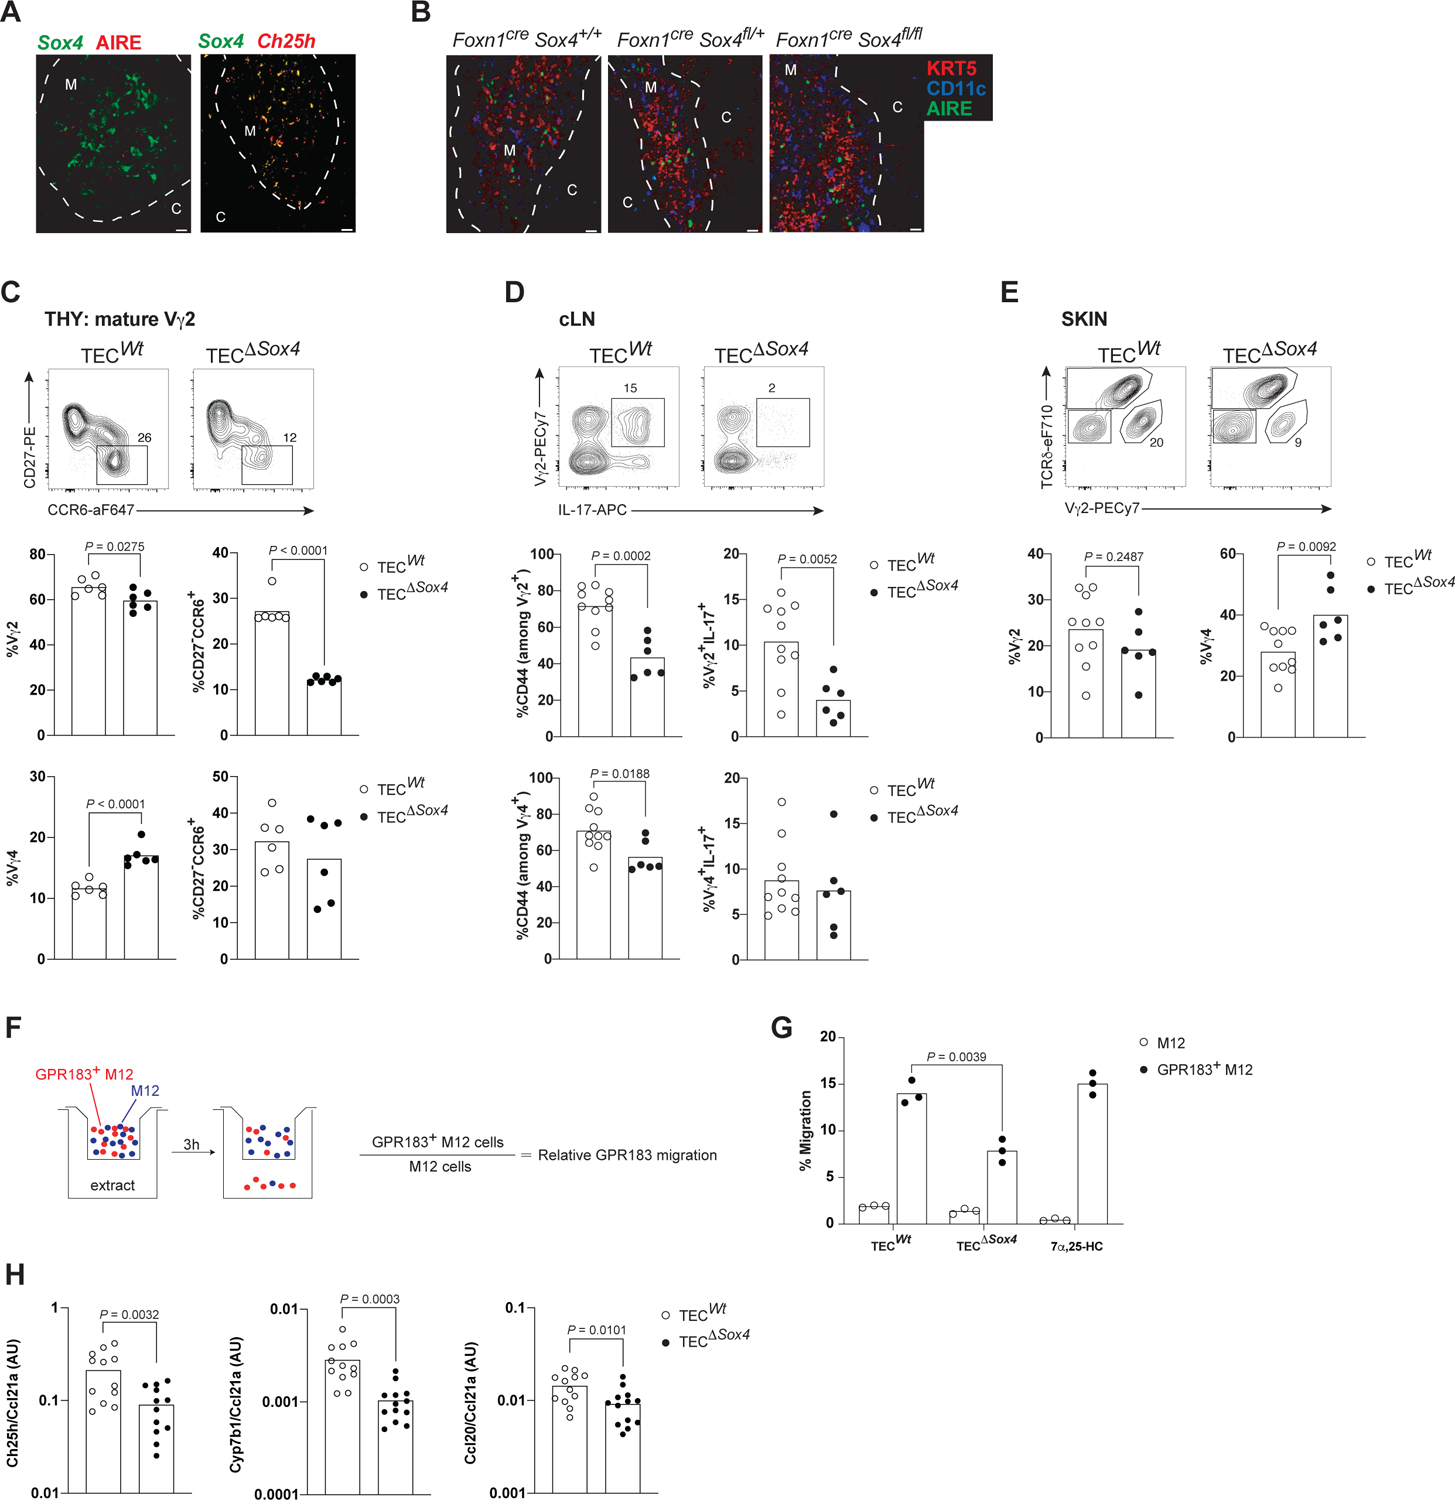
(A) Representative IF images (from 3 experiments) of adult Sox4 reporter thymus stained with stained with anti-GFP (green, Sox4 expression proxy) and anti-AIRE (red) Abs (left image), juxtaposed to a representative image (from 2 experiments) of adult Sox4-Ch25h double reporter thymus stained with anti-GFP (green) and anti-RFP (red, Ch25h expression proxy) Abs (right image). Dashed white line demarcates cortico-medullary junction. Scale bar is 20 μm throughout.
(B) Representative IF images of adult Foxn1creSox4+/+ (TECWt), Foxn1creSox4fl/+ and Foxn1creSox4fl/fl (TECΔSox4) thymi stained with anti-KRT5 (red), anti-CD11c (blue) and anti-AIRE (green) Abs.
(C) Representative flow cytometric plots of CCR6 and CD27 expression on mature Vγ2TCR+ thymocytes from 10-day old TECWT and TECΔSox4 thymi (top row). Summary of the compiled frequencies of Vγ2TCR+ cells amongst total γδTCR+ thymocytes and Vγ2+ Tγδ17 cells amongst total mature Vγ2TCR+ thymocytes in mice of indicated genotypes (middle row). Corresponding summary for Vγ4TCR+ cell frequencies (bottom row) with n≥5 mice per genotype.
(D) Representative intracellular staining for IL-17 amongst Vγ2TCR+ cells from adult TECWt and TECΔSox4 cervical LNs (top row). Summary of the compiled frequencies of activated (CD44+) cells amongst Vγ2TCR+ cells and Vγ2+IL17+ cells amongst total γδ T cells (middle row). All thymus-programmed Tγδ17 cells are CD44+ in LNs. Corresponding summary for Vγ4TCR+ cell frequencies (bottom row). n≥6 mice per genotype.
(E) Representative flow plots of γδ T cell subsets from adult TECWT and TECΔSox4 ear skin (top row). Summary of the compiled frequencies of dermal Vγ2TCR+ and Vγ4TCR+ cells in the skin (bottom row) with n≥6 mice per genotype.
(F) Schematic for GPR183-mediated transwell migration assay.
(G) Relative migration efficiency of GPR183+ cells to adult TECWt and TECΔSox4 thymic extracts (n=3 mice/condition). 100nM of 7α,25-HC was used as the positive control.
(H) Thymic expression analysis of indicated genes of TECWT and TECΔSox4 mice by RT-qPCR normalized to mTEC1 specific gene Ccl21a (n=12 mice per genotype). P values determined by unpaired t-test.
Data in (A-H) are representative of at least 3 independent experiments. P values determined by unpaired t-test (all, except H) or by two-way ANOVA (H).
To assess epithelial Sox4 function on Tγδ17 development, we generated Foxn1Cre;Sox4fl/fl (TECΔSox4) mice that lack Sox4 in epithelial cells in the thymus (Figure S4A). Gross thymic architecture was maintained and αβ thymocytes developed normally in TECΔSox4 mice (Figure 4B, S4B and S4C). In sharp contrast, there were reductions in the numbers and proportions of Vγ2+ Tγδ17 cells in the thymus, sLN and skin (Figures 4D, 4C and 4E). The thymic alterations in Tγδ17 cells were age-dependent, more pronounced in neonates. Vγ2+ and Vγ4+ cells were differently affected (Figure 4C), with only the maturation of Vγ2+ Tγδ17 cells impaired. In adults (>8 wks old), defects in Vγ2+ Tγδ17 cells persisted in peripheral tissues including skin (Figures 4D and 4E), however accumulation of CCR6+ Vγ2+ T cells in the thymus of TECΔSox4 normalized (Figure S4D). To determine whether oxysterol production was perturbed in TECΔSox4 mice, we first performed the GPR183-mediated transwell migration assay with test cells that were transduced with Gpr183 expression vectors30 (Figure 4F) and thymic extracts from WT and TECΔSox4 mice. Direct quantitation of oxysterols in mouse tissues is not technically feasible due to the amount of tissue required.17 The in vitro migration assay is extensively used as specific and sensitive approach to measure GPR183 ligands.30 This bioassay showed a reduced migration of test cells to extracts from TECΔSox4 mice and indicated that they contained diminished amounts of GPR183 ligands (Figure 4G). Expression analysis of Ch25h and Cyp7b1 showed that thymus from TECΔSox4 mice had less transcripts (Figures 4H and S4E). In comparison, expression of the chemokines Ccl21a and Ccl20 were only marginally altered with the loss of Sox4 in TECs, further confirmed using immunofluorescence assays (Figures S4E and S4F). Together, these results demonstrate that epithelial Sox4 controls Vγ2+ Tγδ17 cell maturation, in part by impacting Ch25h and Cyp7b1 expression in mTEC1.
Keratinocytes produce oxysterols
Equipping Tγδ17 thymocytes with GPR183 for export to skin predicts a corollary skin cellular network centered on oxysterol production that is critical for dermal Vγ2+ Tγδ17 cell function. We first determined oxysterol production in the skin using the transwell migration assay as above, comparing WT and Ch25h-deficient skin cell extracts. GPR183 transduced lymphocytes migrated to skin extracts in a concentration dependent manner, and the GPR183-dependent migration was not observed with skin extracts from Ch25h−/− mice (Figure 5A). These results demonstrate that skin cells produce functional 7α,25-HC.
Figure 5. Epidermal-derived oxysterols maintain skin Tγδ17 cells.
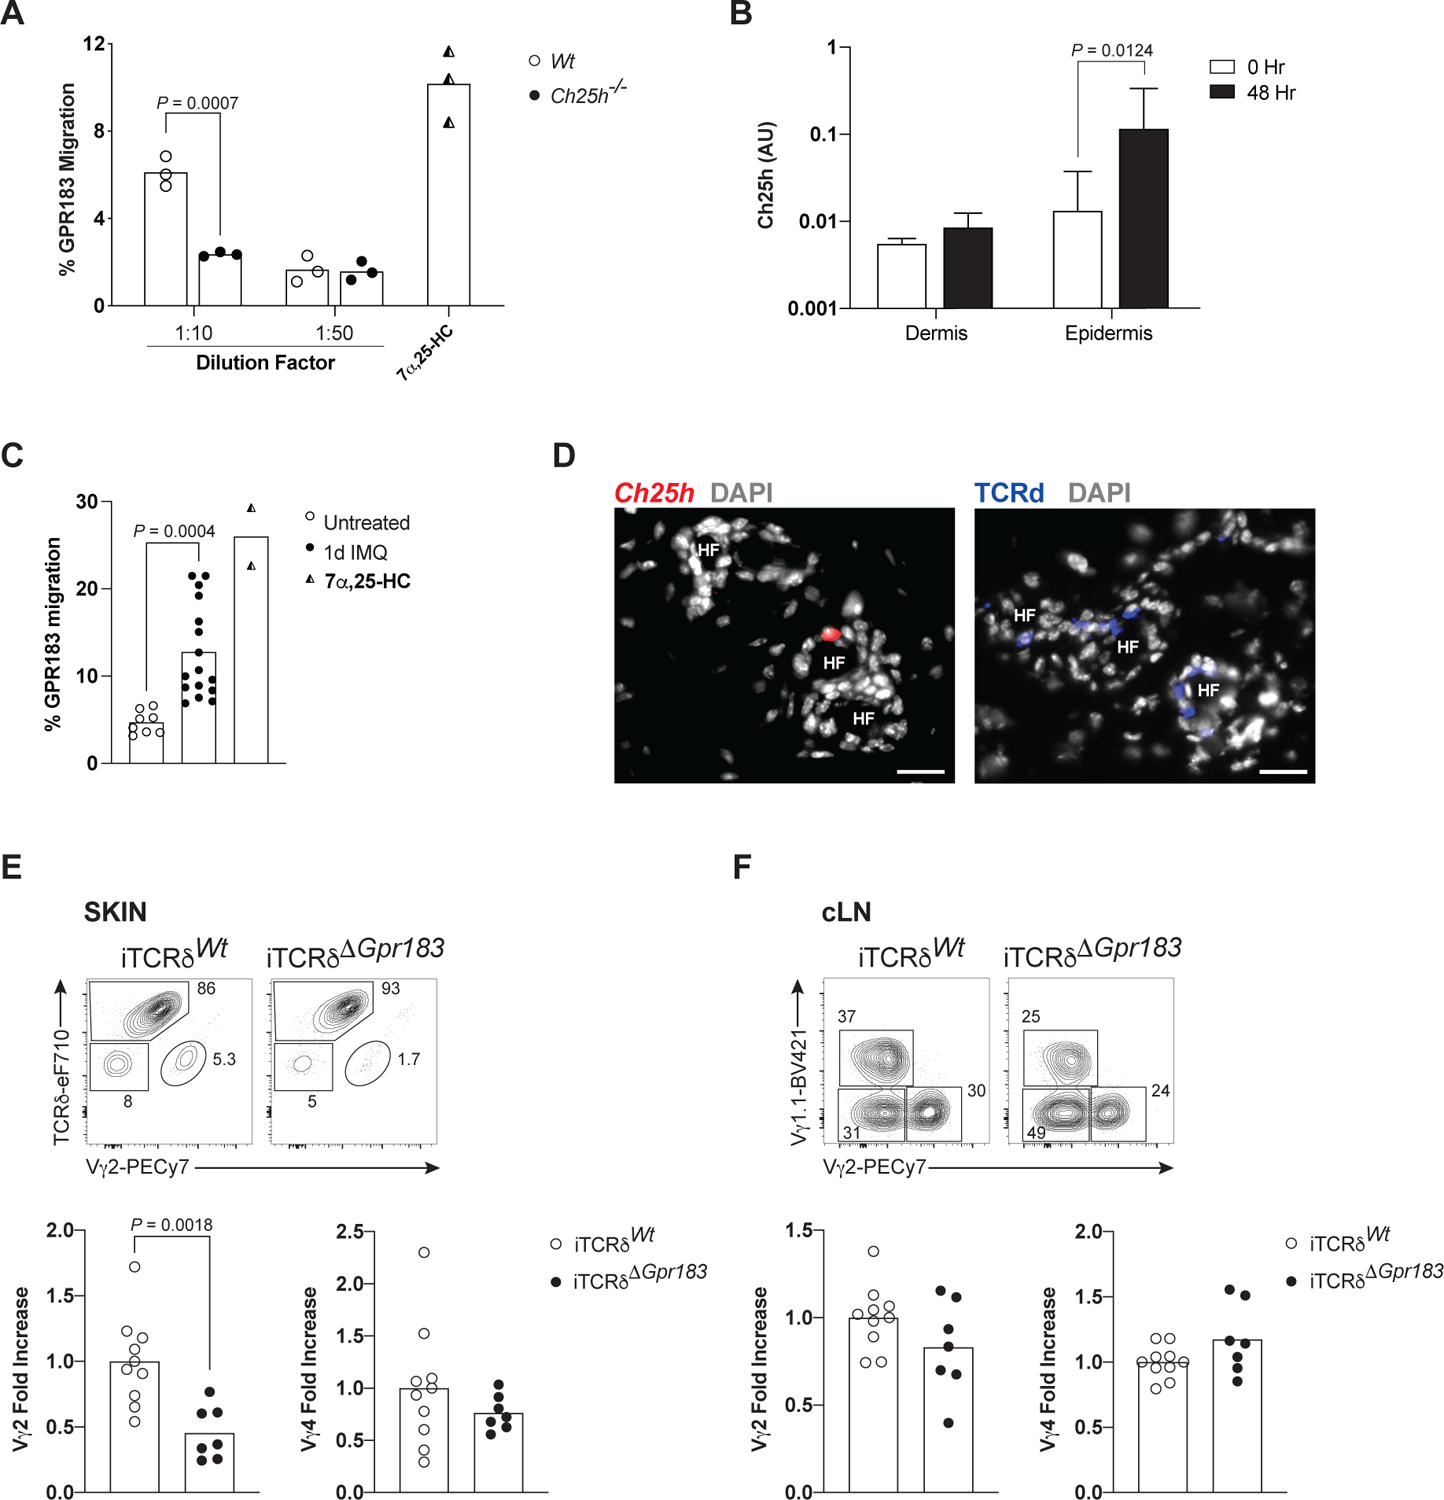
(A) Relative migration of GPR183+ cells in a transwell assay to ear extracts from adult WT and Ch25h−/− mice (n=3 mice per genotype). 100 nM of 7α,25-HC was used as the positive control.
(B) Analysis of Ch25h expression by RT-qPCR of dermal and epidermal cells isolated from adult WT ear skin post topical Imiquimod application for two days (n≥3 per time point).
(C) Relative migration of GPR183+ M12 cells in a transwell assay to ear extracts from adult WT mice treated for 1d with IMQ (n≥8 mice per genotype). 100 nM of 7α,25-HC was used as the positive control.
(D) Representative IF images (from 5 experiments) of ear skin from Ch25h reporter mice stained with DAPI, anti-RFP (left, to detect tdTom reporter) and anti-TCRδ (blue, right) Abs. HF, hair follicle.
(E) Representative flow cytometric profiles of γδ T cell subsets from adult TcrdCre/ERT2 (iTCRδWt) and TcrdCre/ERT2;Gpr183fx/fx (iTCRδΔGpr183) ear skin (top). Summary of the compiled relative frequencies of dermal Vγ2+ and Vγ4+ (Vγ1.1−Vγ2−) T cells in induced Gpr183-deficient mice, compared to WT, set as 1 (bottom) (n≥ mice per genotype).
(F) Representative flow cytometric profiles of γδ T cell subsets from adult iTCRδWt and iTCRδΔGpr183 cervical LNs (top). Summary of relative frequencies of dermal Vγ2+ and Vγ4+ T cells in induced Gpr183-deficient mice, compared to WT, set as 1 (bottom). n≥7 mice per genotype.
Data in (A-F) are representative of at least 3 independent experiments. P values determined by unpaired t-test.
Ch25h expression is upregulated upon TLR signaling.35 To identify skin cells that produce oxysterols we first determined the stromal cell fraction that inducibly transcribes Ch25h. In myeloid cells, Ch25h expression is rapidly upregulated with minimal expression at resting states.5 While basal amounts of Ch25h transcripts were detected in both the dermal and epidermal cell fractions, cutaneous treatment with the topical inflammatory TLR7/8 ligand Imiquimod (IMQ) upregulated Ch25h expression preferentially in epidermal keratinocytes (Figure 5B) and GPR183 ligand in the skin (Figure 5C). Immunofluorescence imaging of Ch25h-reporter mice identified basal keratinocytes9 termed interfollicular epidermal (IFE) keratinocytes and hair follicle (HF) outer bulge located at the dermal-epidermal border as the likely oxysterol depot in resting mice (Figure 5D), consistent with published skin scRNAseq datasets.36,37 Dermal γδ T cells primarily localized with HF that are sheathed with IFE keratinocytes at the upper dermal-epidermal interface (Figures 5D, S5A and S5B), although other positioning is documented.38
Vγ2+ Tγδ17 cells are skin resident, and once established after birth they can be maintained without inputs from peripheral lymphoid tissues. To determine whether continuous sensing of oxysterols by GPR183 is required for dermal Tγδ17 cell maintenance we acutely depleted Gpr183 from γδ T cells by administration of Tamoxifen (Tam) to TcrdCre/ERT2;Gpr183fl/fl mice (iTCRδΔGpr183). We confirmed that the Tam-mediated recombination was efficient (over 70% of skin γδ T cells had CRE activity) and specific (no CRE activity detected in skin αβ T cells, Figure S5C). Within 6 days of Tam-treatment there was a significant loss of dermal Vγ2+, but not Vγ4+, Tγδ17 cells (Figure 5E). This effect was muted in sLNs (Figure 5F). Correspondingly, acute removal of Ch25h from keratinocytes (by Tamoxifen treatment of Krt5Cre/ERT2;Ch25hfl/fl mice39 also specifically diminished the frequency of Vγ2+ Tγδ17 cells (Figure S5D). Together, these results show that basal keratinocytes express Ch25h that can be modulated by inflammatory cues, and that the GPR183-oxysterol ligand axis is necessary for optimal maintenance of skin resident Vγ2+ Tγδ17 cells.
Diet-derived oxysterol determines severity of Vγ2+ Tγδ17 cell-mediated psoriasis
We and others have shown that Vγ2+ (but not Vγ4+) Tγδ17 cells are absolutely required for psoriasis driven by cutaneous treatment with IMQ.10,40 Increased dietary intake of fat and lipid can sensitize mice to develop more severe IMQ-mediated psoriasis,41 correlating with enhanced activities of Tγδ17 cells and providing one plausible explanation for a correlation between obesity and severity of tissue inflammatory disorders in humans, including psoriasis and atopic dermatitis.42 Molecular pathways controlling diet regulated T3L function in mucocutaneous tissues are unknown.
To test whether dietary cholesterol calibrates proximal Tγδ17 inflammatory responses via GPR183, we fed mice with chow supplemented only with cholesterol (2%, High Cholesterol Food, HCF) for 2 wks. GPR183 ligand and its precursor were increased in the skin of mice fed HCF as assessed by the migration assay (Figures 6A and S6A), correlating with increased expressions of Ch25h and Cyp7b1 in skin cells (Figure 6B). Prolonged exposure (8 wks) to 2% HCF led to ear thickening (Figure S6B) and increased basal in vivo IL-17 production by dermal Vγ2+ Tγδ17 (Figure S6C). Psoriatic response to IMQ topical administration was exacerbated in mice fed 2% HCF for 2 wks, as reflected by the two standard measures of disease severity in this model, increased ear thickness and epidermal hyperplasia resulting from overt inflammatory response (Figures 6C and 6D). We took advantage of the normal numbers of Vγ2+ Tγδ17 cells in Gpr183−/− mice (Figure 2B, contrasted to DKO mice and in the Gpr183 acute depletion model), to assess whether GPR183-oxysterol sensing is required for the psoriatic response controlled by Tγδ17 cells. Ch25h-deficient mice are not an ideal model for this purpose as CH25H has pleiotropic effects on inflammatory responses in most tissues.5,43 Mice lacking GPR183 only marginally responded to IMQ treatment (Figure 6E) and HCF did not enhance the response (Figure 6F), suggesting that sensing of 7α,25-HC is required for Tγδ17 tissue effector function. Surprisingly, at the end of IMQ treatment in the HCF cohort, there was a significant depletion of Vγ2+ T cells in the skin and LNs of IMQ-treated Gpr183−/− mice, with attendant decreases in Vγ2+ Tγδ17 cells in these tissues (Figures 6G and 6H). The fetal-origin Vγ4+ Tγδ17 cells were also decreased in the skin of IMQ-treated Gpr183−/− mice, but no differences were observed in sLNs. DETCs were unaltered and comparable to untreated WT mice (Figure S6D). Cholesterol-enhanced psoriasis required GPR183 expression on T cells and dependent on 7α,25-HC production, since mice lacking GPR183 in T cells (RorcCreGpr183flox/flox), and mice deficient for CH25H showed blunted skin inflammation upon 2% HCF and IMQ topical administration (Figures S6E and S6F). These results indicate that Gpr183 is required to maintain tissue Tγδ17 cells in sustained inflammatory settings, particularly with high concentrations of tissue cholesterol metabolites.
Figure 6. Dietary cholesterol exacerbates Imiquimod-induced psoriasis that is dependent on GPR183 oxysterol cognition.
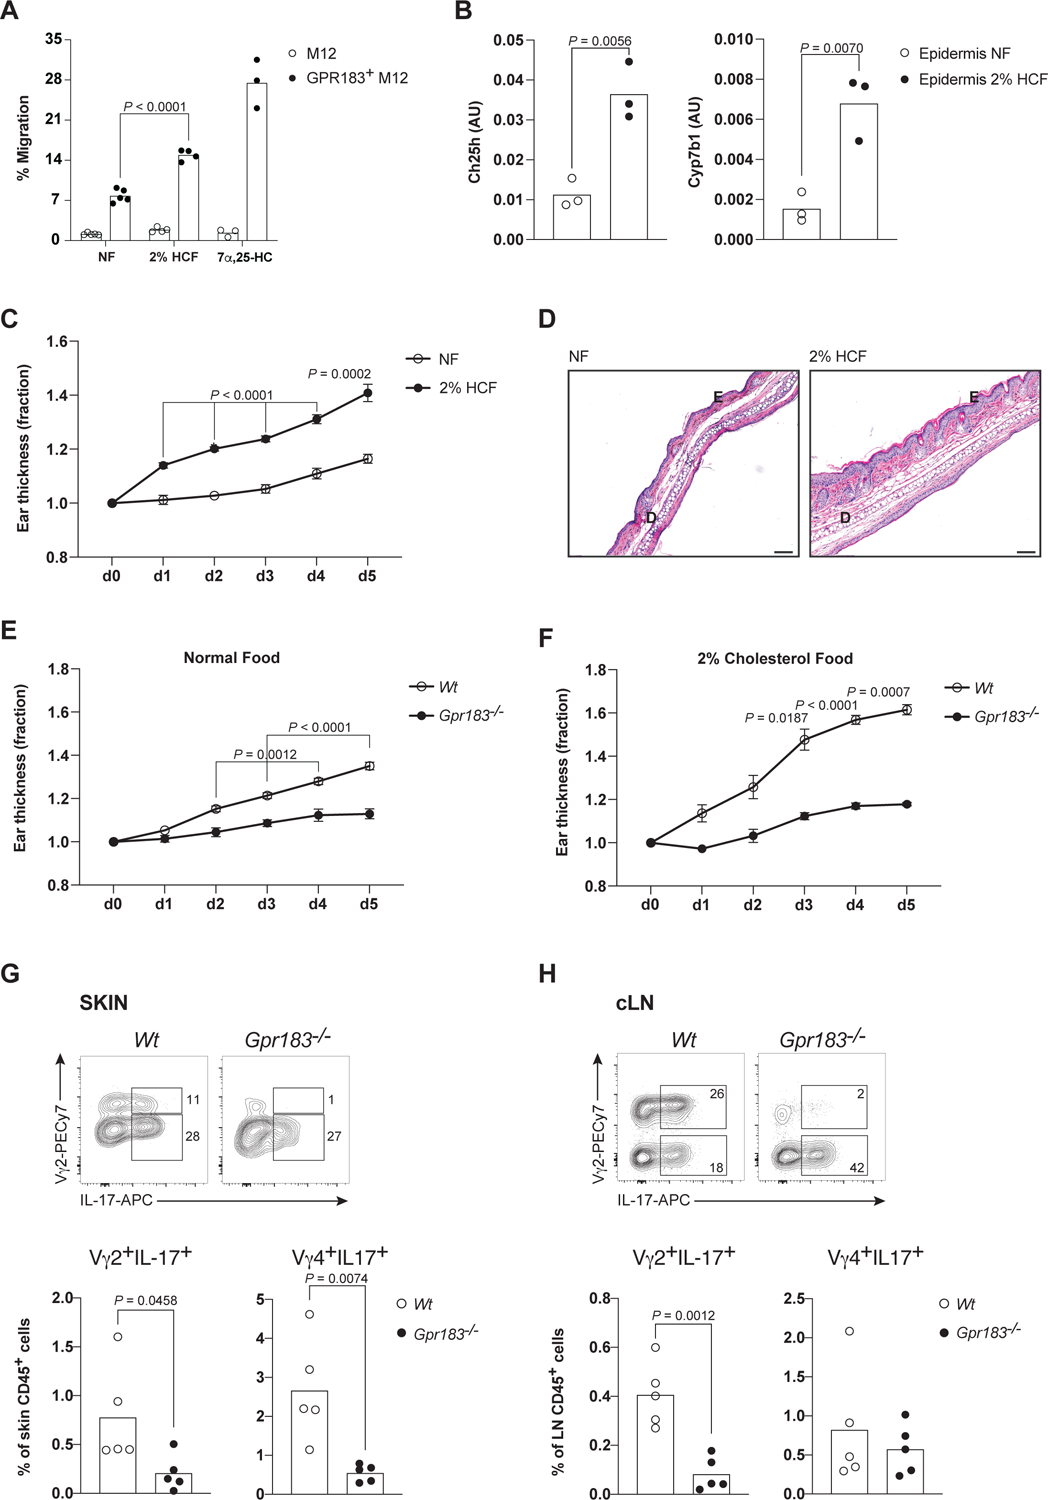
(A) Relative migration of GPR183+ cells to ear extracts from mice on NF or 2% HCF diets for 2 wks (n≥4 per diet group), measured in the transwell migration assay.
(B) Analysis of Ch25h and Cyp7b1 expression by RT-qPCR of ear skin epidermal cells of adult WT mice on different diets (NF, normal food or 2% HCF, high cholesterol food) for 2–4 weeks (n=3 per diet group). 100 nM of 7α,25-HC was used as the positive control.
(C) Relative ear-skin thickness (set at 1 at d0) measurements for 6 days from of IMQ-treated WT mice on NF or 2% HCF diet (n≥11 per diet group).
(D) Representative hematoxylin-and-eosin staining of ear skin from WT mice treated with IMQ for 5d as in (c) (n=5 per diet group). D, dermis; E, epidermis. Scale bar is 100 μm.
(E-F) Relative ear-skin thickness measurements of IMQ-treated WT and Gpr183−/− mice on NF diet (n≥6 mice per genotype) (E) or on 2% HCF diet (n=5 mice per genotype) (F).
(G-H) Representative flow cytometric profiles of intracellular IL-17 (icIL-17) amounts in Vγ2+ T cells from WT and Gpr183−/− skin (G) and cervical LNs (H) of mice (2% HCF diet) treated daily for 5 d with IMQ (top rows). Summary of frequencies of icIL-17+ cells expressing Vγ2+TCR or Vγ4+TCR (bottom rows) amongst hematopoietic cells (CD45+) determined in the same studies (n=5 mice per genotype), at the end of IMQ treatment.
Data in (A-H) are representative of at least 3 independent experiments. P values determined by unpaired t-test (A, G, H) or by two-way ANOVA (B, D-F).
Together, these findings demonstrate that one consequence of a diet rich in cholesterol is increased susceptibility to overt psoriasis. Changes in dietary cholesterol metabolite composition in the skin are sensed by GPR183 on dermal T cells, calibrating their pathogenic effector activities.
Discussion
Based on the long-standing link between obesity and heightened inflammatory conditions in multiple human diseases, observational data have been interpreted to provide correlation between types of diet and lymphocyte-mediated inflammatory diseases. However, high fat/cholesterol-regulated lymphoid molecules critical for immune responses are unknown, aside from the secreted, generic inflammatory cues (e.g. TNF, IL-6) that affect nearly all cells in the body. Moreover, investigation into the lipid metabolism-T cell axis has been primarily focused on intracellular synthesis of cholesterol and its metabolite for both lipid anabolic program and antigen-receptor signaling.44–50 Tγδ17 thymocytes (both Vγ4+ and Vγ2+) have been reported to accumulate intracellular lipid droplets and upon exit to periphery they appear dependent on cholesterol as the main energy source.51 While extracellular lipoprotein modulation of T cell function in vitro and in vivo has been documented,52–58 mechanistic links amongst diet-derived (i.e. not endogenously synthetized) metabolites, specific sensors on lymphocytes, and direct immune functional outcomes have been lacking. Here we show that high cholesterol from the diet is associated with increased production of oxysterols and that in turn worsens DAMPelicited, Vγ2TCR+ Tγδ17 cell-driven psoriatic responses. Remarkably, this oxysterol sensing capacity is “learned” during thymic differentiation, as cells incapable of sensing the ligands for GPR183 and CCR6 do not mature. The gene network of oxysterol production in the thymus is conserved in the human thymus34, suggesting that human GPR183+ T cells will exhibit shared function with the mouse counterparts.
Our data for the first time reveal the possibility of dedicated mTECs that regulate innate T3L, paralleling the regulatory circuit required for innate Type 2 cytokine producers.31,33 The developmentally programmed GPCR function described here is unique and requires a specific anatomical thymic niche composed of Sox4+ mTECs that are a subset of mTEC1. We have previously shown that Sox4 regulates expression of T3L signature genes and is required for Tγδ17 development in a thymocyte-intrinsic manner.21 That Sox4 is also required in the epithelial cells to ensure maturation of Tγδ17 thymocytes in trans provides a pleasing symmetry of coordinated thymocyte-stromal interactions. Given that Sox4 also regulates other thymic-derived, αβTCR+ innate T3L development, such as iNKT17 and MAIT17,21 it would be of interest to determine whether their maturation would also be controlled by Sox4+ mTECs. Together, the findings reveal a highly organized mTEC subset functionality geared for effector type-specific, non-conventional thymocyte maturation. Understanding how distinct TF networks impart mTEC functionality is central to redefining T cell education processes in the thymus, beyond the conventional αβ T cell selection process.
How mobile innate lymphoid sentinels are positioned in barrier tissues is mostly unknown, especially in a homeostatic state with no overt inflammation. The dermis is sparsely populated with immune cells and the density of dermal commensal bacteria is very low.59 An efficient surveillance system would need specialized cells with a guidance system that seek out anatomical hubs concentrated with molecular cues indicative of tissue dysbiosis. GPCRs mediate immune cell positioning in tissues. Yet, except in relatively rare cases,60,61 single GPCR deficiency does not translate to obvious cell positioning defects, as other chemotactic cues can guide cell delivery to sub-anatomical niches, and random walk eventually allows immune cells to reach their intended localization even without sensing migratory gradient. Hence, competitive experimental settings (such as adoptive transfer and mixed bone marrow chimera) are needed to reveal the requirements for in vivo localization62–65 as previously shown, among others, for CCR6 and GPR183.14,66 Acute alterations of GPR183-oxysterol interaction in skin impact Vγ2+ Tγδ17 cell accumulation in the dermis, likely due to immediate cell-to-cell competition for anatomically segregated ligand depots in the tissue. Whether similar processes are operational in human skin are unknown. In adults, the majority of IL-17 producing innate-like T cells appears to be MAIT.67 GPR183 is detected on some human skin MAITs and the GPR183 ligand is produced by the human skin.68 MAIT17 are thus the best functional correlates of mouse cutaneous Tγδ17 cells. While Tγδ17 cells have been reported to be rare in adult human mucocutaneous tissues18,68 fetal Tγδ17 cells develop in the late first trimester of pregnancy.69 Whether this early wave of Tγδ17 cells populate infant skin that then decay over time is an active area of investigation.
In addition to the conserved oxysterol gene network in human thymus, human genetic variations in Gpr183 have been linked to psoriasis,70 inflammatory bowel diseases (IBD)71 and Type 1 diabetes.72 A single nucleotide polymorphism in Gpr183 increases the risk for IBD71 and in mouse, Gpr183 deficiency impairs intestinal ILC3 localization.11 Moreover, an inability to sense GPR183 ligand protects from a murine model of colitis, suggesting that mechanisms underpinning tissue damage driven by heightened GPR183-mediated migration and signaling is conserved across mucocutaneous tissue barriers. Ch25h expression and 25-HC production are controlled by TLR ligands in a Type I IFN–dependent fashion,73 thereby modulating GPR183 ligand concentration in tissues and potentially serving as a rheostat of Tγδ17 cell (and likely other T3L) activation. Whether inflammatory cascades also impact homeostatic GPR183 ligand concentration is largely unknown. While commensal bacteria in mucocutaneous tissues can influence a wide range of immune processes, they do not seem to modulate Ch25h induction or Vγ2+ Tγδ17 cell maintenance.9,11 Rather, our data support the possibility that dietary metabolites, and other life essential derivatives, calibrate tissue GPR183+ T3L function.
STAR METHODS
RESOURCES AVAILABILITY
Lead Contact
Further information and requests for resources and reagents should be directed to and will be fulfilled by the Lead Contact, Andrea Reboldi (andrea.reboldi@umassmed.edu).
Materials availability
Ch25htdTom mouse line generated in this study is available from the lead contact with a completed materials transfer agreement.
Data and code availability
Single-cell RNAseq data γδ thymocytes have been deposited at GEO and are publicly available as of the date of publication. Accession numbers are listed in the key resources table. This paper analyzes existing, publicly available single-cell RNAseq data of TEC subsets. The accession number for this dataset is listed in the key resources table. Microscopy data reported in this paper will be shared by the lead contact upon request. Any additional information required to reanalyze the data reported in this paper is available from the lead contact upon request. This paper does not report original code.
KEY RESOURCES TABLE
| REAGENT or RESOURCE | SOURCE | IDENTIFIER |
|---|---|---|
| Antibodies | ||
| Syrian Hamster anti-mouse CD3e Biotin | eBioscience | Cat#13003382 RRID:AB_1470754 |
| Rat anti-mouse CD8α Biotin | Biolegend | Cat#100704 RRID:AB_312743 |
| Rat anti-mouse CD11b Biotin | Biolegend | Cat#101204 RRID:AB_312787 |
| Armenian Hamster anti-mouse CD11c Biotin | eBioscience | Cat#13011485 RRID:AB_466363 |
| Rat anti-mouse CD19 Biotin | BD Biosciences | Cat#553784 RRID:AB_395048 |
| Rat anti-mouse Gr-1 Biotin | Biolegend | Cat#108404 RRID:AB_313369 |
| Mouse anti-mouse NK1.1 Biotin | Biolegend | Cat#108704 RRID:AB_313391 |
| Rat anti-mouse Ter-119 Biotin | BD Biosciences | Cat#553672 RRID:AB_394985 |
| Armenian Hamster anti-mouse TCRβ Biotin | eBioscience | Cat#13596185 RRID:AB_466820 |
| Armenian Hamster anti-mouse TCRγ/δ Biotin | Biolegend | Cat#118103 RRID:AB_313827 |
| Rat anti-mouse CD4 Biotin | eBioscience | Cat#13004385 RRID:AB_466334 |
| Armenian Hamster anti-mouse TCRβ BV605 | Biolegend | Cat#109241 RRID:AB_2629563 |
| Armenian Hamster anti-mouse TCRγ/δ PerCP-eFluor 710 | eBioscience | Cat#46571182 RRID:AB_2016707 |
| Armenian Hamster anti-mouse Vγ2 PE-Cy7 | eBioscience | Cat#25582882 RRID:AB_2573474 |
| Armenian Hamster anti-mouse Vγ1.1 BV421 | BD Biosciences | Cat#566308 RRID:AB_2739676 |
| Rat anti-mouse CD24 BV605 | Biolegend | Cat#101827 RRID:AB_2563464 |
| Rat anti-mouse CCR6 Alexa Fluor 647 | BD Biosciences | Cat#557976 RRID:AB_2228793 |
| Armenian Hamster anti-mouse CD27 PE | eBioscience | Cat#12027183 RRID:AB_465615 |
| Rat anti-mouse CD4 BV650 | Biolegend | Cat#100546 RRID:AB_2562098 |
| Rat anti-mouse CD44 BV711 | Biolegend | Cat#103057 RRID:AB_2564214 |
| Rat anti-mouse IL-17A PerCPCy5.5 | eBioscience | Cat#45717782 RRID:AB_925753 |
| Rat anti-mouse IFNγ PE | Biolegend | Cat#505808 RRID:AB_315402 |
| Rat anti-mouse CD8β APC/Cyanine7 | Biolegend | Cat#126620 RRID:AB_2563951 |
| Rat anti-mouse CD45 BV785 | Biolegend | Cat#103149 RRID:AB_2564590 |
| Rat anti-mouse CD49f FITC | Biolegend | Cat#313606 RRID:AB_345300 |
| Rat anti-mouse Sca-1 BV605 | Biolegend | Cat#108134 RRID:AB_2650926 |
| Rat anti-mouse CD71 PE-Cy7 | Biolegend | Cat#113811 RRID:AB_2203383 |
| Rat anti-mouse CD326 PE | Biolegend | Cat#118206 RRID:AB_1134172 |
| Rat anti-mouse CD326 PE-Cy7 | Biolegend | Cat#118216 RRID:AB_1236471 |
| Rat anti-mouse I-A/I-E APC | Biolegend | Cat#107614 RRID:AB_313329 |
| Armenian Hamster anti-mouse CD80 PerCPCy5.5 | Biolegend | Cat#104721 RRID:AB_893406 |
| Rat anti-mouse Ly51 FITC | Biolegend | Cat#108305 RRID:AB_313362 |
| Rat anti-mouse CD104 PE | Biolegend | Cat#123610 RRID:AB_2563544 |
| UEA-1 biotin | Vector Labs | Cat#B1065 RRID:AB_2336766 |
| Rat anti-mouse Scart2 | J. Kisielow | Cloned hybridoma 25A2 |
| Goat anti-Rat IgG PE | Southern Biotech | Cat#305009 RRID:AB_2795834 |
| Rat anti-mouse Anti-CD16/32 | Biolegend | Cat#101330 RRID:AB_2561482 |
| Rabbit anti-GFP | Invitrogen | Cat#A11122 |
| Rabbit anti-RFP | Rockland | Cat#600401379 RRID:AB_11182807 |
| Rat anti-mouse SCART2 Alexa Fluor 647 | Muzaki et al.74 | Cloned hybridoma 41G1 |
| Rat anti-mouse AIRE Alexa Fluor 488 | eBioscience | Cat#53593480 RRID:AB_10852560 |
| Cy3-conjugated donkey anti-rabbit | Jackson ImmunoResearch Laboratories | Cat#711165152 RRID:AB_2307443 |
| Streptavidin Alexa Fluor 450 | eBioscience | Cat#48431782 RRID:AB_10359737 |
| Chemicals, peptides, and recombinant proteins | ||
| Fetal Bovine Serum | Sigma-Aldrich | Cat#F0926 |
| Phorbol 12-myristate 13-acetate (PMA) | LC Laboratories | Cat#P-1680 |
| Ionomycin Calcium Salt | Sigma-Aldrich | Cat#I3909 |
| GolgiStop (Monensin) | BD Biosciences | Cat#512301KZ |
| GolgiPlug (Brefeldin A) | BD Biosciences | Cat#512092KZ |
| DNase I, grade II | Roche | Cat#10104159001 |
| Liberase TL | Roche | Cat#05401020001 |
| Liberase TM | Roche | Cat#05401119001 |
| Hylauronidase | Sigma-Aldrich | Cat#H3506 |
| Trizol | Ambion Life Technologies | Cat#15596018 |
| Tamoxifen | Sigma-Aldrich | Cat#T5648 |
| Peanut Oil | Sigma-Aldrich | Cat#P2144 |
| Hepes (1 M) | Gibco | Cat#15630080 |
| 0.25% Trypsin in HBSS w/o Calcium and Magnesium | Corning | Cat#25050CI |
| EDTA 500mM, pH 8.0 | Teknova | Cat#E036 |
| RLT buffer (RNeasy Lysis Buffer) | Qiagen | Cat#79216 |
| 2-mercaptoethanol | Sigma-Aldrich | Cat#6250 |
| Percoll | GE Healthcare | Cat#17089101 |
| DAPI | Sigma Aldrich | Cat#D9542 |
| 7α,25-dihydroxycholesterol | Avanti Polar Lipids | Cat#700080P |
| 25-hydroxycholesterol | Avanti Polar Lipids | Cat#700019P |
| Imiquimod Cream 5% | Perrigo | Cat#45802036862 NDC#45802036862 |
| Critical commercial assays | ||
| Cytofix/Cytoperm Fixation/Permeabilization Kit | BD Biosciences | Cat#554714 |
| Fixable Viability Dye eFluor 780 | eBioscience | Cat#65086514 |
| Fixable Viability Dye eFluor 506 | eBioscience | Cat#65086618 |
| RNeasy Micro kit | Qiagen | Cat#74004 |
| RNeasy Mini kit | Qiagen | Cat#74104 |
| SuperScript First-Strand Synthesis System for RT-PCR | Invitrogen | Cat#11904018 |
| iQ SYBR green Supermix | Bio-Rad | Cat#1725270 |
| Fluoromount-G | SouthernBiotech | Cat#0100–01 |
| Deposited data | ||
| Single-cell RNA Sequencing of γδ thymocytes | This Paper | GEO: GSE221488 |
| Single-cell RNA Sequencing of TEC subsets | Cowan et al.75 | GEO: GSE131368 |
| Experimental models: Cell Lines | ||
| M12-EBI2-GFP | Gift from J. Cyster | Kelly et al.30 |
| Human Embryonic Kidney Cells (HEK293T) | ATCC | Cat#CRL-3216 |
| Experimental models: Organisms/strains | ||
| Mouse: C57BL/6J | The Jackson Laboratory | 000664 |
| Mouse: Ccr6−/− | The Jackson Laboratory | 005793 |
| Mouse: Ch25h−/− | The Jackson Laboratory | 016263 |
| Mouse: TcrdCre/ERT2 | The Jackson Laboratory | 031679 |
| Mouse: Foxn1Cre | The Jackson Laboratory | 018448 |
| Mouse: RorcCre | The Jackson Laboratory | 022791 |
| Mouse: Krt5Cre/ERT2 | The Jackson Laboratory | 029155 |
| Mouse: Sox4Egfp | MMRRC | 030033-UCD |
| Mouse: Gpr183+/Egfp | Pereira et al.14 | N/A |
| Mouse: Gpr183fl/fl | Pereira et al.14 | N/A |
| Mouse: Sox4fl/fl | Malhotra et al.21 | N/A |
| Mouse: Ch25hfl/fl | Ceglia et al.39 | N/A |
| Mouse: Ch25htdTom | This paper | N/A |
| Oligonucleotides | ||
| See Table S1 for list of quantitative RT-PCR primers | N/A | N/A |
| Recombinant DNA | ||
| MSCV-IRES-Thy1.1 | Addgene | ID: 17442 |
| Software and algorithims | ||
| FlowJo v10.8 software | Tree Star | https://www.flowjo.com/solutions/flowjo/downloads |
| FACSDiva v7.0 software | BD | https://www.bdbiosciences.com/en-us/products/software/instrument-software/bdfacsdiva-software |
| ZEN 3.1 | Carl Zeiss Microscopy | https://www.zeiss.com/microscopy/en/products/software/zeiss-zen.html |
| Adobe Illustrator 2022 | Adobe Systems | N/A |
| ImageJ | NIH | https://imagej.nih.gov/ij/ |
| Prism 9 | GraphPad Software | https://www.graphpad.com/scientificsoftware/prism/ |
| Seurat R v2.3 | Butler et al.76 | https://satijalab.org/seurat/ |
| Seurat R v3.2 | Stuart et al.77 | https://satijalab.org/seurat/ |
| Other | ||
| Standard chow diet (Prolab IsoPro RMH 3000) | LabDiet | 5P76 |
| 2% high cholesterol diet | Envigo | TD.200179 |
EXPERIMENTAL MODELS AND SUBJECT DETAILS
Mice
Ccr6−/− (Stock no: 005793), Ch25h−/− (Stock no: 016263), TcrdCre/ERT2 mice (Stock no: 031679), Foxn1Cre mice (Stock no: 018448), C57BL/6J mice (Stock no: 000664), RorcCre mice (Stock no: 022791) and Krt5Cre/ERT2 mice (Stock no: 029155) were from Jax Laboratories. Gpr183+/Egfp (reporter insertion creates a null allele) and Gpr183fl/fl mice were described previously14,78, Sox4Egfp mice were sourced from MMRRC (Stock no: 030033-UCD), Sox4fl/fl mice were described previously21, originally from V. Lefebvre79 and Ch25hfl/fl were described previously.39 Ch25htdTom knock-in animals were generated using crRNA (gtgggacatagtctcagcat) and tracrRNA ordered from IDT, which target around the start codon of Ch25h. To make the donor DNA, a 5’ homology arm (0.8kb) and 3’ homology arm (0.8kb) were generated from mouse genomic DNA by PCR and cloned into vector pCR-Blunt II-TOPO to flank the tdTomato-polyA insert. RNP assembly followed standard protocol of IDT. sgRNA, circular donor DNA, and Cas9 protein were provided to the Gladstone Gene Targeting Core for C57BL/6J blastocyst microinjection. 2/14 mice were confirmed by sequencing to have tdTomato-polyA inserted immediately after the start codon of Ch25h. These two founders were bred to C57BL/6J mice and germline transmission was confirmed by allele-specific PCR. Males and females were used for experiments, but sex-matched within an experiment. No differences were observed between sexes. Ages of mice used for experiments are indicated in Figure Legends. Animals were randomly allocated to experimental groups. All mouse procedures were approved by the University of Massachusetts Medical School IACUC.
METHOD DETAILS
Diets
Mice were either fed a standard chow diet (Prolab IsoPro RMH 3000 5P76) or a high cholesterol diet (2% cholesterol added to the Prolab RMH 3000 5P76; Envigo TD. 200179, customized diet) for the duration of the experiment.
Tamoxifen treatment
Tamoxifen (Sigma) was dissolved in Peanut Oil (Sigma) oil at 25 mg/mL and 5mg of tamoxifen (250 μg/body weight) was orally gavaged 3 times into mice (6 to 8 weeks old) every other day.
Cell isolation
Skin single cell suspensions were prepared from mouse ears. Ears were depilated using Nair application for two minutes, followed by gentle removal of cream and rinsing of tissues using PBS, as previously described.9 For total skin cell isolation, as previously described9, depilated mouse ears were peeled into dorsal and ventral halves, chopped finely using scissors, and digested with 1 U/mL Liberase TL (Roche) + 0.5 mg/mL Hylauronidase (Sigma-Aldrich) + 0.05 mg/mL DNAse (Roche) dissolved in HBSS (Corning) + 5% FCS (Sigma-Aldrich) + 1 mM Hepes (Gibco) on a stir plate for 90 minutes at 37°C. To stop digestion, 10 mM EDTA (Teknova) was added. Cells were filtered through 100 μm cell strainer, rinsed with HBSS (Corning) + 5% FCS (Sigma-Aldrich) + 1 mM Hepes (Gibco) + 1% Penicillin/Streptomycin (Gibco), spun down, filtered through 70 μm cell strainer, rinsed again, spun down, and plated for antibody staining for flow cytometry or for cytokine stimulation. For dermal and epidermal cell isolation, depilated ear tissues were peeled into dorsal and ventral halves and each placed dermal side down to float on 0.25% Trypsin (Corning) with 1 mM EDTA (Teknova) for 1 hr at 37°C, as previously described.80 Following incubation, epidermis was gently scraped off of dermal layer of ear halves using forceps, filtered through 100μM cell strainer into RPM1-1640 (Gibco) + 10% FCS (Sigma-Aldrich) + 1 mM Hepes (Gibco) + 1% Penicillin/Streptomycin (Gibco), and spun down for subsequent procedures. The dermal layer was collected and homogenized in RLT buffer (Qiagen) + 1% 2-mercaptoethanol (Sigma-Aldrich) for downstream analysis. For thymic epithelial cell isolation, single-cell thymic suspensions were prepared, and TEC isolated for cell sorting as previously described.75 In brief, the thymus was cut in small pieces and digested with 63μg/mL Liberase TM (Roche) + 20 μg/ml DNaseI (Roche) while shacking for 40 min at 37°C. Cells were then resuspended in 1.115 g/mL isotonic Percoll (GE Healthcare), overlaid with 2 mL of 1.065 g/mL isotonic Percoll and 2 mL of PBS. Samples were centrifuged at 2700 RPM for 20 min at 4°C with the brake off. The thymic epithelial cells were enriched at the interface between the Percoll and the PBS layers. The isolated cells were then stained for cell sorting as described below.
Antibodies and Flow Cytometry
Flow cytometry staining was performed in 96-well microtiter plates. Antibody cocktails were diluted in PBS (GIBCO) + 2% FBS (Sigma-Aldrich) + 2 mM EDTA (Teknova), and cells were stained in 50 μL for 20 min on ice. With the exception of SCART2 antibody (25A2 hybridoma) kindly donated by the Kisielow group, all of the following antibodies were purchased from BD Biosciences, Biolegend or eBioscience: CD3ε (500A2), CD4 (RM4–5), CD8α (53–6.7), CD8β (YTS156.7.7), TCRβ (H57–597), TCRδ (GL3), Vγ2 (UC3–10A6), Vγ1.1 (2.11), CD27 (LG.3A10), CCR6 (140706), CD24 (M1/69), CD44 (IM7), CD45 (30-F11), IFNγ (XMG1.2), IL-17A (7B7), CD34 (RAM34), CD49F (GoH3), Sca1 (D7), CD326 (EpCAM) (G8.8), I-A/I-E (M5/114.15.2), CD80 (16–10A1) and Ly51 (6C3). Biotinylated UEA-1 (B-1065) was from Vector Labs. Anti-rat IgG (Southern Biotechnology Associates) was used as a secondary reagent for SCART2 detection. All samples were labeled with Fixable Viability Dye (Thermofisher) to exclude deal cells from all analysis. For intracellular cytokine staining, cells were stimulated in vitro with 10 ng/mL phorbol myristate acetate (PMA) + 1 μM Ionomycin (both Sigma-Aldrich) in the presence of GolgiPlug and GolgiStop (BD Biosciences) for 4 hours at 37°C, surface stained, LIVE/DEAD labeled, fixed/permeabilized with Cytofix/Cytoperm buffer (BD Biosciences) and then stained for indicated intracellular cytokines. Data were acquired on a BD LSRII cytometer or FACSAria (BD Biosciences) and analyzed using FlowJo (Treestar).
Cell sorting
For γδ thymocyte sorting, thymocytes from 12-day old mice were stained and sorted as TCRδ+/CD3+/TCRβ−/CD4−/CD8− with a 70μm nozzle. For TECs cell sorting, single cells thymic suspensions from 4 weeks old mice were stained for CD45, EpCAM, Ly51, CD80, I-A/I-E, UAE-1 and sorted as previously described.75 All cells were sorted on a BD FACSAria II.
Histology and immunofluorescence
For H&E staining, muzzle tissue was first fixed in 10% neutral-buffered formalin for 24 hr, and then paraffin embedded, sectioned, and stained by the UMMS DERC Morphology Core. For immunofluorescence, tissues were fixed in 4% paraformaldehyde (J.T. Baker), 0.53 M L-Lysine, 2.1 mg/ml sodium m-periodate, 0.024 N NaOH in PB for at least 2 hours at 4°C, washed three times for 10 min in PB, then moved to 30% sucrose in PBS overnight. Tissues were flash frozen in Tissue-Tek Cryomold (VWR) the next day, and 7-mm sections were cut and then dried for 1 hour before staining. Sections were rehydrated in PBS, blocked, and then stained in primary antibody overnight at 4°C and stained for subsequent steps for 2 hours at room temperature. For thymus, slides were blocked with 5% normal mouse serum + 5% normal rat serum in PBS, 0.3% Triton-X100 (Sigma), 0.2% Bovine Serum Albumin (BSA) and 0.1% sodium azide. All the antibodies were diluted in the same buffer containing 2% normal mouse serum + 2% normal rat serum. For skin, slides were permeabilize for 10 minutes with 0.1% Triton X100 (Sigma) in PBS, and then blocked for 1 hr in blocking buffer (2.5% normal donkey serum, 2.5% normal goat serum, 2.5% normal mouse serum, 2.5% normal rat serum, 1% BSA, 1% Gelatin, 0.3% Triton X-100). All the antibodies were diluted in the same buffer. Sections were stained with the following primary antibodies: Rabbit anti-GFP (polyclonal, Life Technologies), Rabbit anti-RFP (polyclonal, Rockland), Alexa647-conjugated anti-SCART274, Biotinylated anti-TCRδ (GL3, eBioscience), Alexa488-conjugated anti-AIRE (5H12, eBioscience). Sections were then stained with the following secondary antibodies: Cy3-conjugated donkey anti-rabbit (Jackson Immunoresearch), Alexa488-conjugated streptavidin (Invitrogen) and DAPI (BioLegend). Images were obtained with a Zeiss AxioObserver.Z1 (Carl Zeiss) inverted microscope and were analyzed by imaging processing software ImageJ (NIH).
Imiquimod model of psoriasis
Mice between 6 and 12 weeks of age were anesthetized with isoflurane before treating each ear with 5 mg of 5% imiquimod cream (Imiquimod Cream 5%; Perrigo) daily for up to 5 days. Peripheral and central ear thicknesses were measured daily with a digital caliper (Mitutoyo).
Oxysterol chemoattractant bioassay
Mouse tissue extracts were prepared as previously described.30 Briefly, organs were weighed and mashed in 10 times the volume in mg (100 mg/ml) of sterile chemotaxis media (RPMI + 0.5% fatty acid-free BSA) through a 70-mm filter. Clean supernatants were collected after centrifugation and tested for bioactivity by Transwell chemotaxis assays of an EBI2+ M12 B cell line.30 50 nM 7α,25-HC (Avanti Polar Lipids) was used as positive control. Relative amounts of in situ 25-HC was determined as described81. Briefly, skin extracts were incubated sequentially with HEK293T cells transfected with a MSCV retroviral construct encoding mouse Hsd3b7 (to remove in situ 7α,25-HC) and then with Cyp7b1 transfected HEK293T cells (to convert in situ 25-HC to 7a,25-HC). Supernatants from the latter were used in the M12 bioassay.
RNA extraction and Real-Time RT-PCR
For RT-qPCR analysis of the thymus, the organ was homogenized in RLT buffer (Qiagen) + 1% 2-mercaptoethanol (Sigma-Aldrich) using an Omni Tissue homogenizer. For RT-qPCR analysis of the skin epidermis and dermis, cells were isolated as described above. Epidermal and dermal cells were homogenized in RLT buffer (Qiagen) + 1% 2-mercaptoethanol (Sigma-Aldrich). RNA was isolated using the RNeasy Mini or Micro kit (Qiagen). RNA was converted to cDNA using oligo dT priming and SuperScriptIII (Invitrogen). qPCR was performed using iQ SYBR green Supermix and a CFX96 thermal cycler (Bio-rad), followed by thermal melt curve analysis to confirm specific amplification. Primers used in this study were synthesized by Integrated DNA Technologies and are reported in Table S1.
Single-cell RNAseq data acquisition
γδ thymocyte data generation was performed using the standard operating protocol of the Immunological Genome Project Consortium (Immgen.org). Sorted TCRδ+ thymocytes were processed through 10X Chromium (10X Genomics) and cDNA libraries were prepared following the recommended protocol for the Chromium Single Cell 30 Reagent Kit (v2 Chemistry). Post-processing and quality control were performed using the 10X Cell Ranger pipelines (10X Genomics). Estimated number of cells was 3,749 with 1,894 median genes per cell sequenced with 37,384 mean reads per cell. Seurat R package (v2.3.4) was used for further analysis with default parameters applied. TEC populations were sequenced as described before.75 For the analysis of TEC single-cell RNA-Seq data, Seurat R package (v3.2.2) was used with default parameters. Using Seurat, the contribution of cell-cycle to variability was controlled for by regressing out expression of 94 genes previously shown to be associated with cell cycle activity. We performed cluster analysis at a resolution that enabled the identification of the four mTEC subsets, based on expression of selected marker genes.31
QUANTIFICATION AND STATISTICAL ANALYSIS
Statistical analysis of scRNAseq data was performed using R. Summary data from FACS analyses were analyzed in GraphPad Prism software using statistical tests indicated in Figure Legends. The mean of all samples in a group is used to represent the central tendency of the dataset, and all error bars represent SEM of biological replicates. Sample size was not determined prior to experimentation. The exact significance values are stated in all graphs and the number of biological replicates (n) is stated in the Figure Legends. No randomization of experiments was conducted. Experimenters were not blinded during performance or analysis of the experiments.
Supplementary Material
Acknowledgement
We thank C. Freeman and K. Howley for mouse husbandry, K. Nagao (NIH) for sharing unpublished data on skin epithelial transcriptomes, and C. Ruedl (Nanyang Technological University) for anti-Scart2 Ab. Thymocyte scRNAseq data generation and initial data analyses were performed by the ImmGen consortium (NIH grant R24AI072073, C. Benoist, PI, Harvard). This work was supported by NIH (R01 AR071269 to JK; R21 AI143225, R01 AI158832 to JK, AR; R01 AI40098 to JGC).
Footnotes
Declaration of Interests
The authors declare no competing interests.
Inclusion and Diversity
We support inclusive, diverse, and equitable conduct of research.
References
- 1.Kang J, and Malhotra N (2015). Transcription Factor Networks Directing the Development, Function, and Evolution of Innate Lymphoid Effectors. Annu. Rev. Immunol 33, 505–538. DOI: 10.1146/annurev-immunol-032414-112025. [DOI] [PMC free article] [PubMed] [Google Scholar]
- 2.Soltani-Arabshahi R, Wong B, Feng B-J, Goldgar DE, Duffin KC, and Krueger GG (2010). Obesity in Early Adulthood as a Risk Factor for Psoriatic Arthritis. Arch Dermatol 146, 721–726. DOI: 10.1001/archdermatol.2010.141. [DOI] [PubMed] [Google Scholar]
- 3.Naldi L, Conti A, Cazzaniga S, Patrizi A, Pazzaglia M, Lanzoni A, Veneziano L, Pellacani G, and Group, the P.E.R.S. (2014). Diet and physical exercise in psoriasis: a randomized controlled trial. Brit J Dermatol 170, 634–642. DOI: 10.1111/bjd.12735. [DOI] [PubMed] [Google Scholar]
- 4.Trak-Fellermeier MA, Brasche S, Winkler G, Koletzko B, and Heinrich J (2004). Food and fatty acid intake and atopic disease in adults. Eur Respir J 23, 575–582. DOI: 10.1183/09031936.04.00074404. [DOI] [PubMed] [Google Scholar]
- 5.Reboldi A, Dang EV, McDonald JG, Liang G, Russell DW, and Cyster JG (2014). 25-Hydroxycholesterol suppresses interleukin-1–driven inflammation downstream of type I interferon. Science 345, 679–684. DOI: 10.1126/science.1254790. [DOI] [PMC free article] [PubMed] [Google Scholar]
- 6.Pietrocola F, Galluzzi L, Bravo-San Pedro JM, Madeo F, and Kroemer G (2015). Acetyl Coenzyme A: A Central Metabolite and Second Messenger. Cell Metab 21, 805–821. DOI: 10.1016/j.cmet.2015.05.014. [DOI] [PubMed] [Google Scholar]
- 7.Garman RD, Doherty PJ, and Raulet DH (1986). Diversity, rearrangement, and expression of murine T cell gamma genes. Cell 45, 733–742. DOI: 10.1016/0092-8674(86)90787-7. [DOI] [PubMed] [Google Scholar]
- 8.Spidale NA, Sylvia K, Narayan K, Miu B, Frascoli M, Melichar HJ, Zhihao W, Kisielow J, Palin A, Serwold T, et al. (2018). Interleukin-17-Producing γδ T Cells Originate from SOX13+ Progenitors that Are Independent of γδTCR Signaling. Immunity 49, 857–872.e5. DOI: 10.1016/j.immuni.2018.09.010. [DOI] [PMC free article] [PubMed] [Google Scholar]
- 9.Spidale NA, Malhotra N, Frascoli M, Sylvia K, Miu B, Freeman C, Stadinski BD, Huseby E, and Kang J (2020). Neonatal-derived IL-17 producing dermal γδ T cells are required to prevent spontaneous atopic dermatitis. eLife 9, 596–23. DOI: 10.7554/elife.51188. [DOI] [PMC free article] [PubMed] [Google Scholar]
- 10.Malhotra N, Narayan K, Cho OH, Sylvia KE, Yin C, Melichar H, Rashighi M, Lefebvre V, Harris JE, Berg LJ, et al. (2013). A Network of High-Mobility Group Box Transcription Factors Programs Innate Interleukin-17 Production. Immunity 38, 681–693. DOI: 10.1016/j.immuni.2013.01.010. [DOI] [PMC free article] [PubMed] [Google Scholar]
- 11.Emgård J, Kammoun H, García-Cassani B, Chesné J, Parigi SM, Jacob J-M, Cheng H-W, Evren E, Das S, Czarnewski P, et al. (2018). Oxysterol Sensing through the Receptor GPR183 Promotes the Lymphoid-Tissue-Inducing Function of Innate Lymphoid Cells and Colonic Inflammation. Immunity 48, 120–132.e8. DOI: 10.1016/j.immuni.2017.11.020. [DOI] [PMC free article] [PubMed] [Google Scholar]
- 12.Clottu AS, Mathias A, Sailer AW, Schluep M, Seebach JD, Pasquier RD, and Pot C (2017). EBI2 Expression and Function: Robust in Memory Lymphocytes and Increased by Natalizumab in Multiple Sclerosis. CellReports 18, 213–224. DOI: 10.1016/j.celrep.2016.12.006. [DOI] [PubMed] [Google Scholar]
- 13.Cochez PM, Michiels C, Hendrickx E, Dauguet N, Warnier G, Renauld J-C, and Dumoutier L (2017). Ccr6 Is Dispensable for the Development of Skin Lesions Induced by Imiquimod despite its Effect on Epidermal Homing of IL-22–Producing Cells. J Invest Dermatol 137, 1094–1103. DOI: 10.1016/j.jid.2016.12.023. [DOI] [PubMed] [Google Scholar]
- 14.Pereira JP, Kelly LM, Xu Y, and Cyster JG (2009). EBI2 mediates B cell segregation between the outer and centre follicle. Nature 460, 1122–1126. DOI: 10.1038/nature08226. [DOI] [PMC free article] [PubMed] [Google Scholar]
- 15.Li J, Lu E, Yi T, and Cyster JG (2016). EBI2 augments Tfh cell fate by promoting interaction with IL-2-quenching dendritic cells. Nature Publishing Group 533, 110–114. DOI: 10.1038/nature17947. [DOI] [PMC free article] [PubMed] [Google Scholar]
- 16.Baptista AP, Gola A, Huang Y, Milanez-Almeida P, Torabi-Parizi P Jr., J. FU, Shapiro VS, Gerner MY, and Germain RN (2019). The Chemoattractant Receptor Ebi2 Drives Intranodal Naive CD4+ T Cell Peripheralization to Promote Effective Adaptive Immunity. Immunity 50, 1188–1201.e6. DOI: 10.1016/j.immuni.2019.04.001. [DOI] [PubMed] [Google Scholar]
- 17.Hannedouche S, Zhang J, Yi T, Shen W, Nguyen D, Pereira JP, Guerini D, Baumgarten BU, Roggo S, Wen B, et al. (2011). Oxysterols direct immune cell migration via EBI2. Nature 475, 524–527. DOI: 10.1038/nature10280. [DOI] [PMC free article] [PubMed] [Google Scholar]
- 18.Cai Y, Shen X, Ding C, Qi C, Li K, Li X, Jala VR, Zhang H, Wang T, Zheng J, et al. (2011). Pivotal Role of Dermal IL-17-Producing γδ T Cells in Skin Inflammation. Immunity 35, 596–610. DOI: 10.1016/j.immuni.2011.08.001. [DOI] [PMC free article] [PubMed] [Google Scholar]
- 19.Westerterp M, Gautier EL, Ganda A, Molusky MM, Wang W, Fotakis P, Wang N, Randolph GJ, D’Agati VD, Yvan-Charvet L, et al. (2017). Cholesterol Accumulation in Dendritic Cells Links the Inflammasome to Acquired Immunity. Cell Metabolism 25, 1294–1304.e6. DOI: 10.1016/j.cmet.2017.04.005. [DOI] [PMC free article] [PubMed] [Google Scholar]
- 20.Duewell P, Kono H, Rayner KJ, Sirois CM, Vladimer G, Bauernfeind FG, Abela GS, Franchi L, Núñez G, Schnurr M, et al. (2010). NLRP3 inflammasomes are required for atherogenesis and activated by cholesterol crystals. Nature 464, 1357–1361. DOI: 10.1038/nature08938. [DOI] [PMC free article] [PubMed] [Google Scholar]
- 21.Malhotra N, Qi Y, Spidale NA, Frascoli M, Miu B, Cho O, Sylvia K, and Kang J (2018). SOX4 controls invariant NKT cell differentiation by tuning TCR signaling. Journal of Experimental Medicine 215, 2887–2900. DOI: 10.1084/jem.20172021. [DOI] [PMC free article] [PubMed] [Google Scholar]
- 22.Hu B, Jin C, Zeng X, Resch JM, Jedrychowski MP, Yang Z, Desai BN, Banks AS, Lowell BB, Mathis D, et al. (2020). γδ T cells and adipocyte IL-17RC control fat innervation and thermogenesis. Nature 578, 610–614. DOI: 10.1038/s41586-020-2028-z. [DOI] [PMC free article] [PubMed] [Google Scholar]
- 23.Kisielow J, Kopf M, and Karjalainen K (2008). SCART Scavenger Receptors Identify a Novel Subset of Adult γδ T Cells. J Immunol 181, 1710–1716. DOI: 10.4049/jimmunol.181.3.1710. [DOI] [PubMed] [Google Scholar]
- 24.Constantinides MG, Link VM, Tamoutounour S, Wong AC, Perez-Chaparro PJ, Han S-J, Chen YE, Li K, Farhat S, Weckel A, et al. (2019). MAIT cells are imprinted by the microbiota in early life and promote tissue repair. Science 366, eaax6624–16. DOI: 10.1126/science.aax6624. [DOI] [PMC free article] [PubMed] [Google Scholar]
- 25.Scharschmidt TC, Vasquez KS, Pauli ML, Leitner EG, Chu K, Truong H-A, Lowe MM, Rodriguez RS, Ali N, Laszik ZG, et al. (2017). Commensal Microbes and Hair Follicle Morphogenesis Coordinately Drive Treg Migration into Neonatal Skin. Cell Host Microbe 21, 467–477.e5. DOI: 10.1016/j.chom.2017.03.001. [DOI] [PMC free article] [PubMed] [Google Scholar]
- 26.Mabuchi T, Singh TP, Takekoshi T, Jia G, Wu X, Kao MC, Weiss I, Farber JM, and Hwang ST (2013). CCR6 is required for epidermal trafficking of γδ T cells in an IL-23-induced model of psoriasiform dermatitis. J Investigative Dermatology 133, 164–171. DOI: 10.1038/jid.2012.260. [DOI] [PMC free article] [PubMed] [Google Scholar]
- 27.Ki S, Thyagarajan HM, Hu Z, Lancaster JN, and Ehrlich LIR (2017). EBI2 contributes to the induction of thymic central tolerance in mice by promoting rapid motility of medullary thymocytes. Eur. J. Immunol 47, 1906–1917. DOI: 10.1002/eji.201747020. [DOI] [PMC free article] [PubMed] [Google Scholar]
- 28.Nitta T, Muro R, Shimizu Y, Nitta S, Oda H, Ohte Y, Goto M, Takanashi RY, Narita T, Takayanagi H, et al. (2015). The thymic cortical epithelium determines the TCRrepertoire of IL-17-producing γδT cells. EMBO Rep 16, 638–653. DOI: 10.15252/embr.201540096. [DOI] [PMC free article] [PubMed] [Google Scholar]
- 29.Mair F, Joller S, Hoeppli R, Onder L, Hahn M, Ludewig B, Waisman A, and Becher B (2015). The NFκB-inducing kinase is essential for the developmental programming of skin-resident and IL-17-producing γδ T cells. eLife 4, e10087. DOI: 10.7554/elife.10087. [DOI] [PMC free article] [PubMed] [Google Scholar]
- 30.Kelly LM, Pereira JP, Yi T, Xu Y, and Cyster JG (2011). EBI2 Guides Serial Movements of Activated B Cells and Ligand Activity Is Detectable in Lymphoid and Nonlymphoid Tissues. J Immunol 187, 3026–3032. DOI: 10.4049/jimmunol.1101262. [DOI] [PMC free article] [PubMed] [Google Scholar]
- 31.Bornstein C, Nevo S, Giladi A, Kadouri N, Pouzolles M, Gerbe F, David E, Machado A, Chuprin A, Tóth B, et al. (2018). Single-cell mapping of the thymic stroma identifies IL-25-producing tuft epithelial cells. Nature 559, 622–626. DOI: 10.1038/s41586-018-0346-1. [DOI] [PubMed] [Google Scholar]
- 32.Lkhagvasuren E, Sakata M, Ohigashi I, and Takahama Y (2013). Lymphotoxin β Receptor Regulates the Development of CCL21-Expressing Subset of Postnatal Medullary Thymic Epithelial Cells. J Immunol 190, 5110–5117. DOI: 10.4049/jimmunol.1203203. [DOI] [PubMed] [Google Scholar]
- 33.Miller CN, Proekt I, Moltke J, Wells KL, Rajpurkar AR, Wang H, Rattay K, Khan IS, Metzger TC, Pollack JL, et al. (2018). Thymic tuft cells promote an IL-4-enriched medulla and shape thymocyte development. Nature Publishing Group 559, 1–23. DOI: 10.1038/s41586-018-0345-2. [DOI] [PMC free article] [PubMed] [Google Scholar]
- 34.Park J-E, Botting RA, Conde CD, Popescu D-M, Lavaert M, Kunz DJ, Goh I, Stephenson E, Ragazzini R, Tuck E, et al. (2020). A cell atlas of human thymic development defines T cell repertoire formation. Science 367, eaay3224–12. DOI: 10.1126/science.aay3224. [DOI] [PMC free article] [PubMed] [Google Scholar]
- 35.Park K, and Scott AL (2010). Cholesterol 25-hydroxylase production by dendritic cells and macrophages is regulated by type I interferons. Journal of Leukocyte Biology 88, 1081–1087. DOI: 10.1189/jlb.0610318. [DOI] [PMC free article] [PubMed] [Google Scholar]
- 36.Sakamoto K, Jin S-P, Goel S, Jo J-H, Voisin B, Kim D, Nadella V, Liang H, Kobayashi T, Huang X, et al. (2021). Disruption of the endopeptidase ADAM10-Notch signaling axis leads to skin dysbiosis and innate lymphoid cell-mediated hair follicle destruction. Immunity. DOI: 10.1016/j.immuni.2021.09.001. [DOI] [PMC free article] [PubMed] [Google Scholar]
- 37.Joost S, Zeisel A, Jacob T, Sun X, Manno GL, Lönnerberg P, Linnarsson S, and Kasper M (2016). Single-Cell Transcriptomics Reveals that Differentiation and Spatial Signatures Shape Epidermal and Hair Follicle Heterogeneity. Cell Systems 3, 221–237.e9. DOI: 10.1016/j.cels.2016.08.010. [DOI] [PMC free article] [PubMed] [Google Scholar]
- 38.Sumaria N, Roediger B, Ng LG, Qin J, Pinto R, Cavanagh LL, Shklovskaya E, de S. Groth BF, Triccas JA, and Weninger W (2011). Cutaneous immunosurveillance by self-renewing dermal γδ T cells. Journal of Experimental Medicine 208, 505–518. DOI: 10.1084/jem.20101824. [DOI] [PMC free article] [PubMed] [Google Scholar]
- 39.Ceglia S, Berthelette A, Howley K, Li Y, Mortzfeld B, Bhattarai SK, Yiew NKH, Xu5 Y, Brink R, Cyster JG, et al. An epithelial cell-derived metabolite tunes immunoglobulin A secretion by gut resident plasma cells. Nat Immunol, in press [DOI] [PMC free article] [PubMed] [Google Scholar]
- 40.Gray EE, Ramírez-Valle F, Xu Y, Wu S, Wu Z, Karjalainen KE, and Cyster JG (2013). Deficiency in IL-17-committed Vγ4(+) γδ T cells in a spontaneous Sox13-mutant CD45.1(+) congenic mouse substrain provides protection from dermatitis. Nat Immunol 14, 584–592. DOI: 10.1038/ni.2585. [DOI] [PMC free article] [PubMed] [Google Scholar]
- 41.Nakamizo S, Honda T, Adachi A, Nagatake T, Kunisawa J, Kitoh A, Otsuka A, Dainichi T, Nomura T, Ginhoux F, et al. (2017). High fat diet exacerbates murine psoriatic dermatitis by increasing the number of IL-17-producing γδ T cells. Scientific Reports 7, 14076–13. DOI: 10.1038/s41598-017-14292-1. [DOI] [PMC free article] [PubMed] [Google Scholar]
- 42.Jensen P, and Skov L (2017). Psoriasis and Obesity. Dermatology 232, 633–639. DOI: 10.1159/000455840. [DOI] [PubMed] [Google Scholar]
- 43.Gold ES, Diercks AH, Podolsky I, Podyminogin RL, Askovich PS, Treuting PM, and Aderem A (2014). 25-Hydroxycholesterol acts as an amplifier of inflammatory signaling. Proceedings of the National Academy of Sciences 111, 10666–10671. DOI: 10.1073/pnas.1404271111. [DOI] [PMC free article] [PubMed] [Google Scholar]
- 44.Bensinger SJ, Bradley MN, Joseph SB, Zelcer N, Janssen EM, Hausner MA, Shih R, Parks JS, Edwards PA, Jamieson BD, et al. (2008). LXR Signaling Couples Sterol Metabolism to Proliferation in the Acquired Immune Response. Cell 134, 97–111. DOI: 10.1016/j.cell.2008.04.052. [DOI] [PMC free article] [PubMed] [Google Scholar]
- 45.Kidani Y, Elsaesser H, Hock MB, Vergnes L, Williams KJ, Argus JP, Marbois BN, Komisopoulou E, Wilson EB, Osborne TF, et al. (2013). Sterol regulatory element–binding proteins are essential for the metabolic programming of effector T cells and adaptive immunity. Nat Immunol 14, 489–499. DOI: 10.1038/ni.2570. [DOI] [PMC free article] [PubMed] [Google Scholar]
- 46.Chen HW, Heiniger HJ, and Kandutsch AA (1975). Relationship between sterol synthesis and DNA synthesis in phytohemagglutinin-stimulated mouse lymphocytes. Proc National Acad Sci 72, 1950–1954. DOI: 10.1073/pnas.72.5.1950. [DOI] [PMC free article] [PubMed] [Google Scholar]
- 47.Chakrabarti R, and Engleman EG (1991). Interrelationships between mevalonate metabolism and the mitogenic signaling pathway in T lymphocyte proliferation. J Biol Chem 266, 12216–12222. DOI: 10.1016/s0021-9258(18)98884-8. [DOI] [PubMed] [Google Scholar]
- 48.Wang F, Beck-García K, Zorzin C, Schamel WWA, and Davis MM (2016). Inhibition of T cell receptor signaling by cholesterol sulfate, a naturally occurring derivative of membrane cholesterol. Nat Immunol 17, 844–850. DOI: 10.1038/ni.3462. [DOI] [PMC free article] [PubMed] [Google Scholar]
- 49.Lim SA, Su W, Chapman NM, and Chi H (2022). Lipid metabolism in T cell signaling and function. Nat Chem Biol 18, 470–481. DOI: 10.1038/s41589-022-01017-3. [DOI] [PMC free article] [PubMed] [Google Scholar]
- 50.Bensinger SJ, and Tontonoz P (2008). Integration of metabolism and inflammation by lipid-activated nuclear receptors. Nature 454, 470–477. DOI: 10.1038/nature07202. [DOI] [PubMed] [Google Scholar]
- 51.Lopes N, McIntyre C, Martin S, Raverdeau M, Sumaria N, Kohlgruber AC, Fiala GJ, Agudelo LZ, Dyck L, Kane H, et al. (2020). Distinct metabolic programs established in the thymus control effector functions of γδ T cell subsets in tumor microenvironments. Nat Immunol, 1–30. DOI: 10.1038/s41590-020-00848-3. [DOI] [PMC free article] [PubMed] [Google Scholar]
- 52.Cuthbert JA, and Lipsky PE (1987). Provision of cholesterol to lymphocytes by high density and low density lipoproteins. Requirement for low density lipoprotein receptors. J Biol Chem 262, 7808–7818. DOI: 10.1016/s0021-9258(18)47640-5. [DOI] [PubMed] [Google Scholar]
- 53.Cuthbert JA, and Lipsky PE (1984). Modulation of human lymphocyte responses by low density lipoproteins (LDL): enhancement but not immunosuppression is mediated by LDL receptors. Proc National Acad Sci 81, 4539–4543. DOI: 10.1073/pnas.81.14.4539. [DOI] [PMC free article] [PubMed] [Google Scholar]
- 54.Morse JH, Witte LD, and Goodman DS (1977). Inhibition of lymphocyte proliferation stimulated by lectins and allogeneic cells by normal plasma lipoproteins. J Exp Medicine 146, 1791–1803. DOI: 10.1084/jem.146.6.1791. [DOI] [PMC free article] [PubMed] [Google Scholar]
- 55.Zhou X, Paulsson G, Stemme S, and Hansson GK (1998). Hypercholesterolemia is associated with a T helper (Th) 1/Th2 switch of the autoimmune response in atherosclerotic apo E-knockout mice. J Clin Invest 101, 1717–1725. DOI: 10.1172/jci1216. [DOI] [PMC free article] [PubMed] [Google Scholar]
- 56.Robertson A-KL, Zhou X, Strandvik B, and Hansson GK (2004). Severe Hypercholesterolaemia Leads to Strong Th2 Responses to an Exogenous Antigen. Scand J Immunol 59, 285–293. DOI: 10.1111/j.0300-9475.2004.01403.x. [DOI] [PubMed] [Google Scholar]
- 57.Zhou X, Johnston TP, Johansson D, Parini P, Funa K, Svensson J, and Hansson GK (2007). Hypercholesterolemia leads to elevated TGF-beta1 activity and T helper 3-dependent autoimmune responses in atherosclerotic mice. Atherosclerosis 204, 381–387. DOI: 10.1016/j.atherosclerosis.2008.10.017. [DOI] [PubMed] [Google Scholar]
- 58.Chyu K-Y, Lio WM, Dimayuga PC, Zhou J, Zhao X, Yano J, Trinidad P, Honjo T, Cercek B, and Shah PK (2014). Cholesterol Lowering Modulates T Cell Function In Vivo and In Vitro. Plos One 9, e92095. DOI: 10.1371/journal.pone.0092095. [DOI] [PMC free article] [PubMed] [Google Scholar]
- 59.Naik S, Bouladoux N, Wilhelm C, Molloy MJ, Salcedo R, Kastenmuller W, Deming C, Quinones M, Koo L, Conlan S, et al. (2012). Compartmentalized control of skin immunity by resident commensals. Science 337, 1115–1119. DOI: 10.1126/science.1225152. [DOI] [PMC free article] [PubMed] [Google Scholar]
- 60.Förster R, Schubel A, Breitfeld D, Kremmer E, Renner-Müller I, Wolf E, and Lipp M (1999). CCR7 coordinates the primary immune response by establishing functional microenvironments in secondary lymphoid organs. Cell 99, 23–33. DOI: 10.1016/s0092-8674(00)80059-8. [DOI] [PubMed] [Google Scholar]
- 61.Förster R, Mattis AE, Kremmer E, Wolf E, Brem G, and Lipp M (1996). A putative chemokine receptor, BLR1, directs B cell migration to defined lymphoid organs and specific anatomic compartments of the spleen. Cell 87, 1037–1047. DOI: 10.1016/s0092-8674(00)81798-5. [DOI] [PubMed] [Google Scholar]
- 62.Bannard O, Horton RM, Allen CDC, An J, Nagasawa T, and Cyster JG (2013). Germinal Center Centroblasts Transition to a Centrocyte Phenotype According to a Timed Program and Depend on the Dark Zone for Effective Selection. Immunity 39, 912–924. DOI: 10.1016/j.immuni.2013.08.038. [DOI] [PMC free article] [PubMed] [Google Scholar]
- 63.Green JA, Suzuki K, Cho B, Willison LD, Palmer D, Allen CDC, Schmidt TH, Xu Y, Proia RL, Coughlin SR, et al. (2011). The sphingosine 1-phosphate receptor S1P2 maintains the homeostasis of germinal center B cells and promotes niche confinement. Nat Immunol 12, 672–680. DOI: 10.1038/ni.2047. [DOI] [PMC free article] [PubMed] [Google Scholar]
- 64.Muppidi JR, Schmitz R, Green JA, Xiao W, Larsen AB, Braun SE, An J, Xu Y, Rosenwald A, Ott G, et al. (2014). Loss of signalling via Gα13 in germinal centre B-cell-derived lymphoma. Nature 516, 254–258. DOI: 10.1038/nature13765. [DOI] [PMC free article] [PubMed] [Google Scholar]
- 65.Wang X, Sumida H, and Cyster JG (2014). GPR18 is required for a normal CD8αα intestinal intraepithelial lymphocyte compartment. J Exp Medicine 211, 2351–2359. DOI: 10.1084/jem.20140646. [DOI] [PMC free article] [PubMed] [Google Scholar]
- 66.Reboldi A, Arnon TI, Rodda LB, Atakilit A, Sheppard D, and Cyster JG (2016). IgA production requires B cell interaction with subepithelial dendritic cells in Peyers patches. Science 352, aaf4822–aaf4822. DOI: 10.1126/science.aaf4822. [DOI] [PMC free article] [PubMed] [Google Scholar]
- 67.Parrot T, Gorin J-B, Ponzetta A, Maleki KT, Kammann T, Emgård J, Perez-Potti A, Sekine T, Rivera-Ballesteros O, Gredmark-Russ S, et al. (2020). MAIT cell activation and dynamics associated with COVID-19 disease severity. Sci Immunol 5, eabe1670. DOI: 10.1126/sciimmunol.abe1670. [DOI] [PMC free article] [PubMed] [Google Scholar]
- 68.Reynolds G, Vegh P, Fletcher J, Poyner EFM, Stephenson E, Goh I, Botting RA, Huang N, Olabi B, Dubois A, et al. (2021). Developmental cell programs are co-opted in inflammatory skin disease. Science 371. DOI: 10.1126/science.aba6500. [DOI] [PMC free article] [PubMed] [Google Scholar]
- 69.Tan L, Fichtner AS, Bruni E, Odak I, Sandrock I, Bubke A, Borchers A, Schultze-Florey C, Koenecke C, Förster R, et al. (2021). A fetal wave of human type 3 effector γδ cells with restricted TCR diversity persists into adulthood. Sci. Immunol 6. DOI: 10.1126/sciimmunol.abf0125. [DOI] [PubMed] [Google Scholar]
- 70.Tsoi LC, Stuart PE, Tian C, Gudjonsson JE, Das S, Zawistowski M, Ellinghaus E, Barker JN, Chandran V, Dand N, et al. (2017). Large scale meta-analysis characterizes genetic architecture for common psoriasis associated variants. Nat Commun 8, 15382. DOI: 10.1038/ncomms15382. [DOI] [PMC free article] [PubMed] [Google Scholar]
- 71.Jostins L, Ripke S, Weersma RK, Duerr RH, McGovern DP, Hui KY, Lee JC, Schumm LP, Sharma Y, Anderson CA, et al. (2012). Host-microbe interactions have shaped the genetic architecture of inflammatory bowel disease. Nature 491, 119–124. DOI: 10.1038/nature11582. [DOI] [PMC free article] [PubMed] [Google Scholar]
- 72.Heinig M, Petretto E, Wallace C, Bottolo L, Rotival M, Lu H, Li Y, Sarwar R, Langley SR, Bauerfeind A, et al. (2010). A trans-acting locus regulates an anti-viral expression network and type 1 diabetes risk. Nature 467, 460–464. DOI: 10.1038/nature09386. [DOI] [PMC free article] [PubMed] [Google Scholar]
- 73.Blanc M, Hsieh WY, Robertson KA, Kropp KA, Forster T, Shui G, Lacaze P, Watterson S, Griffiths SJ, Spann NJ, et al. (2012). The Transcription Factor STAT-1 Couples Macrophage Synthesis of 25-Hydroxycholesterol to the Interferon Antiviral Response. Immunity 38, 1–13. DOI: 10.1016/j.immuni.2012.11.004. [DOI] [PMC free article] [PubMed] [Google Scholar]
- 74.Muzaki ARBM, Soncin I, Setiagani YA, Sheng J, Tetlak P, Karjalainen K, and Ruedl C (2017). Long-Lived Innate IL-17-Producing γ/δ T Cells Modulate Antimicrobial Epithelial Host Defense in the Colon. J Immunol 199, 3691–3699. DOI: 10.4049/jimmunol.1701053. [DOI] [PubMed] [Google Scholar]
- 75.Cowan JE, Malin J, Zhao Y, Seedhom MO, Harly C, Ohigashi I, Kelly M, Takahama Y, Yewdell JW, Cam M, et al. (2019). Myc controls a distinct transcriptional program in fetal thymic epithelial cells that determines thymus growth. Nature Communications 10, 5498–14. DOI: 10.1038/s41467-019-13465-y. [DOI] [PMC free article] [PubMed] [Google Scholar]
- 76.Butler A, Hoffman P, Smibert P, Papalexi E, and Satija R (2018). Integrating single-cell transcriptomic data across different conditions, technologies, and species. Nat Biotechnol 36, 411–420. DOI: 10.1038/nbt.4096. [DOI] [PMC free article] [PubMed] [Google Scholar]
- 77.Stuart T, Butler A, Hoffman P, Hafemeister C, Papalexi E,, M. WM III, Hao Y, Stoeckius M, Smibert P, and Satija R (2019). Comprehensive Integration of Single-Cell Data. Cell 177, 1–37. DOI: 10.1016/j.cell.2019.05.031. [DOI] [PMC free article] [PubMed] [Google Scholar]
- 78.Gatto D, Wood K, Caminschi I, Murphy-Durland D, Schofield P, Christ D, Karupiah G, and Brink R (2013). The chemotactic receptor EBI2 regulates the homeostasis, localization and immunological function of splenic dendritic cells. Nat Immunol 14, 446–453. DOI: 10.1038/ni.2555. [DOI] [PubMed] [Google Scholar]
- 79.Penzo-Méndez A, Dy P, Pallavi B, and Lefebvre V (2007). Generation of mice harboring a Sox4 conditional null allele. Genesis 45, 776–780. DOI: 10.1002/dvg.20358. [DOI] [PubMed] [Google Scholar]
- 80.Kobayashi T, Voisin B, Kim DY, Kennedy EA, Jo J-H, Shih H-Y, Truong A, Doebel T, Sakamoto K, Cui C-Y, et al. (2019). Homeostatic Control of Sebaceous Glands by Innate Lymphoid Cells Regulates Commensal Bacteria Equilibrium. Cell 176, 982–997.e16. DOI: 10.1016/j.cell.2018.12.031. [DOI] [PMC free article] [PubMed] [Google Scholar]
- 81.Trindade BC, Ceglia S, Berthelette A, Raso F, Howley K, Muppidi JR, and Reboldi A (2021). The cholesterol metabolite 25-hydroxycholesterol restrains the transcriptional regulator SREBP2 and limits intestinal IgA plasma cell differentiation. Immunity 54, 2273–2287.e6. DOI: 10.1016/j.immuni.2021.09.004. [DOI] [PMC free article] [PubMed] [Google Scholar]
Associated Data
This section collects any data citations, data availability statements, or supplementary materials included in this article.
Supplementary Materials
Data Availability Statement
Single-cell RNAseq data γδ thymocytes have been deposited at GEO and are publicly available as of the date of publication. Accession numbers are listed in the key resources table. This paper analyzes existing, publicly available single-cell RNAseq data of TEC subsets. The accession number for this dataset is listed in the key resources table. Microscopy data reported in this paper will be shared by the lead contact upon request. Any additional information required to reanalyze the data reported in this paper is available from the lead contact upon request. This paper does not report original code.
KEY RESOURCES TABLE
| REAGENT or RESOURCE | SOURCE | IDENTIFIER |
|---|---|---|
| Antibodies | ||
| Syrian Hamster anti-mouse CD3e Biotin | eBioscience | Cat#13003382 RRID:AB_1470754 |
| Rat anti-mouse CD8α Biotin | Biolegend | Cat#100704 RRID:AB_312743 |
| Rat anti-mouse CD11b Biotin | Biolegend | Cat#101204 RRID:AB_312787 |
| Armenian Hamster anti-mouse CD11c Biotin | eBioscience | Cat#13011485 RRID:AB_466363 |
| Rat anti-mouse CD19 Biotin | BD Biosciences | Cat#553784 RRID:AB_395048 |
| Rat anti-mouse Gr-1 Biotin | Biolegend | Cat#108404 RRID:AB_313369 |
| Mouse anti-mouse NK1.1 Biotin | Biolegend | Cat#108704 RRID:AB_313391 |
| Rat anti-mouse Ter-119 Biotin | BD Biosciences | Cat#553672 RRID:AB_394985 |
| Armenian Hamster anti-mouse TCRβ Biotin | eBioscience | Cat#13596185 RRID:AB_466820 |
| Armenian Hamster anti-mouse TCRγ/δ Biotin | Biolegend | Cat#118103 RRID:AB_313827 |
| Rat anti-mouse CD4 Biotin | eBioscience | Cat#13004385 RRID:AB_466334 |
| Armenian Hamster anti-mouse TCRβ BV605 | Biolegend | Cat#109241 RRID:AB_2629563 |
| Armenian Hamster anti-mouse TCRγ/δ PerCP-eFluor 710 | eBioscience | Cat#46571182 RRID:AB_2016707 |
| Armenian Hamster anti-mouse Vγ2 PE-Cy7 | eBioscience | Cat#25582882 RRID:AB_2573474 |
| Armenian Hamster anti-mouse Vγ1.1 BV421 | BD Biosciences | Cat#566308 RRID:AB_2739676 |
| Rat anti-mouse CD24 BV605 | Biolegend | Cat#101827 RRID:AB_2563464 |
| Rat anti-mouse CCR6 Alexa Fluor 647 | BD Biosciences | Cat#557976 RRID:AB_2228793 |
| Armenian Hamster anti-mouse CD27 PE | eBioscience | Cat#12027183 RRID:AB_465615 |
| Rat anti-mouse CD4 BV650 | Biolegend | Cat#100546 RRID:AB_2562098 |
| Rat anti-mouse CD44 BV711 | Biolegend | Cat#103057 RRID:AB_2564214 |
| Rat anti-mouse IL-17A PerCPCy5.5 | eBioscience | Cat#45717782 RRID:AB_925753 |
| Rat anti-mouse IFNγ PE | Biolegend | Cat#505808 RRID:AB_315402 |
| Rat anti-mouse CD8β APC/Cyanine7 | Biolegend | Cat#126620 RRID:AB_2563951 |
| Rat anti-mouse CD45 BV785 | Biolegend | Cat#103149 RRID:AB_2564590 |
| Rat anti-mouse CD49f FITC | Biolegend | Cat#313606 RRID:AB_345300 |
| Rat anti-mouse Sca-1 BV605 | Biolegend | Cat#108134 RRID:AB_2650926 |
| Rat anti-mouse CD71 PE-Cy7 | Biolegend | Cat#113811 RRID:AB_2203383 |
| Rat anti-mouse CD326 PE | Biolegend | Cat#118206 RRID:AB_1134172 |
| Rat anti-mouse CD326 PE-Cy7 | Biolegend | Cat#118216 RRID:AB_1236471 |
| Rat anti-mouse I-A/I-E APC | Biolegend | Cat#107614 RRID:AB_313329 |
| Armenian Hamster anti-mouse CD80 PerCPCy5.5 | Biolegend | Cat#104721 RRID:AB_893406 |
| Rat anti-mouse Ly51 FITC | Biolegend | Cat#108305 RRID:AB_313362 |
| Rat anti-mouse CD104 PE | Biolegend | Cat#123610 RRID:AB_2563544 |
| UEA-1 biotin | Vector Labs | Cat#B1065 RRID:AB_2336766 |
| Rat anti-mouse Scart2 | J. Kisielow | Cloned hybridoma 25A2 |
| Goat anti-Rat IgG PE | Southern Biotech | Cat#305009 RRID:AB_2795834 |
| Rat anti-mouse Anti-CD16/32 | Biolegend | Cat#101330 RRID:AB_2561482 |
| Rabbit anti-GFP | Invitrogen | Cat#A11122 |
| Rabbit anti-RFP | Rockland | Cat#600401379 RRID:AB_11182807 |
| Rat anti-mouse SCART2 Alexa Fluor 647 | Muzaki et al.74 | Cloned hybridoma 41G1 |
| Rat anti-mouse AIRE Alexa Fluor 488 | eBioscience | Cat#53593480 RRID:AB_10852560 |
| Cy3-conjugated donkey anti-rabbit | Jackson ImmunoResearch Laboratories | Cat#711165152 RRID:AB_2307443 |
| Streptavidin Alexa Fluor 450 | eBioscience | Cat#48431782 RRID:AB_10359737 |
| Chemicals, peptides, and recombinant proteins | ||
| Fetal Bovine Serum | Sigma-Aldrich | Cat#F0926 |
| Phorbol 12-myristate 13-acetate (PMA) | LC Laboratories | Cat#P-1680 |
| Ionomycin Calcium Salt | Sigma-Aldrich | Cat#I3909 |
| GolgiStop (Monensin) | BD Biosciences | Cat#512301KZ |
| GolgiPlug (Brefeldin A) | BD Biosciences | Cat#512092KZ |
| DNase I, grade II | Roche | Cat#10104159001 |
| Liberase TL | Roche | Cat#05401020001 |
| Liberase TM | Roche | Cat#05401119001 |
| Hylauronidase | Sigma-Aldrich | Cat#H3506 |
| Trizol | Ambion Life Technologies | Cat#15596018 |
| Tamoxifen | Sigma-Aldrich | Cat#T5648 |
| Peanut Oil | Sigma-Aldrich | Cat#P2144 |
| Hepes (1 M) | Gibco | Cat#15630080 |
| 0.25% Trypsin in HBSS w/o Calcium and Magnesium | Corning | Cat#25050CI |
| EDTA 500mM, pH 8.0 | Teknova | Cat#E036 |
| RLT buffer (RNeasy Lysis Buffer) | Qiagen | Cat#79216 |
| 2-mercaptoethanol | Sigma-Aldrich | Cat#6250 |
| Percoll | GE Healthcare | Cat#17089101 |
| DAPI | Sigma Aldrich | Cat#D9542 |
| 7α,25-dihydroxycholesterol | Avanti Polar Lipids | Cat#700080P |
| 25-hydroxycholesterol | Avanti Polar Lipids | Cat#700019P |
| Imiquimod Cream 5% | Perrigo | Cat#45802036862 NDC#45802036862 |
| Critical commercial assays | ||
| Cytofix/Cytoperm Fixation/Permeabilization Kit | BD Biosciences | Cat#554714 |
| Fixable Viability Dye eFluor 780 | eBioscience | Cat#65086514 |
| Fixable Viability Dye eFluor 506 | eBioscience | Cat#65086618 |
| RNeasy Micro kit | Qiagen | Cat#74004 |
| RNeasy Mini kit | Qiagen | Cat#74104 |
| SuperScript First-Strand Synthesis System for RT-PCR | Invitrogen | Cat#11904018 |
| iQ SYBR green Supermix | Bio-Rad | Cat#1725270 |
| Fluoromount-G | SouthernBiotech | Cat#0100–01 |
| Deposited data | ||
| Single-cell RNA Sequencing of γδ thymocytes | This Paper | GEO: GSE221488 |
| Single-cell RNA Sequencing of TEC subsets | Cowan et al.75 | GEO: GSE131368 |
| Experimental models: Cell Lines | ||
| M12-EBI2-GFP | Gift from J. Cyster | Kelly et al.30 |
| Human Embryonic Kidney Cells (HEK293T) | ATCC | Cat#CRL-3216 |
| Experimental models: Organisms/strains | ||
| Mouse: C57BL/6J | The Jackson Laboratory | 000664 |
| Mouse: Ccr6−/− | The Jackson Laboratory | 005793 |
| Mouse: Ch25h−/− | The Jackson Laboratory | 016263 |
| Mouse: TcrdCre/ERT2 | The Jackson Laboratory | 031679 |
| Mouse: Foxn1Cre | The Jackson Laboratory | 018448 |
| Mouse: RorcCre | The Jackson Laboratory | 022791 |
| Mouse: Krt5Cre/ERT2 | The Jackson Laboratory | 029155 |
| Mouse: Sox4Egfp | MMRRC | 030033-UCD |
| Mouse: Gpr183+/Egfp | Pereira et al.14 | N/A |
| Mouse: Gpr183fl/fl | Pereira et al.14 | N/A |
| Mouse: Sox4fl/fl | Malhotra et al.21 | N/A |
| Mouse: Ch25hfl/fl | Ceglia et al.39 | N/A |
| Mouse: Ch25htdTom | This paper | N/A |
| Oligonucleotides | ||
| See Table S1 for list of quantitative RT-PCR primers | N/A | N/A |
| Recombinant DNA | ||
| MSCV-IRES-Thy1.1 | Addgene | ID: 17442 |
| Software and algorithims | ||
| FlowJo v10.8 software | Tree Star | https://www.flowjo.com/solutions/flowjo/downloads |
| FACSDiva v7.0 software | BD | https://www.bdbiosciences.com/en-us/products/software/instrument-software/bdfacsdiva-software |
| ZEN 3.1 | Carl Zeiss Microscopy | https://www.zeiss.com/microscopy/en/products/software/zeiss-zen.html |
| Adobe Illustrator 2022 | Adobe Systems | N/A |
| ImageJ | NIH | https://imagej.nih.gov/ij/ |
| Prism 9 | GraphPad Software | https://www.graphpad.com/scientificsoftware/prism/ |
| Seurat R v2.3 | Butler et al.76 | https://satijalab.org/seurat/ |
| Seurat R v3.2 | Stuart et al.77 | https://satijalab.org/seurat/ |
| Other | ||
| Standard chow diet (Prolab IsoPro RMH 3000) | LabDiet | 5P76 |
| 2% high cholesterol diet | Envigo | TD.200179 |