

Abstract
Background
Neural tube defects are a type of congenital anomaly caused by an abnormality in the development of the brain and spinal cord during embryogenesis. They cause high rates of mortality, morbidity, and lifelong disability. There are several studies carried out worldwide reporting different findings on the burden and associated factors. The aim of this study is to carry out a systematic review and meta-analysis of the burden of neural tube defects and their associated factors in Africa.
Methods
A total of 58 eligible articles were identified systematically using databases such as PubMed, Embase, African Journal Online Library, ProQuest, Cochrane, Google Scopus, Google Scholar, and Grey literature. Extracted data were analyzed using STATA 16.0 statistical software. The heterogeneity of studies was determined using the Cochrane Q test statistic and I2 test statistics with forest plots. A random effects model was used to examine the pooled burden of neural tube defects, subgroups of the region, subtypes of NTDs, sensitivity analysis, and publication bias. The association between NTDs and associated factors was studied using a fixed-effect model.
Results
Fifty-eight studies with a total of 7,150,654 participants in 16 African countries revealed that the pooled burden of neural tube defects was 32.95 per 10,000 births (95% CI: 29.77-36.13). The Eastern African region had the highest burden in the subgroup analysis, with 111.13 per 10,000 births (95% CI: 91.85–130.42). South African countries had the lowest burden, at 11.43 per 10,000 births (95% CI: 7.51–15.34). In subtype analysis, spina bifida had the highest pooled burden at 17.01 per 10,000 births (95 percent CI: 15.00-19.00), while encephalocele had the lowest at 1.66 per 10,000 births (95% CI: 1.12-2.20). Maternal folic acid supplementation (AOR: 0.38; 95% CI: 0.16-0.94), alcohol consumption (AOR: 2.54; 95% CI: 1.08-5.96), maternal age (AOR: 3.54; 95% CI: 1.67-7.47), pesticide exposure (AOR: 2.69; 95% CI: 1.62-4.46), X-ray radiation (AOR: 2.67; 95% CI: 1.05-6.78), and history of stillbirth (AOR: 3.18; 95% CI: 1.11-9.12) were significantly associated with NTDs.
Conclusion
The pooled burden of NTDs in Africa was found to be high. Maternal age, alcohol consumption, pesticide and X-ray radiation exposure, history of stillbirth, and folic acid supplementation were significantly associated with NTDs.
1. Introduction
Neural tube defects (NTDs) are a type of congenital anomaly caused by an abnormality in the development of the brain and spinal cord during embryogenesis [1], with nearly 300,000 cases worldwide annually [2]. The effects they cause in Africa are substantial. NTDs are the world's second most common birth defect (1 in 1000 live births) [3], with the highest rates in northern China (3.7/1000 live births) and Ireland (1.6 per 1000 live births) [4].
The prevalence and etiology of NTDs vary by population [5]. The rate of occurrence increases from the west to the east coast in the United States, with the Appalachian region having the highest frequency [3, 4, 6]. NTD affects approximately 1-3 per 1000 births in Africa each year [7]. The prevalence of NTD in Ghana is 1.6 per 1000 live births [8].
In Ethiopia, variable outcomes ranging from 30.87 to 42.5 per 1000 births were reported on the prevalence of neural tube defects. Improved maternal health, preconception care, folic acid supplementation, and routine fetal anomaly scanning may all help to detect congenital anomalies earlier in pregnancy. Permanent epidemiological surveillance is required to determine the true prevalence at the national and temporal trend levels [9–11].
2. Methods
2.1. Search Strategy
An inclusive review and meta-analysis were undertaken on the burden and related factors of NTDs in Africa, using both published and unpublished material, regardless of publication period. The databases used to search for relevant studies were PubMed, Cochrane Library, Embase, AJOL, Google Scopus, ProQuest, Google Scholar, and other sources. The reference lists of each incorporated article were also searched manually to optimize the search strategy. The entire database will be systematically searched from December 1, 2021 to February 15, 2022.
The key terms used for the search were (((“prevalence” [All Fields]) OR (“prevalence” [MeSH Terms]) OR (“burden” [All Fields]) OR (“burden” [MeSH Terms]) OR (“epidemiology” [All Fields]))))))))) “neural tube defects” [All Fields]) OR “birth defects” [All Fields]) OR “congenital malformation” [All Fields]) OR “congenital anomalies” [All Fields])) (additional file 1). The systematic review and meta-analysis were conducted in agreement with the Preferred Reporting Items for Systematic reviews and Meta-Analyses (PRISMA) guideline (additional file 2) [12].
2.2. Criteria for Considering Studies
Any study in Africa that met the criteria and included relevant extractable data on the burden and associated factors of NTDs was included.
2.2.1. Study Area
All of the researches were conducted in African countries.
2.2.2. Study Design
This systemic review and meta-analysis comprised of observational studies (cross-sectional, case-control, and cohort) that reported on the burden and associated variables of NTDs.
2.2.3. Language
Both published and unpublished articles in the English language were included.
2.2.4. Population
Studies conducted among newborn babies were considered.
2.3. Exclusion Criteria
Irrelevant articles with missing data, duplicate studies, case reports, conference proceedings, and studies in which NTDs were not clearly reported separately excluded after reviewing their full-texts.
2.4. Selection of Study
Relevant articles were identified from the aforementioned databases and imported into Mendeley reference manager software X1.19.4 to eliminate duplicate studies. The retrieved studies were also imported into Review Manager Version 5 for evaluation of associated factors. The titles, abstracts, and full-texts of the retrieved articles were independently reviewed by two review authors Reta Wakoya (RW) and Mekbeb Afework (MA). Any disagreements between the reviewer were resolved through discussions.
2.5. Methodological Quality Assessment
The quality of relevant articles was assessed using the Joanna Briggs Institute (JBI) critical evaluation tool [13]. Two of the authors (RW and MA) independently evaluated the quality of the full text selected for the meta-analysis. The tool includes ten items for case-control studies, forty for cross-sectional studies, and eight for cohort studies (additional file 3 and 4). Each study's items were scored as yes (1) or no (0). The quality of each study was graded based on the number of items judged “Yes” (1) as low risk < 60%, medium (60-80%), and high >80%.
2.6. Data Extraction
Following the inclusion of the relevant papers, the two reviewers (RW and MA) extracted all of the required data separately. To retrieve all qualified articles, a consistent data extraction tool was used with Microsoft Office Excel Software.
For the burden of NTDs, the data extraction tool includes the first author, publication year, country and subregion, study design, setting, sample size, and number of NTDs. The prevalence and number of cases for each of the NTD subtypes were also included. The data for NTD-related factors was extracted in two tables. The pooled odds ratio and its corresponding 95% confidence interval (CI) were calculated based on the original study report (additional file 5 and 6).
2.7. Statistical Methods and Analysis
The retrieved data was imported into the STATA/SE version 16 program for all statistical analyses. The heterogeneity of all included studies was assessed using I2 statistics and the Cochrane Q test. In this meta-analysis, the test revealed significant heterogeneity among included articles (I2 = 99.4 percent, P value = 0.00). As a result, a random effects model was used. The Egger test statistics were used to examine the publication bias. The pooled burden and odds ratios, as well as their respective 95% confidence intervals, were displayed using a forest plot. To determine the associated factors for NTDs, the data was entered into Review Manager Version 5, and pooled odds ratios (ORs) with a 95% confidence interval (CI) were calculated.
2.8. Operational Definition
NTDs are a circumstance that influences all neonates with one of the following malformations: spina bifida, anencephaly, and encephalocele. The number of infants born with NTDs was divided by the total number of newborns and multiplied by a hundred to calculate the burden of neural tube defects.
Spina bifida is a congenital disorder caused by the spine and spinal cord not developing properly. In infants with spina bifida, a portion of the neural tube does not close or develop normally, leading to abnormalities in the spinal cord and spine bones. There are three types of spina bifida: myelomeningocele, meningocele, and occulta.
Anencephaly is a birth defect in which the baby's brain and skull bones do not fully form while it is inside the womb. As a result, the cerebral cortex in particular does not develop as quickly in the baby's brain.
Encephalocele is a rare type of congenital abnormality of the neural tube that affects the brain. An encephalocele is a sac-like protrusion or extension of the brain and the membranes that protect it through a hole in the skull.
3. Results
The numerous subheadings listed below describe the findings from this systematic review and meta-analysis.
3.1. Description of Study Selection
A total of 547 studies on the burden of neural tube defects and associated factors in African countries were found in the Medline (PubMed), Cochrane, Embase, AJOL, ProQuest, Google Scopus, Google Scholars, ResearchGate, Basebieled scholarly, Wiley Online Library, and Google databases.
Ninety articles were removed due to duplication. After reviewing the titles and abstracts of the remaining 457 papers, it was determined that 375 were irrelevant to the study and were thus eliminated. In addition, 100 full-text papers were assessed for eligibility based on the established criteria. For the final systematic review and meta-analysis, 58 papers were selected that met the criteria (Figure 1).
Figure 1.
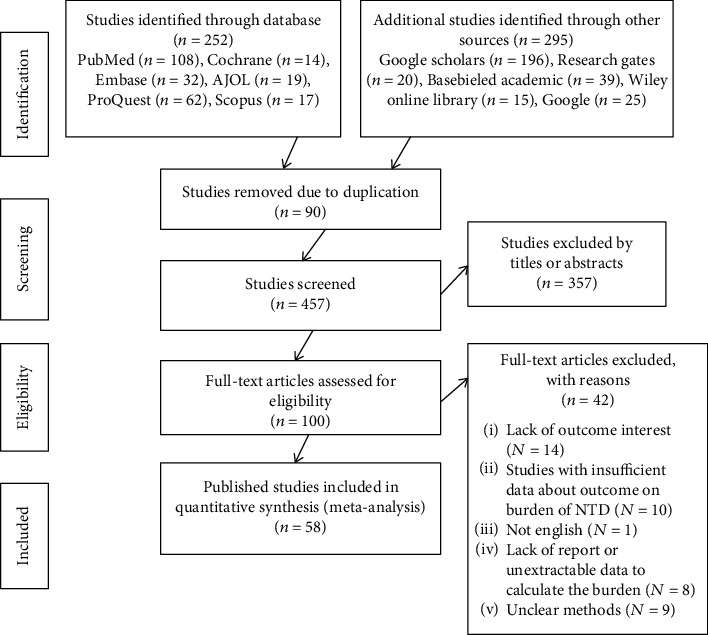
PRISMA flow diagram depicting the selection process of studies for the systematic review and meta-analysis on the burden and associated factors of neural tube defects in Africa, 2022.
The overall burden of neural tube defects was determined using 48 studies from among the qualifying papers. Ten more studies were considered to be explored for associated factors of neural tube defects, including ten case-control studies.
3.2. Characteristics of the Included Studies
In this systematic review and meta-analysis, 58 studies from sixteen African countries were considered eligible for assessing the prevalence of neural tube defects. Three African countries were included in the analysis of associated factors, with a total sample size of 7,150,654 participants, ranging from 61 in western African countries [14] to 3,803,889 in northern Africa [15]. Eastern African countries accounted for 23 (39.66%) [9–11, 16–34], with Ethiopia having the most 18 (31.03%) [9–11, 16–22, 28–34] and Uganda having two (3.345%) [26, 27]. Kenya, Eritrea, and Tanzania each had one study (1.72%) [23–25].
There were 12 (20.69%) studies [8, 14, 35–44] from western African countries, with Nigeria having the most with 11 (18.97%) [14, 35, 37–45] and Ghana having one (1.72%) [8] research. Eleven (18.97%) research [15, 46–55] was from northern African countries, with three (5.17%) studies [15, 46, 48–51] each from Morocco and Tunisia, two (3.45%) studies [52–55] each from Sudan and Algeria, and one (1.72%) study [47] from Libya. South Africa had the most studies from southern Africa region, with seven (12.06%) [56–62] and Botswana had only one (1.74%) [63]. Three studies (5.17%) [64–66] were from Central African countries, all from the Democratic Republic of the Congo. All research published between 1982 and 2022 that meet the criteria were eligible. There were forty cross-sectional studies (68.97%) [8–10, 14–18, 23, 24, 26, 27, 31–37, 40–44, 47–49, 52, 57–63, 65–68], eight cohort studies (13.79%) [17, 29, 38, 39, 46, 55, 56, 64], and ten case-control studies (17.24%) [19–22, 28, 30, 32, 50, 51, 54] in this analysis. Furthermore, 19 (32.76%) of the studies were rated as high quality. Only three (5.17%) studies were judged low quality, whereas 36 (62.07%) were considered medium quality (Table 1 parts a, b, c, and d and Table 2 parts a and b).
Table 1.
A summary of included studies for the burden of neural tube defects in Africa, 2022.
(a).
| Authors | Year | Country | Region | Study design | Setting | Sample size | Number of cases | Burden/10,000 | Duration of study/months | Quality of study |
|---|---|---|---|---|---|---|---|---|---|---|
| Abbey et al. [37] | 2017 | Nigeria | Western Africa | Cross-sectional | Hospital-based | 7,670 | 28 | 36.51 | 48 | Medium |
| Adane and Seyoum [11] | 2018 | Ethiopia | Eastern Africa | Cross-sectional | Hospital-based | 19,650 | 103 | 52.41 | 36 | Medium |
| Adeleye and Olowookere [14] | 2009 | Nigeria | Western Africa | Cross-sectional | Hospital-based | 61 | 33 | 5409.83 | 12 | Medium |
| Garcon and Danielle [65] | 2006 | DR Congo | Central Africa | Cross-sectional | Hospital-based | 8824 | 9 | 10.2 | 96 | Medium |
| Airede [38] | 1992 | Nigeria | Western Africa | Prospective | Hospital-based | 5,977 | 42 | 70.92 | 36 | Medium |
| Alhassan et al. [8] | 2017 | Ghana | Western Africa | Cross-sectional | Hospital-based | 35,426 | 24 | 6.77 | 48 | Medium |
| Anyanwu et al. [39] | 2021 | Nigeria | Western Africa | Prospective | Hospital-based | 1,456 | 4 | 27.47 | 9 | Low |
| Bello et al. [40] | 2008 | Nigeria | Western Africa | Cross-sectional | Hospital-based | 2,371 | 103 | 434.41 | 48 | Medium |
| Berhane and Belachew [29] | 2022 | Ethiopia | Eastern Africa | Prospective | Hospital-based | 48,750 | 522 | 107.07 | 36 | High |
| Berihu et al. [31] | 2018 | Ethiopia | Eastern Africa | Cross-sectional | Hospital-based | 14,903 | 195 | 131 | 9 | High |
| Buccimazza et al. [57] | 1994 | South Africa | Southern Africa | Cross-sectional | Hospital-based | 516,252 | 606 | 11.74 | 240 | Medium |
| Chukwubuike et al. [41] | 2020 | Nigeria | Western Africa | Cross-sectional | Hospital-based | 9492 | 34 | 35.82 | 4 | Medium |
| Cornell et al. [56] | 1983 | South Africa | Southern Africa | Prospective | Hospital-based | 116859 | 105 | 9 | 60 | Medium |
| Ekanem et al. [42] | 2008 | Nigeria | Western Africa | Cross-sectional | Hospital-based | 127929 | 67 | 5.24 | 276 | High |
| Ekwochi et al. [43] | 2017 | Nigeria | Western Africa | Cross-sectional | Hospital-based | 5,830 | 6 | 10.29 | 48 | Medium |
(b).
| Authors | Year | Country | Region | Study design | Setting | Sample size | Number of cases | Burden/10,000 | Duration of study/months | Quality of study |
|---|---|---|---|---|---|---|---|---|---|---|
| El-moghrabi [47] | 2019 | Libya | Northern Africa | Cross-sectional | Hospital-based | 16,765 | 19 | 11.33 | 12 | Medium |
| Estifanos [23] | 2017 | Eriteria | Eastern Africa | Cross-sectional | Hospital-based | 39,803 | 185 | 46.48 | 56 | Medium |
| Forci et al. [46] | 2021 | Morocco | Northern Africa | Prospective | Hospital-based | 43923 | 44 | 10.02 | 65 | High |
| Gedamu et al. [33] | 2021 | Ethiopia | Eastern Africa | Cross-sectional | Hospital-based | 2,218 | 11 | 49.59 | 6 | Medium |
| Gedefaw et al. [32] | 2018 | Ethiopia | Eastern Africa | Cross-sectional | Hospital-based | 8,677 | 126 | 145.21 | 7 | Medium |
| Geneti et al. [9] | 2021 | Ethiopia | Eastern Africa | Cross-sectional | Hospital-based | 45951 | 186 | 40.47 | 60 | High |
| Githuku et al. [24] | 2014 | Kenya | Eastern Africa | Cross-sectional | Hospital-based | 6041 | 1272 | 2105.61 | 72 | High |
| Houcher et al. [55] | 2008 | Algeria | Northern Africa | Prospective | Hospital-based | 28500 | 215 | 75.44 | 36 | Medium |
| Kalisya et al. [64] | 2015 | DR Congo | Central Africa | Prospective | Hospital-based | 1,301 | 48 | 368.95 | 156 | Medium |
| Kayembe-Kitenge et al. [66] | 2019 | DR Congo | Central Africa | Cross-sectional | Hospital-based | 133662 | 146 | 10.92 | 24 | High |
| Kindie and Mulu [34] | 2022 | Ethiopia | Eastern Africa | Cross-sectional | Hospital-based | 8,862 | 97 | 109.46 | 24 | Medium |
| Kishimba et al. [25] | 2015 | Tanzania | Eastern Africa | Cross-sectional | Hospital-based | 28,217 | 27 | 10 | 5 | High |
| Kromberg and Jenkins [58] | 1982 | South Africa | Southern Africa | Cross-sectional | Hospital-based | 29,633 | 35 | 11.81 | 12 | Medium |
| Krzesinski et al. [59] | 2019 | South Africa | Southern Africa | Cross-sectional | Hospital-based | 93609 | 195 | 20.83 | 72 | Low |
| Laamiri [48] | 2017 | Morocco | Northern Africa | Cross-sectional | Hospital-based | 819,224 | 330 | 4.03 | 36 | Medium |
(c).
| Authors | Year | Country | Region | Study design | Setting | Sample size | Number of cases | Burden/10000 | Duration of study/months | Quality of study |
|---|---|---|---|---|---|---|---|---|---|---|
| Mekonnen et al. [16] | 2021 | Ethiopia | Eastern Africa | Cross-sectional | Hospital-based | 11177 | 32 | 28.63 | 72 | Medium |
| Mekonen et al. [17] | 2015 | Ethiopia | Eastern Africa | Prospective | Hospital-based | 1,516 | 20 | 131.93 | 6 | High |
| Barlow-Mosha et al. [26] | 2021 | Uganda | Eastern Africa | Cross-sectional | Hospital-based | 110,752 | 109 | 9.8 | 40 | High |
| Mumpe-Mwanja et al. [27] | 2019 | Uganda | Eastern Africa | Cross-sectional | Hospital-based | 69,766 | 72 | 10.32 | 28 | Medium |
| Nasri et al. [15] | 2014 | Tunisia | Northern Africa | Cross-sectional | Hospital-based | 3,803,889 | 769 | 2.02 | 240 | Medium |
| Nnadi and Singh [43, 44] | 2022 | Nigeria | Western Africa | Cross-sectional | Hospital-based | 10,163 | 22 | 21.63 | 36 | High |
| Oumer et al. [69] | 2021 | Sudan | Northern Africa | Cross-sectional | Hospital-based | 36,785 | 103 | 28 | 12 | Medium |
| Radouani et al. [49] | 2015 | Morocco | Northern Africa | Cross-sectional | Hospital-based | 60,017 | 80 | 13.3 | 48 | Low |
| Saib et al. [60] | 2021 | South Africa | Southern Africa | Cross-sectional | Hospital-based | 7,516 | 5 | 6.65 | 12 | Medium |
| Perinatal [53] | 2021 | Sudan | Northern Africa | Cross-sectional | Hospital-based | 20,000 | 72 | 36 | 5 | High |
| Singh et al. [35] | 2015 | Nageria | Western Africa | Cross-sectional | Hospital-based | 10,163 | 16 | 15.74 | 36 | High |
| Sorri and Mesfin [18] | 2015 | Ethiopia | Eastern Africa | Cross-sectional | Hospital-based | 28,961 | 177 | 61.12 | 36 | Medium |
| Taye et al. [70] | 2019 | Ethiopia | Eastern Africa | Cross-sectional | Hospital-based | 76,201 | 612 | 80.31 | 6 | High |
| Taye et al. [10] | 2016 | Ethiopia | Eastern Africa | Cross-sectional | Hospital-based | 319,776 | 1873 | 58.57 | 48 | High |
(d).
| Authors | Year | Country | Region | Study design | Setting | Sample size | Number of cases | Burden/10000 | Duration of study/months | Quality of study |
|---|---|---|---|---|---|---|---|---|---|---|
| Theron et al. [61] | 2020 | South Africa | Southern Africa | Cross-sectional | Hospital-based | 223,388 | 77 | 3.44 | 60 | Medium |
| Ugwu et al. [36] | 2007 | Nigeria | Western Africa | Cross-sectional | Hospital-based | 2891 | 31 | 127.98 | 37 | Medium |
| Venter et al. [62] | 1995 | South Africa | Southern Africa | Cross-sectional | Hospital-based | 10380 | 27 | 26 | 42 | High |
| Zash et al. [63] | 2019 | Botswana | Southern Africa | Cross-sectional | Hospital-based | 119477 | 98 | 8.2 | 55 | Medium |
Table 2.
A descriptive review of studies that reported associated factors for the burden of neural tube defects in Africa, 2022.
| Authors | Year | Country | Region | Total size | Case | Control | Variables of associate factors | OR 95% (CI) | Study of quality |
|---|---|---|---|---|---|---|---|---|---|
| Atlaw et al. [28] | 2019 | Ethiopia | Oromiya-Bale | 462 | 42 | 420 | Maternal folic acid supplementation Parental consanguinity marriage Maternal alcohol consumption Maternal history of stillbirth Maternal exposure to pesticide Maternal exposure to radiation Maternal medical illness Sex of newborn |
0.115 (0.044-0.298) 4.9 (1.49-16.17) 0.79 (0.32-1.98) 1.4 (0.416-4.75) 0.196 (0.02-2.21) 0.44 (0.09-2.08) 1.01 (0.48-2.13) 0.72 (0.38-1.37) |
Medium |
| Berihu et al. [30] | 2018 | Ethiopia | Tigray | 617 | 205 | 115 | Maternal alcohol consumption Maternal exposure to pesticide Maternal exposure to radiation Sex of newborn Maternal age > 35 years |
10.28 (1.19-88.5) 5 (0.15-166.6) 5 (0.15-166.6) 0.51 (0.34-0.76) 2.46 (1.33-4.53) |
High |
| Bourouba et al. [54] | 2018 | Algeria | Banta | 48 | 44 | 4 | Maternal folic acid supplementation Parental consanguinity marriage Maternal age > 35 years |
1.17 (0.39-3.49) 0.92 (0.42-1.97) 4.15 (0.89-19.25) |
Medium |
| Aynalem Tesfay et al. [19] | 2021 | Ethiopia | Addis Ababa | 180 | 60 | 120 | Maternal alcohol consumption Maternal exposure to pesticide Maternal exposure to radiation Sex of newborn |
0.57 (0.20-1.45) 2.01 (0.98-4.16) 1.34 (0.23-8.30) 1.70 (0.91-3.20) |
Medium |
| Gashaw et al. [20] | 2021 | Ethiopia | Amhara-North Shewa | 243 | 81 | 162 | Maternal folic acid supplementation Maternal exposure to pesticide Maternal history of stillbirth |
0.16 (0.07-0.33) 5.34 (1.77-16.05) 3.63 (1.03-12.2) |
High |
| Gedefaw et al. [32] | 2018 | Ethiopia | Addis Ababa | 333 | 111 | 222 | Maternal folic acid supplementation Sex of newborn Maternal age > 35 years |
0.47 (0.23-0.95) 0.56 (0.33-0.94) |
Medium |
| Study et al. [21] | 2022 | Ethiopia | Amhara region | 381 | 127 | 254 | Maternal folic acid supplementation Maternal history of stillbirth Sex of newborn Maternal medical illness Maternal age > 35 years |
1.80 (1.15-2.83) 1 (0.63-1.4) 1 (0.33-2.2) 2.04 (1.03-3.4) |
Medium |
| Nasri et al. [71] | 2015 | Tunisia | Wassila-Bourguiba center | 150 | 75 | 75 | Maternal folic acid supplementation Parental consanguinity marriage |
6.75 (1.95-22.07) 10.70 (3.30-22.66) |
Medium |
| Nasri et al. [51] | 2016 | Tunisia | Wassila-Bourguiba center | 132 | 68 | 64 | Parental consanguinity marriage | 2.60 (12.0-0.70) | Medium |
| Tadesse et al. [22] | 2020 | Ethiopia | Amhara region | 400 | 133 | 267 | Maternal folic acid supplementation Maternal alcohol consumption Sex of newborn Maternal history of stillbirth |
0.27 (0.17-0.44) 0.59 (0.33-1.05) 2.09 (1.34-3.29) 0.61 (0.28-1.29) |
High |
3.3. Meta-Analysis
3.3.1. Burden of Neural Tube Defects in Africa
In this meta-analysis, to assess the burden of neural tube abnormalities in Africa, 48 studies were found to be included. The overall burden of neural tube defects was 32.95 per 10,000 infants on average (95% CI:29.77-36.13) [8–11, 14–18, 23–27, 29, 31–34, 36–44, 46–49, 52, 53, 55–66, 70, 72]. As a result, the random effects model was used to estimate the prevalence of neural tube defects in African countries (Figure 2).
Figure 2.
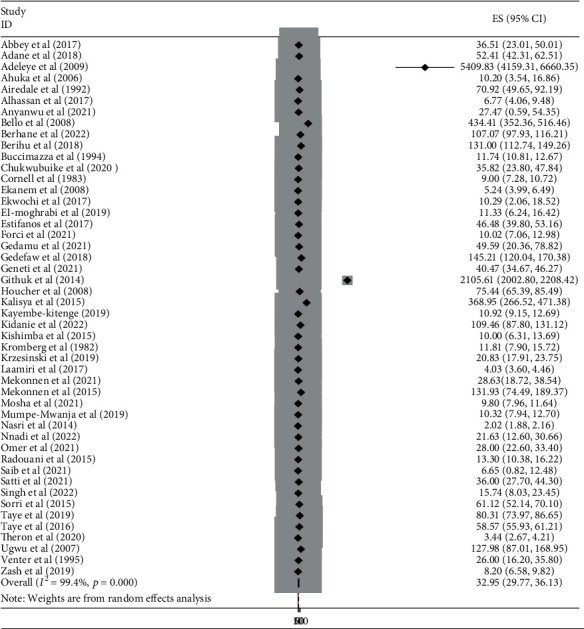
A forest plot depicting the burden of neural tube defects per 10,000 births in Africa, 2022.
3.3.2. Publication Bias
As indicated by the asymmetrical distribution of funnel plot tests, there was a publication bias in the burden of neural tube defects among the included studies. The forest plot revealed that the experiments differed greatly. The studies showed significant heterogeneity (I2 = 99.4%, P value ≤ 0.001) (Figure 3). Egger's test, too, revealed that publication bias is statistically significant (p value ≤ 0.001) (Table 3).
Figure 3.
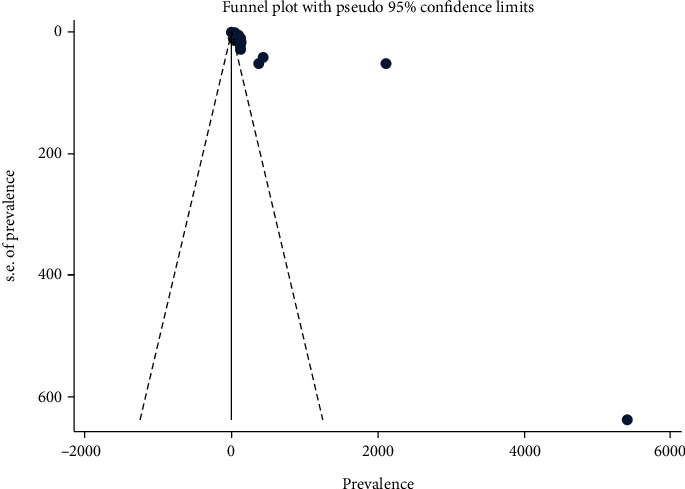
The funnel graph depicts the distribution of studies included in the burden of neural tube defects in Africa, 2022.
Table 3.
Egger's test for detection of publication bias for studies included in the burden of neural tube defects in Africa, 2022.
| Egger's test | |||||
|---|---|---|---|---|---|
| Std_Eff | Coef. | Std. err. | t | P > |t| | (95% Conf. interval) |
| Slope 2.610286 | 1.407143 | .5977176 | 2.35 | 0.023 | .2040002 |
| Bias 12.44599 | 9.80027 | 1.314385 | 7.46 | ≤0.001 | 7.154551 |
3.3.3. Sensitivity Analysis for the Burden of Neural Tube Defects in Africa
A sensitivity analysis was utilized to evaluate the influence of various studies on the pooled burden of NTDs in Africa. Except for three studies, it was established that the pooled burden of NTDs was estimated to be uniform across studies. After removing just one study, the burden has been determined to be 37.54 (33.41-41.58) [48]. The burden was 38.56 (34.18-42.95) after removing only one [15]. After removing only one [24], it was 29.91 (27.06-32.76). If the three studies had been excluded together, the overall estimated prevalence would have been 36.16 (31.60-40.71) [15, 24, 48] (Figure 4).
Figure 4.
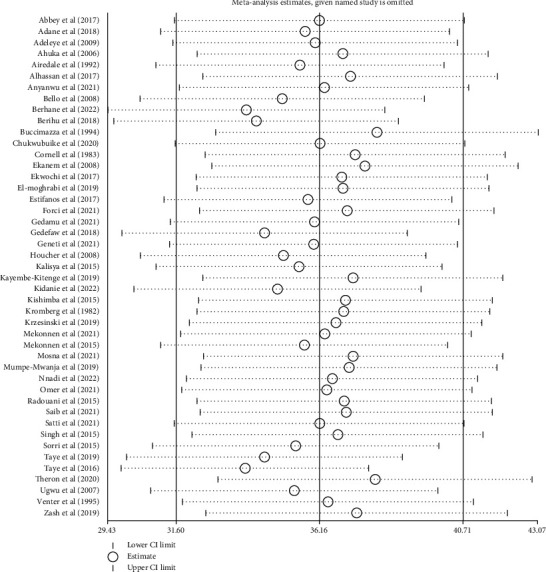
Results of sensitivity analysis of 45 studies after removing the three studies [15, 24, 48] in Africa, 2022.
3.3.4. Subgroup Analysis of the Burden of Neural Tube Defects
Subgroup analysis was carried out based on the regions where the studies were conducted. The highest burden was observed in the eastern Africa region with a burden of 111.13 per 10,000 births (95% CI: 91.85, 130.42) followed by western Africa at 34.39 per 10,000 (95% CI: 23.78, 45.01), Central Africa at 26.66 per 10,000 (95% CI: 3.88, 49.45), and northern Africa at 15.93 per 10,000 (95% CI: 12.96, 18.90). The lowest burden was observed in southern Africa, with 11.43 per 10,000 births (95% CI: 7.51, 15.34) (Figure 5).
Figure 5.
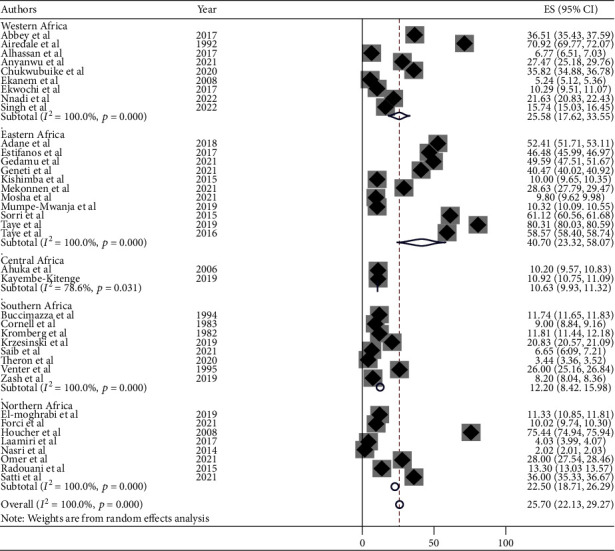
Forest plot of subgroup analysis by the regions of showing the burden of neural tube defects per 10,000 births in Africa, 2022.
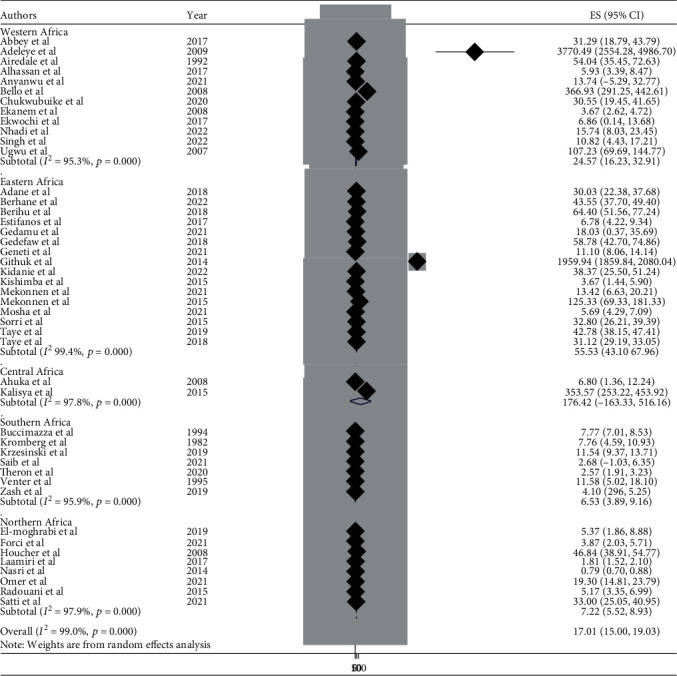
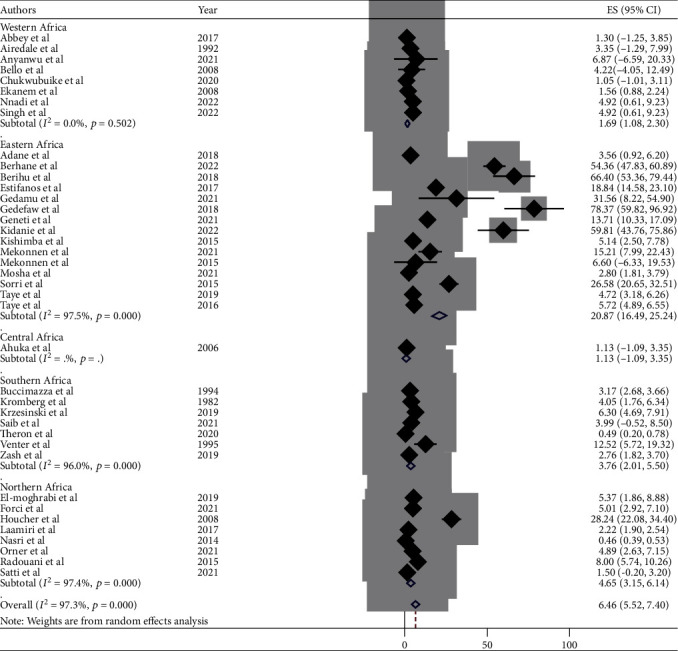
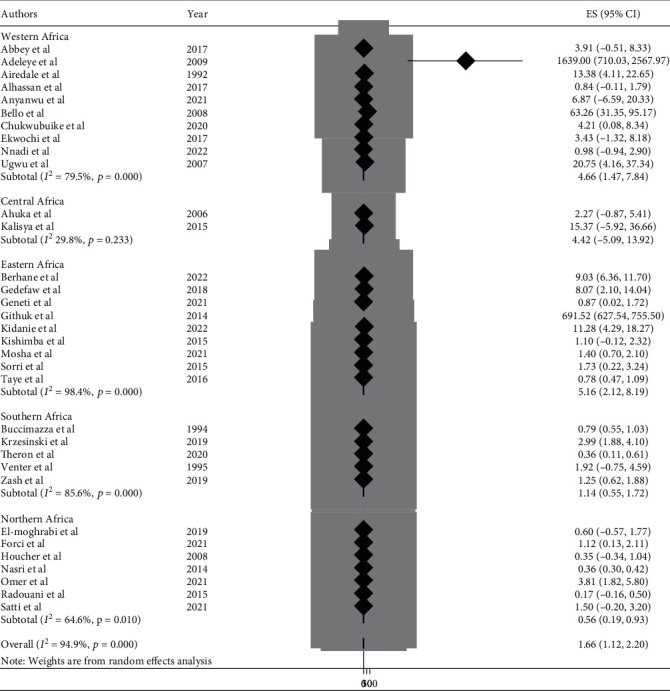
3.3.5. Burden of NTDs by Subtypes in Africa
This meta-analysis looked into the subtypes of neural tube defects. Spina bifida had the highest burden among the subtypes of neural tube defects in African countries, at 17.01 (95% CI: 15.00, 19.00) (Figure 6), followed by anencephaly at 6.46 (95% CI: 5.52, 7.40) (Figure 7) and encephalocele at 1.66 (95% CI: 1.12, 2.20) (Figure 8). The burden of spina bifida was highest at 176.42 (95% CI: -163.33, 516.16) in Central Africa and lowest at 6.53 (95% CI: 3.89, 9.16) in southern Africa countries (Figure 9). The burden of anencephaly was highest at 20.87 (95% CI: 16.49, 25.24) in eastern Africa countries and lowest at 1.13 (95% CI: 1.09, 3.35) in Central African countries (Figure 10). The frequency of encephalocele was highest at 5.16 (2.12, 8.19) in Eastern African countries and lowest at 0.56 (0.19, 0.93) in northern African countries (Figure 11).
Figure 6.
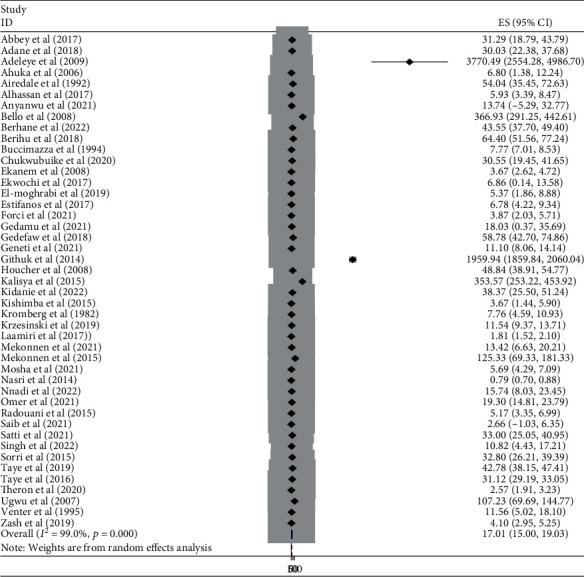
Forest plot showing the burden of spina bifida per 10,000 in Africa, 2022.
Figure 7.
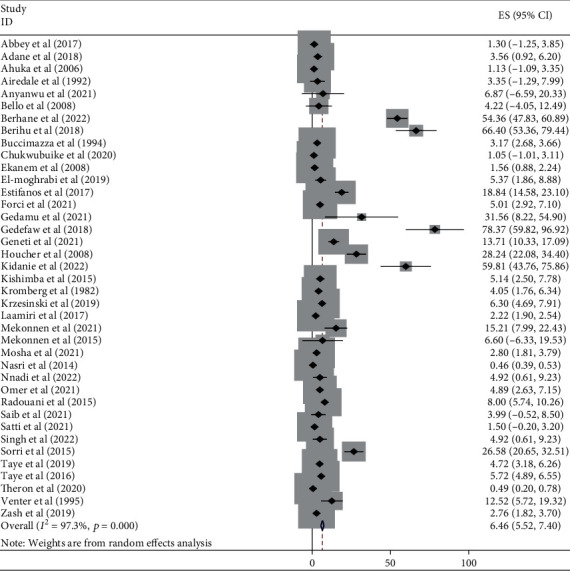
Forest plot depicting the burden of anencephaly per 10,000 in Africa, 2022.
Figure 8.
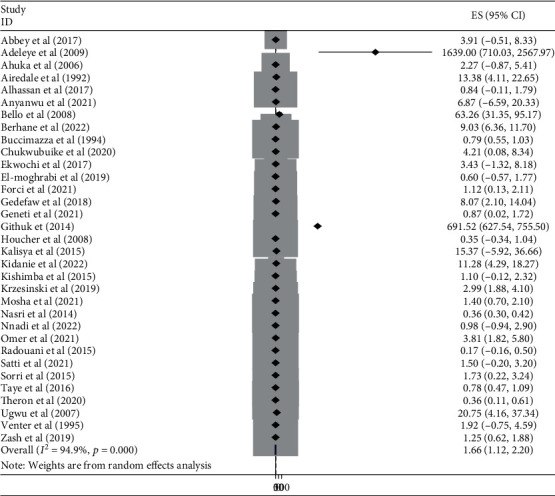
Forest plot showing the burden of encephalocele per 10,000 in Africa, 2022.
Figure 9.
Forest plot showing the burden of spina bifida by subregion per 10,000 in Africa, 2022.
Figure 10.
Forest plot depicting the pooled burden of anencephaly by subregion per 10,000 in Africa, 2022.
Figure 11.
Forest plot showing the pooled burden of encephalocele by subregion per 10,000 in Africa, 2022.
3.3.6. Associated Factors of Neural Tube Defects
This meta-analysis included maternal folic acid supplementation, parental consanguinity marriage, maternal alcohol consumption, maternal history of stillbirth, maternal pesticide exposure, maternal radiation exposure, maternal medical illness, infant sex, and mother's age > 35 years old as associate factors for neural tube defects, with ten papers [19–22, 28, 30, 32, 51, 54, 71] retrieved into the review. For sensitivity analysis, each variable was carefully examined. However, sensitivity analysis revealed that neither of the linked parameters was significant. A separate analysis was conducted for each variable.
(1) Maternal Age and Neural Tube Defects. From three [20, 21, 30] studies, we found that maternal age above 35 years of age during pregnancy was significantly associated with NTDs among newborn infants with odds ratio 3.54 (95% CI: 1.67–7.47). This suggests that infants born to mothers over 35 were 3.54 times more likely to have NTDs during pregnancy than infants born to mothers under 35. The study showed moderate heterogeneity (I2 = 69%, P ≤ 0.001) (Figure 12); hence, random model effect was used.
Figure 12.
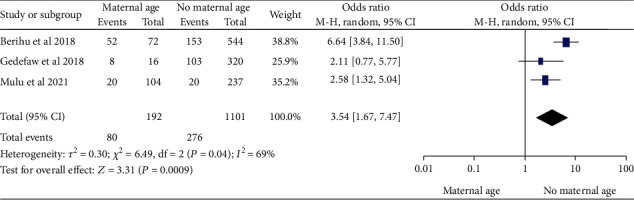
Forest plot showing the association between maternal age and the neural tube defects in Africa, 2022.
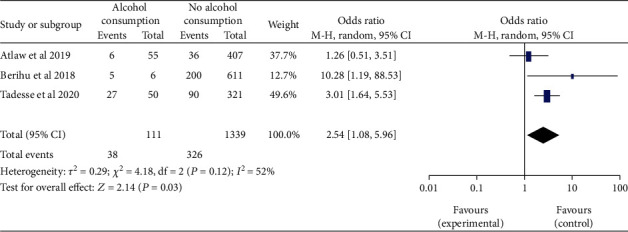
(2) Maternal Alcohol Consumption and Neural Tube Defects. Three [22, 28, 30] studies showed that the women who had alcohol consumption during pregnancy were significantly associated with NTDs, odds ratio 2.54 (95% CI: 1.08-5.96). This indicated that infants of mother who had alcohol consumption were 2.54 times more likely to have babies with NTDs than women who had never consumed alcohol during pregnancy. The study showed moderate heterogeneity (I2 = 52%, P <0.12) (Figure 13). Hence, random model effect was computed.
Figure 13.
Forest plot depicting the association between maternal alcohol consumption and neural tube defects in Africa, 2022.
(3) Maternal Folic Acid Supplementation and Neural Tube Defect. From seven [20–22, 28, 32, 54, 71] studies, we found that maternal folic acid supplementation during pregnancy was significantly associated with NTDs, odds ratio 0.38 (95% CI: 0.16-0.94). In epidemiological expressions, this showed us that infants born from mothers who took folic acid supplementation during pregnancy were 62% times less likely to have NTDs. The study showed high heterogeneity (I2 = 89%, P ≤ 0.001) (Figure 14). Hence, random model effect was used.
Figure 14.

Forest plot illustrating the associations between maternal folic acid supplementation and the burden of neural tube defects in Africa, 2022.
(4) Maternal Exposure to Pesticide and Neural Tube Defects. This research looked at four studies [19, 20, 28, 30] to assess the maternal exposure to pesticide and neural tube defects. The neural tube defect pooled odds ratio found that women who were exposed to pesticides during pregnancy were 2.69 times more likely to have a baby with neural tube defects (OR, 95 percent CI; 2.69 (1.62-4.46)). The study was considered with the heterogeneity test, which found low heterogeneity (I2 = 0, P < 0.67) (Figure 15). As a result, the fixed-effects model was adopted in this study.
Figure 15.
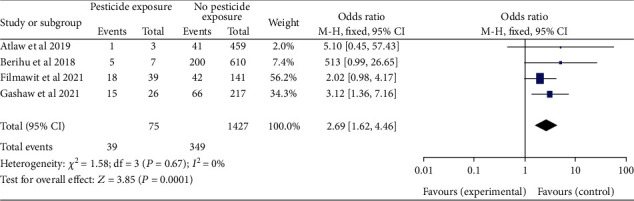
Forest plot showing the linkage between the maternal exposure to pesticide and neural tube defects in Africa, 2022.
(5) Maternal Exposure to X-Ray Radiation and Neural Tube Defects. Three studies [19, 28, 30] looked at maternal radiation exposure during pregnancy to realize if there was a link to neural tube defects. The combined odds were analyzed. Women who had been exposed to radiation were 2.67 times more likely to have infants with neural tube defects than women who had not been exposed to radiation (OR, 95% CI: 2.67 (1.05-6.78)). Low heterogeneity (I2 = 0, P < 0.55) was found. This study utilized a fixed-effects model (Figure 16).
Figure 16.
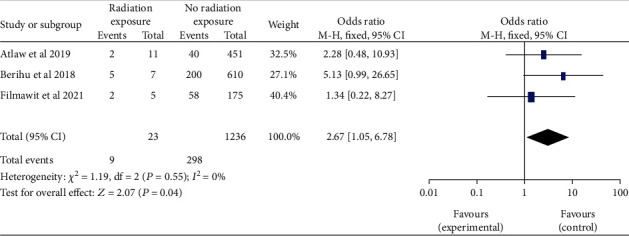
Forest plot showing the linkage between the maternal exposure to X-ray radiation and neural tube defects in Africa, 2022.
(6) Paternal Consanguineous Marriage and Neural Tube Defects. Based on the four studies [28, 51, 54, 71], the link between parental consanguineous marriage and neural tube defects was rigorously analyzed. There was no difference in the combined odds ratio of neural tube defects between parents who were consanguineous and those who were not (OR 95 percent CI: 1.07 (0.40-2.91)). I2 = 75% andP ≤ 0.001revealed moderate heterogeneity. As a result, in the final analysis, the random effects model was used (Figure 17).
Figure 17.
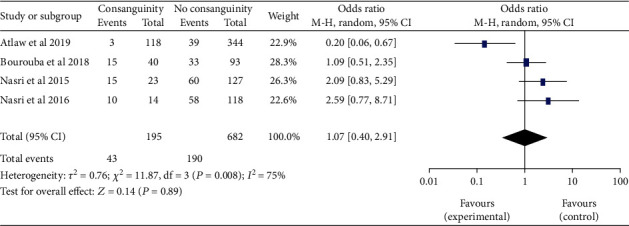
Forest plot depicting the association between the parental consanguineous marriage and neural tube defects in Africa, 2022.
(7) Sex of Newborn Infants and Neural Tube Defects. The results of the six studies [19, 21, 22, 28, 30, 32] revealed that there is no difference in the burden of neural tube defects between male and female newborns (OR, 95% CI: 0.83 (0.55-1.23)). The heterogeneity was then found to be moderate (I2 = 74%, P ≤ 0.001). The random effect was used (Figure 18).
Figure 18.
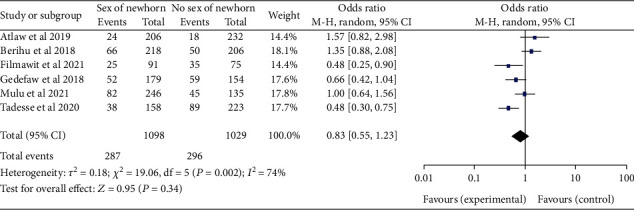
Forest plot illustrating the association of the sex of newborn infant and neural tube defects in Africa, 2022.
(8) Maternal Medical Illness and Neural Tube Defects. The pooled odds ratio for neural tube defects between the two studies [21, 28] found no difference between pregnant women with and without medical illness (OR, 95 percent CI: 1.38 (0.83-2.28)) (Figure 19). The heterogeneity was then found to be low (I2 = 35%, P < 0.20). The fixed effect was therefore assessed.
Figure 19.
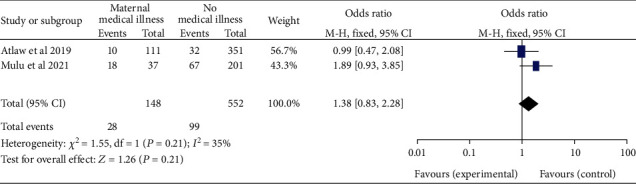
Forest plot showing the association of maternal medical illness and neural tube defects in Africa, 2022.
(9) Maternal History of Stillbirth and the Outcome. Three [20–22, 28] studies revealed that women who had a stillbirth were 3.18 times more likely to have a newborn with neural tube defects than women who had not had a stillbirth, (95% CI: 1.11–9.12). The study discloses high heterogeneity (I2 = 82%, P ≤ 0.001). As a result, a random effects model was contemplated (Figure 20).
Figure 20.
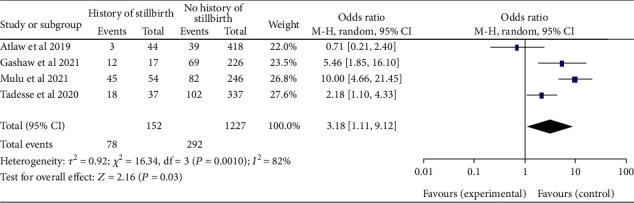
Forest plot depicting the association of the maternal history of stillbirth and neural tube defects in Africa, 2022.
4. Discussion
The burden of subtype analysis of neural tube defects was evaluated by region for the first time in Africa. The overall burden of NTDs was 32.95 per 10,000 infants (95% CI: 29.77–36.13). This finding is higher than the studies conducted in California which reported a prevalence of 9 per 10,000 births [73], low- and middle-income countries (11 per 10,000) [74], Africa (21.42 per 10,000) [69]. However, the overall burden found in this study is lower than the previous studies conducted in Africa which reported a prevalence value of 50.74 per 10,000 and India (45 per 10,000 and 42.48 per 10,000) [75–77]. This may be due to several factors, including variable birth record system, study design, and population size. Inclusion or exclusion criteria of articles among reviews may also have an effect in the findings. Furthermore, data loss and less organized system might also be a reason for the heterogeneity of the burden rate among the various studies.
The subgroup analysis of this study showed that the burden of NTDs among newborn infants significantly varies across the regions. The highest burden was observed in the eastern Africa region with a burden of 111.13 per 10,000 births (95% CI: 91.85, 130.42), and the lowest burden was in southern Africa, with 11.43 per 10,000 births (95% CI: 7.51, 15.34). This has been linked to varying folic acid supplementation trends. The eastern region had a higher burden. This may be due to a greater deficiency in folic acid supplementation with the staple foods lacking adequate amount of folic acid fortification. On the other hand, the reason for the lower burden in the southern countries may be due to better folic acid supplementation practices and fortification policies in their staple foods [78–80].
In African countries, spina bifida had the highest burden among the subtypes of NTDs with 17.01 (95% CI: 15.00, 19.00), followed by anencephaly at 6.46 (95% CI: 5.52, 7.40) and encephalocele at 1.66 (95% CI: 1.12, 2.20). Based on the regions, the burden of spina bifida was highest at 176.42 (95% CI: -163.33, 516.16) in central Africa and lowest at 6.53 (95% CI: 3.89, 9.16) in southern African countries. The burden of anencephaly was highest at 20.87 (95% CI: 16.49, 25.24) in eastern African countries and lowest at 1.13 (95% CI: 1.09, 3.35) in central African countries. The burden of encephalocele was highest at 5.16 (2.12, 8.19) in eastern African countries and lowest at 0.56 (0.19, 0.93) in northern African countries. The current review showed that the burden of spina bifida was higher than a previous study conducted in Africa with a value of 13 per 10,000 births [81]. On the other hand the burden of anencephaly and encephalocele were lower than that of a previous study carried out in Africa, with a value of 14 per 10,000 and 2 per 10,000, respectively [82, 83]. This variation in the burden of the subtypes of NTD may be due to the differences in defect identification and detection methods over time, as well as differences in location, income level, and institutional folic acid fortification policy [74, 80, 84].
In this study, 10 studies [19–22, 28, 30, 32, 51, 54, 71] were retrieved in order to identify protective and associated factors with NTDs in newborns. After reviewing 2,946 sample sizes, 946 cases and 1703 controls were investigated. Infants born to mothers over the age of 35 during pregnancy were 3.54 times more likely to have NTDs than infants born to mothers under the age of 35, according to the combined odds. A finding of this study, which a fetus with NTDs is more likely to have chromosomal abnormalities as maternal age increases, was consistent with a previous study that found a link between maternal age and infants born with NTDs that have chromosomal abnormalities [85]. Meiotic division restriction leads to increased aneuploidy [86, 87].
Women with a history of alcohol use were 2.54 more likely to have infants with NTDs than women that had never consumed alcohol during pregnancy. This finding contradicts with the findings from studies that reported no link between maternal alcohol consumption and NTDs. This finding in the study has explained very well that this could be due to underreporting of alcohol consumption, which is directly related to the social stigma of drinking during pregnancy [88, 89].
Women who had been exposed to radiation were 2.67 times more likely to have infants with neural tube defects than women who had not been exposed to radiation. This finding is in line with the study's findings of altered chromatin structure, altered gene expression, and DNA damage. It may be due to radiation's ability to alter global DNA methylation, which in turn can affect altered gene expression, altered chromatin structure, and DNA damage [90]. Apoptotic mutations caused by X-rays combine with neurodevelopment to increase the likelihood of NTD closure failure. Chronic low-dose radiation may affect the growth of neural progenitor cells and disrupt brain development [90].
The link between parental consanguineous marriage and NTDs has been extensively examined. There was no difference in the combined odds ratio of NTD among with and without consanguineous marriages. This observational study contradicts the findings of an Indian study that had reported that consanguinity increases the risk of NTD [91]. Consanguineous marriage alters the communal genetic frequency due to the gene residing in the family's genetic tree, which has a significant impact on NTD [92].
The results of the present study show no difference between male and female newborns in the burden of neural tube defects. These results go against a study [76] from India that found that newborn girls are more likely than newborn boys to have NTD.
It is unlikely that the outcome can be used to predict vulnerability to NTDs and was most likely caused by the rate of embryonic development. Due to females' slower rate of growth and the length of time spent undergoing neurulation, males appear to have made advancements in a few areas of the neurulation process, which increases the risk of NTDs [93]. The prevalence of NTDs was reduced due to extensive folic acid supplementation in both sexes [94].
The pooled odds ratio for neural tube defects among the studies found no difference between pregnant women with and without medical illness, according to this meta-analysis. These findings are consistent with a study carried out in the United States [95], which found no difference in NTD prevalence between HIV-exposed pregnant women and the general population. On the other hand, it contradicts a previous study that found a higher risk of NTDs linked to fever during the first trimester of pregnancy [96]. In addition, a study done on Mexican-Americans had also reported that the occurrence of stressful life events was associated with NTD risk [97].
Women who had a history of stillbirth were 3.18 times more likely to have a newborn with neural tube defects than women who had not had a stillbirth. This finding is consistent with previous study that a previous miscarriage increases the risk of NTDs. The risk of recurrent stillbirth and termination pregnancies rises with NTD [98].
Reviewing the overall prevalence and contributing factors of neural tube defects among newborns in Africa has revealed significant advancements made possible by incorporating newer studies and up-to-date research to attract more attention and address a variety of studies. Therefore, the main aim of this systematic review and meta-analysis was to estimate the burden of neural tube defects and their associated factors in Africa. In order to minimize the occurrence of neural tube defects in Africa, policymakers and program planners could use the findings of this review as a guide when developing suitable interventions. The evaluation could also be used as a starting point for future studies on associated subjects.
5. Strength and Limitations of the Study
Strength of the study is inclusion of cross-sectional, cohort, and case-control type of additional and current studies to increase attention and address many studies to show the burden of NTDs in Africa. On the other hand, as a limitation, only a few original studies have been conducted in some African regions and included in this review. The studies reviewed are hospital-based studies, which may likely limit the coverage of the study population to assess the overall burden of NTDs in Africa.
6. Conclusion
This review has revealed the burden of NTDs among newborn infants in African countries. The burden of NTDs varies in different regions of Africa and varies in relation with different risk factors. Folic acid supplementation is found as a protective factor of NTDs. The recommendation of this study is to implement a preconception folic acid therapy policy for all women of childbearing age, as well as a policy of mandatory food fortification is critical.
Acknowledgments
We would like to express our gratitude and appreciation to all Addis Ababa University, School of Medicine, Department of Anatomy, and Menelik II Medical and Health Science College staffs that supported us in this review.
Abbreviations
- NTDs:
Neural tube defects
- CI:
Confidence interval
- JBI:
Joanna Briggs Institute
- MeSH:
Medical subject headings.
Data Availability
The datasets used and/or evaluated in this study are available from the corresponding author upon reasonable request.
Conflicts of Interest
The authors declare that they have no conflicts of interest.
Authors' Contributions
The protocol and design of the study were developed by Reta Wakoya. Reta Wakoya and Mekbeb Afework conducted the article search, data extraction, and analysis. Reta Wakoya was a substantial contributor to the manuscript. Mekbeb Afework read and evaluated the manuscript. The final manuscript was examined and approved by both authors.
References
- 1.Mitchell L. E. Epidemiology of neural tube defects. American Journal of Medical Genetics Part C: Seminars in Medical Genetics . 2005;135C(1):p. 88. doi: 10.1002/ajmg.c.30057. [DOI] [PubMed] [Google Scholar]
- 2.Blencowe H., Kancherla V., Moorthie S., Darlison M. W., Modell B. Estimates of global and regional prevalence of neural tube defects for 2015: a systematic analysis. Annals of the New York Academy of Sciences . 2018;1414(1):31–46. doi: 10.1111/nyas.13548. [DOI] [PubMed] [Google Scholar]
- 3.Rampersaud E., Bassuk A. G., Enterline D. S., et al. Whole genomewide linkage screen for neural tube defects reveals regions of interest on chromosomes 7 and 10. Journal of Medical Genetics . 2005;42(12):940–946. doi: 10.1136/jmg.2005.031658. [DOI] [PMC free article] [PubMed] [Google Scholar]
- 4.MacHenry J. C. R. M., Nevin N. C., Merrett J. D. Comparison of central nervous system malformations in spontaneous abortions in northern Ireland and South-East England. British Medical Journal . 1979;1(6175):1395–1397. doi: 10.1136/bmj.1.6175.1395. [DOI] [PMC free article] [PubMed] [Google Scholar]
- 5.Al-Mendalawi M. D. Epidemiology of neural tube defects. Saudi Medical Journal . 2015;36(3):373–374. doi: 10.15537/smj.2015.3.11087. [DOI] [PMC free article] [PubMed] [Google Scholar]
- 6.Irvine B., Luo W., León J. A. Congenital anomalies in Canada 2015: a perinatal health surveillance report by the public health agency of Canada’s Canadian perinatal surveillance system. Health Promotion and Chronic Disease Prevention in Canada . 2015;35:21–22. doi: 10.24095/hpcdp.35.1.04. [DOI] [PMC free article] [PubMed] [Google Scholar]
- 7.Farkas S. A., Böttiger A. K., Isaksson H. S., et al. Epigenetic alterations in folate transport genes in placental tissue from fetuses with neural tube defects and in leukocytes from subjects with hyperhomocysteinemia. Epigenetics . 2013;8(3):303–316. doi: 10.4161/epi.23988. [DOI] [PMC free article] [PubMed] [Google Scholar]
- 8.Alhassan A., Adam A., Nangkuu D. Prevalence of neural tube defect and hydrocephalus in northern Ghana. Journal of Medical and Biomedical Sciences . 2017;6(1):18–23. doi: 10.4314/jmbs.v6i1.3. [DOI] [Google Scholar]
- 9.Geneti S. A., Dimsu G. G., Sori D. A., Amente L. D., Kurmane Z. M. Prevalence and patterns of birth defects among newborns in southwestern Ethiopia: a retrospective study. The Pan African Medical Journal . 2021;40:p. 40. doi: 10.11604/pamj.2021.40.248.25286. [DOI] [PMC free article] [PubMed] [Google Scholar]
- 10.Taye M., Afework M., Fantaye W., Diro E., Worku A. Magnitude of birth defects in central and Northwest Ethiopia from 2010-2014: a descriptive retrospective study. PLoS One . 2016;11(10):1–12. doi: 10.1371/journal.pone.0161998. [DOI] [PMC free article] [PubMed] [Google Scholar]
- 11.Adane F., Seyoum G. Prevalence and associated factors of birth defects among newborns at referral hospitals in Northwest Ethiopia. The Ethiopian Journal of Health Development . 2018;32(3) [Google Scholar]
- 12.Liberati A., Altman D. G., Tetzlaff J., et al. The PRISMA statement for reporting systematic reviews and meta-analyses of studies that evaluate health care interventions: explanation and elaboration. Journal of Clinical Epidemiology . 2009;62(10):e1–34. doi: 10.1016/j.jclinepi.2009.06.006. [DOI] [PubMed] [Google Scholar]
- 13.Grant J., Hunter A. Measuring inconsistency in knowledgebases. Journal of Intelligent Information System . 2006;27(2):159–184. doi: 10.1007/s10844-006-2974-4. [DOI] [Google Scholar]
- 14.Adeleye A. O., Olowookere K. G. Central nervous system congenital anomalies: a prospective neurosurgical observational study from Nigeria. Congenital Anomalies . 2009;49(4):258–261. doi: 10.1111/j.1741-4520.2009.00241.x. [DOI] [PubMed] [Google Scholar]
- 15.Nasri K., Ben Fradj M. K., Hamdi T., et al. Epidemiology of neural tube defect subtypes in Tunisia, 1991-2011. Pathology, Research and Practice . 2014;210(12):944–952. doi: 10.1016/j.prp.2014.06.027. [DOI] [PubMed] [Google Scholar]
- 16.Mekonnen D., Taye M., Worku W. Congenital anomalies among newborn babies in Felege-Hiwot comprehensive specialized referral hospital, Bahir Dar, Ethiopia. Scientific Reports . 2021;11(1):1–8. doi: 10.1038/s41598-021-90387-0. [DOI] [PMC free article] [PubMed] [Google Scholar]
- 17.Mekonen H. K., Nigatu B., Lamers W. H. Birth weight by gestational age and congenital malformations in northern Ethiopia. BMC Pregnancy and Childbirth . 2015;15(1):1–8. doi: 10.1186/s12884-015-0507-2. [DOI] [PMC free article] [PubMed] [Google Scholar]
- 18.Sorri G., Mesfin E. Patterns of neural tube defects at two teaching hospitals in Addis Ababa, Ethiopia a three years retrospective study. Ethiopian Medical Journal . 2015;53(3):119–126. [PubMed] [Google Scholar]
- 19.Aynalem Tesfay F., Bulte Aga F., Sebsibie T. G. Determinants of neural tube defect among children at zewditu memorial hospital, addis ababa, ethiopia a case control study. Nursing Science . 2021;15, article 100318 doi: 10.1016/j.ijans.2021.100318. [DOI] [Google Scholar]
- 20.Gashaw A., Shine S., Yimer O., Wodaje M. Risk factors associated to neural tube defects among mothers who gave birth in North Shoa Zone Hospitals, Amhara Region, Ethiopia 2020: case control study. PLoS One . 2021;16(4) doi: 10.1371/journal.pone.0250719. [DOI] [PMC free article] [PubMed] [Google Scholar]
- 21.Study C, Mulu G. B., Atinafu B. T., Tarekegn F. N. Factors associated with neural tube defects among newborns delivered at Debre Berhan Specialized Hospital, North Eastern Ethiopia, 2021. Case-control study. Frontiers in Pediatrics . 2022;9, article 795637 doi: 10.3389/fped.2021.795637. [DOI] [PMC free article] [PubMed] [Google Scholar]
- 22.Tadesse A. W., Kassa A. M., Aychiluhm S. B. Determinants of neural tube defects among newborns in Amhara region, Ethiopia: a case-control study. International Journal Of Pediatrics . 2020;2020:9. doi: 10.1155/2020/5635267.5635267 [DOI] [PMC free article] [PubMed] [Google Scholar]
- 23.Estifanos D. The prevalence, trend, and associated demographic factors of neural tube defects at Orotta National Referral Maternity Hospital, Asmara: retrospective record review study. Science Journal of Public Health . 2017;5(6):p. 452. doi: 10.11648/j.sjph.20170506.17. [DOI] [Google Scholar]
- 24.Githuku J. N., Azofeifa A., Valencia D., et al. Assessing the prevalence of spina bifida and encephalocele in a Kenyan hospital from 2005-2010: implications for a neural tube defects surveillance system. The Pan African Medical Journal . 2014;18:p. 60. doi: 10.11604/pamj.2014.18.60.4070. [DOI] [PMC free article] [PubMed] [Google Scholar]
- 25.Kishimba R. S., Mpembeni R., Mghamba J. M., Goodman D., Valencia D. Birth prevalence of selected external structural birth defects at four hospitals in Dar es Salaam, Tanzania, 2011-2012. Journal of Global Health . 2015;5(2):1–6. doi: 10.7189/jogh.05.020411. [DOI] [PMC free article] [PubMed] [Google Scholar]
- 26.Barlow-Mosha L., Serunjogi R., Kalibbala D., et al. Prevalence of neural tube defects, maternal HIV status, and antiretroviral therapy from a hospital-based birth defect surveillance in Kampala, Uganda. Birth Defects Research . 2022;114(3–4):95–104. doi: 10.1002/bdr2.1964. [DOI] [PMC free article] [PubMed] [Google Scholar]
- 27.Mumpe-Mwanja D., Barlow-Mosha L., Williamson D., et al. A hospital-based birth defects surveillance system in Kampala, Uganda. BMC Pregnancy and Childbirth . 2019;19(1):1–9. doi: 10.1186/s12884-019-2542-x. [DOI] [PMC free article] [PubMed] [Google Scholar]
- 28.Atlaw D., Worku A., Taye M., Woldeyehonis D., Muche A. Neural tube defect and associated factors in Bale zone hospitals, Southeast Ethiopia. Journal of Pregnancy and Child Health . 2019;6(3):p. 412. [Google Scholar]
- 29.Berhane A., Belachew T. Trend and burden of neural tube defects among cohort of pregnant women in Ethiopia: where are we in the prevention and what is the way forward? PLoS One . 2022;17(2, article e0264005) doi: 10.1371/journal.pone.0264005. [DOI] [PMC free article] [PubMed] [Google Scholar]
- 30.Berihu B. A., Welderufael A. L., Berhe Y., et al. Maternal risk factors associated with neural tube defects in Tigray regional state of Ethiopia. Brain and Development . 2019;41(1):11–18. doi: 10.1016/j.braindev.2018.07.013. [DOI] [PubMed] [Google Scholar]
- 31.Berihu B. A., Welderufael A. L., Berhe Y., et al. High burden of neural tube defects in Tigray, northern Ethiopia: hospital-based study. PLoS One . 2018;13(11, article e0206212) doi: 10.1371/journal.pone.0206212. [DOI] [PMC free article] [PubMed] [Google Scholar]
- 32.Gedefaw A., Teklu S., Tadesse B. T. Magnitude of neural tube defects and associated risk factors at three teaching hospitals in Addis Ababa, Ethiopia. BioMed Research International . 2018;2018:10. doi: 10.1155/2018/4829023.4829023 [DOI] [PMC free article] [PubMed] [Google Scholar]
- 33.Gedamu S., Sendo E. G., Daba W. Congenital anomalies and associated factors among newborns in Bishoftu General Hospital, Oromia, Ethiopia: a retrospective study. Journal of Environmental and Public Health . 2021;2021:6. doi: 10.1155/2021/2426891.2426891 [DOI] [PMC free article] [PubMed] [Google Scholar]
- 34.Kindie Z., Mulu A. Prevalence of neural tube defects at Debre Berhan Referral Hospital, North Shewa, Ethiopia. A hospital based retrospective crosssection study. PLoS One . 2022;17(2, article e0261177) doi: 10.1371/journal.pone.0261177. [DOI] [PMC free article] [PubMed] [Google Scholar]
- 35.Singh S., Chukwunyere D., Omembelede J., Onankpa B. Foetal congenital anomalies: an experience from a tertiary health institution in North-West Nigeria (2011-2013) The Nigerian Postgraduate Medical Journal . 2015;22(3):174–178. doi: 10.4103/1117-1936.170743. [DOI] [PubMed] [Google Scholar]
- 36.Ugwu R. O., Eneh A. U., Oruamabo R. S. Neural tube defects in a university teaching hospital in southern Nigeria: trends and outcome. Nigerian Journal of Medicine . 2007;16(4):368–371. doi: 10.4314/njm.v16i4.37340. [DOI] [PubMed] [Google Scholar]
- 37.Abbey M., Oloyede O. A., Bassey G., et al. Prevalence and pattern of birth defects in a tertiary health facility in the Niger delta area of Nigeria. International Journal of Women's Health . 2017;Volume 9:115–121. doi: 10.2147/IJWH.S108905. [DOI] [PMC free article] [PubMed] [Google Scholar]
- 38.Airede K. I. Neural tube defects in the middle belt of Nigeria. Journal of Tropical Pediatrics . 1992;38(1):27–30. doi: 10.1093/tropej/38.1.27. [DOI] [PubMed] [Google Scholar]
- 39.Anyanwu L.-J. C., Danborno B., Hamman W. O. The prevalence of neural tube defects in live born neonates in Kano, north-western Nigeria. Journal of Medicine . 2015;2(3):p. 105. doi: 10.4103/2384-5147.164417. [DOI] [Google Scholar]
- 40.Bello M., Abubakar A., Akuhwa R., Yahaya S., Adamu S., Mava Y. Neural tube defects: epidemiologic factors, clinical presentation and outcome in north eastern Nigeria. Sahel Medical Journal . 2008;11(1) doi: 10.4314/smj2.v11i1.12962. [DOI] [Google Scholar]
- 41.Chukwubuike K., Ozor I., Enyi N. Prevalence and pattern of birth defects in the two tertiary hospitals in Enugu, south East Nigeria: a hospital-based observational study. African Journal of Paediatric Surgery . 2020;17(3):85–89. doi: 10.4103/ajps.AJPS_59_20. [DOI] [PMC free article] [PubMed] [Google Scholar]
- 42.Ekanem T. B., Okon D. E., Akpantah A. O., Mesembe O. E., Eluwa M. A., Ekong M. B. Prevalence of congenital malformations in Cross River and Akwa Ibom states of Nigeria from 1980–2003. Congenital Anomalies . 2008;48(4):167–170. doi: 10.1111/j.1741-4520.2008.00204.x. [DOI] [PubMed] [Google Scholar]
- 43.Ekwochi U., Asinobi I. N., Osuorah D. C. I., et al. Pattern of congenital anomalies in newborn: a 4-year surveillance of newborns delivered in a tertiary healthcare facility in the South-East Nigeria. Journal of Tropical Pediatrics . 2018;64(4):304–311. doi: 10.1093/tropej/fmx067. [DOI] [PubMed] [Google Scholar]
- 44.Nnadi D., Singh S. The prevalence of neural tube defects in North-West Nigeria. Saudi Journal for Health Sciences . 2016;5(1):p. 6. doi: 10.4103/2278-0521.182858. [DOI] [Google Scholar]
- 45.Ugwu R. O., Eneh A. U. Myelomeningocoele in Dizygotic Twins. Nigerian Journal of Clinical Practice . 2009;12:196–199. [PubMed] [Google Scholar]
- 46.Forci K., Bouaiti E. A., Alami M. H., Mdaghri Alaoui A., Thimou Izgua A. Incidence of neural tube defects and their risk factors within a cohort of Moroccan newborn infants. BMC Pediatrics . 2021;21(1):1–10. doi: 10.1186/s12887-021-02584-5. [DOI] [PMC free article] [PubMed] [Google Scholar]
- 47.El-moghrabi H. Congenital malformations and its relation with consanguineous marriages at congenital malformations and its relation with consanguineous marriages at Benghazi Libya . Journal of Biomedical Science and Research; 2020. [Google Scholar]
- 48.Laamiri F. Z. Prevalence of neural tube closure defects and the oro-facial clefts, during three consecutive years (2012-2014) in 20 public hospitals in Morocco. World Journal of Pharmaceutical Research . 2017;6(3):101–118. [Google Scholar]
- 49.Radouani M. A., Chahid N., Benmiloud L., et al. Prevalence of neural tube defects: Moroccan study 2008-2011. Open Journal of Pediatrics . 2015;5(3):248–255. doi: 10.4236/ojped.2015.53038. [DOI] [Google Scholar]
- 50.Nasri K., Ben Fradj M. K., Aloui M., et al. An increase in spina bifida cases in Tunisia, 2008-2011. Pathology, Research and Practice . 2015;211(5):369–373. doi: 10.1016/j.prp.2014.12.011. [DOI] [PubMed] [Google Scholar]
- 51.Nasri K., Ben Fradj M. K., Feki M., et al. Maternal 25-hydroxyvitamin D level and the occurrence of neural tube defects in Tunisia. International Journal of Gynecology & Obstetrics . 2016;134(2):131–134. doi: 10.1016/j.ijgo.2016.01.014. [DOI] [PubMed] [Google Scholar]
- 52.Omer I. M., Abdullah O. M., Mohammed I. N., Abbasher L. A. Research: prevalence of neural tube defects Khartoum, Sudan august 2014-July 2015. BMC Research Notes . 2016;9(1):1–4. doi: 10.1186/s13104-016-2298-6. [DOI] [PMC free article] [PubMed] [Google Scholar]
- 53.Perinatal N. Neural Tube Defects in Australia . Australian Institute of Health and Welfare 2008; 2016. [Google Scholar]
- 54.Bourouba R., Houcher B., Akar N. Risk factors of neural tube defects: a reality of Batna region in Algeria. Egyptian Journal of Medical Human Genetics . 2018;19(3):225–229. doi: 10.1016/j.ejmhg.2017.10.003. [DOI] [Google Scholar]
- 55.Houcher B., Bourouba R., Djabi F., Houcher Z. The prevalence of neural tube defects in Sétif University Maternity Hospital, Algeria-3 years review (2004-2006) Pteridines . 2008;19(1):12–18. doi: 10.1515/pteridines.2008.19.1.12. [DOI] [Google Scholar]
- 56.Cornell J., Nelson M. M., Beighton P. Neural tube defects in the Cape Town area, 1975-1980. South African Medical Journal . 1983;64(3):83–84. [PubMed] [Google Scholar]
- 57.Buccimazza S. S., Molteno C. D., Dunne T. T., Viljoen D. L. Prevalence of neural tube defects in Cape Town, South Africa. Teratology . 1994;50(3):194–199. doi: 10.1002/tera.1420500304. [DOI] [PubMed] [Google Scholar]
- 58.Kromberg J. G. R., Jenkins T. Common birth defects in south African blacks. South African Medical Journal . 1982;62(17):599–602. [PubMed] [Google Scholar]
- 59.Krzesinski E. I., Geerts L., Urban M. F. Neural tube defect diagnosis and outcomes at a tertiary south African hospital with intensive case ascertainment. South African Medical Journal . 2019;109(9):698–703. doi: 10.7196/SAMJ.2019.v109i9.13863. [DOI] [PubMed] [Google Scholar]
- 60.Saib M. Z., Dhada B. L., Aldous C., Malherbe H. L. Observed birth prevalence of congenital anomalies among live births at a regional facility in KwaZulu Natal Province, South Africa. PLoS One . 2021;16(8):1–17. doi: 10.1371/journal.pone.0255456. [DOI] [PMC free article] [PubMed] [Google Scholar]
- 61.Theron N., Joubert G., Henderson B. D. Neural tube defects in the free state province from 2012 to 2016. Is there an increase? Southern African Journal of HIV Medicine . 2020;21(1):1–7. doi: 10.4102/sajhivmed.v21i1.1134. [DOI] [PMC free article] [PubMed] [Google Scholar]
- 62.Venter P. A., Christianson A. L., Hutamo C. M., Makhura M. P., Gericke G. S. Congenital anomalies in rural black south-African neonates - a silent epidemic? South African Medical Journal . 1995;85(1):15–20. [PubMed] [Google Scholar]
- 63.Zash R., Holmes L., Diseko M., et al. Neural-tube defects and antiretroviral treatment regimens in Botswana. The New England Journal of Medicine . 2019;381(9):827–840. doi: 10.1056/NEJMoa1905230. [DOI] [PMC free article] [PubMed] [Google Scholar]
- 64.Kalisya L. M., Nyavandu K., Machumu B., Kwiratuwe S., Rej P. H. Patterns of congenital malformations and barriers to care in eastern democratic republic of Congo. PLoS One . 2015;10(7):1–10. doi: 10.1371/journal.pone.0132362. [DOI] [PMC free article] [PubMed] [Google Scholar]
- 65.Garcon J., Danielle B., Civil M. F. Malformations Congenitales: prevalence and risk factors. Marsyas . 2021;6(34) [Google Scholar]
- 66.Kayembe-Kitenge T., Musa Obadia P., Kasole Lubala T., et al. Incidence of congenital malformations and proximity to mining in Lubumbashi, DR Congo. Environmental Epidemiology . 2019;3:p. 194. doi: 10.1097/01.EE9.0000607948.37552.92. [DOI] [Google Scholar]
- 67.Adane F., Afework M., Seyoum G., Gebrie A. Prevalence and associated factors of birth defects among newborns in sub-Saharan African countries: a systematic review and meta-analysis. The Pan African Medical Journal . 2020;36:1–22. doi: 10.11604/pamj.2020.36.19.19411. [DOI] [PMC free article] [PubMed] [Google Scholar]
- 68.Kishimba R. S., Mpembeni R., Mghamba J. Factors associated with major structural birth defects among newborns delivered at Muhimbili National Hospital and municipal hospitals in Dar Es Salaam, Tanzania 2011–2012. The Pan African Medical Journal . 2015;20:1–7. doi: 10.11604/pamj.2015.20.153.4492. [DOI] [PMC free article] [PubMed] [Google Scholar]
- 69.Oumer M., Tazebew A., Silamsaw M. Birth prevalence of neural tube defects and associated risk factors in Africa: a systematic review and meta-analysis. BMC Pediatrics . 2021;21(1):1–13. doi: 10.1186/s12887-021-02653-9. [DOI] [PMC free article] [PubMed] [Google Scholar]
- 70.Taye M., Afework M., Fantaye W., Diro E., Worku A. Congenital anomalies prevalence in Addis Ababa and the Amhara region, Ethiopia: a descriptive cross-sectional study. BMC Pediatrics . 2019;19(1):1–11. doi: 10.1186/s12887-019-1596-2. [DOI] [PMC free article] [PubMed] [Google Scholar]
- 71.Nasri K., Ben Fradj M. K., Touati A., et al. Association of maternal homocysteine and vitamins status with the risk of neural tube defects in Tunisia: a case–control study. Birth Defects Research Part A: Clinical and Molecular Teratology . 2015;103(12):1011–1020. doi: 10.1002/bdra.23418. [DOI] [PubMed] [Google Scholar]
- 72.Singh K., Johnson W. M. S., Archana R., Kumar A. The prevalence and pattern of neural tube defects and other major congenital malformations of nervous system detected at birth in Barbados. Journal of the Anatomical Society of India . 2016;65:S20–S24. doi: 10.1016/j.jasi.2016.08.001. [DOI] [Google Scholar]
- 73.Feuchtbaum L. B., Currier R. J., Riggle S., Roberson M., Lorey F. W., Cunningham G. C. Neural tube defect prevalence in California (1990-1994): eliciting patterns by type of defect and maternal race/ethnicity. Genetic Testing . 1999;3(3):265–272. doi: 10.1089/109065799316572. [DOI] [PubMed] [Google Scholar]
- 74.Lo A., Polšek D., Sidhu S. Estimating the burden of neural tube defects in low- and middle-income countries. Journal of Global Health . 2014;4(1):1–9. doi: 10.7189/jogh.04.010402. [DOI] [PMC free article] [PubMed] [Google Scholar]
- 75.Atlaw D., Tekalegn Y., Sahiledengle B., et al. Magnitude and determinants of neural tube defect in Africa: a systematic review and meta-analysis. BMC Pregnancy and Childbirth . 2021;21(1):1–15. doi: 10.1186/s12884-021-03848-9. [DOI] [PMC free article] [PubMed] [Google Scholar]
- 76.Allagh K. P., Shamanna B. R., Murthy G. V. S., et al. Birth prevalence of neural tube defects and orofacial clefts in India: a systematic review and meta-analysis. PLoS One . 2015;10(3):1–15. doi: 10.1371/journal.pone.0118961. [DOI] [PMC free article] [PubMed] [Google Scholar]
- 77.Bhide P., Sagoo G. S., Moorthie S., Burton H., Kar A. Systematic review of birth prevalence of neural tube defects in India. Birth Defects Research Part A: Clinical and Molecular Teratology . 2013;97(7):437–443. doi: 10.1002/bdra.23153. [DOI] [PubMed] [Google Scholar]
- 78.Bationo F., Songré-Ouattara L. T., Hama-Ba F., et al. Folate status of women and children in Africa–current situation and improvement strategies. Food Reviews International . 2020;36(1):1–14. doi: 10.1080/87559129.2019.1608558. [DOI] [Google Scholar]
- 79.Orioli I. M., Lima do Nascimento R., López-Camelo J. S., Castilla E. E. Effects of folic acid fortification on spina bifida prevalence in Brazil. Birth Defects Research Part A: Clinical and Molecular Teratology . 2011;91(9):831–835. doi: 10.1002/bdra.20830. [DOI] [PubMed] [Google Scholar]
- 80.Rosenthal J., Casas J., Taren D., Alverson C. J., Flores A., Frias J. Neural tube defects in Latin America and the impact of fortification: a literature review. Public Health Nutrition . 2014;17(3):537–550. doi: 10.1017/S1368980013000256. [DOI] [PMC free article] [PubMed] [Google Scholar]
- 81.Oumer M., Taye M., Aragie H., Tazebew A. Prevalence of spina bifida among newborns in Africa: a systematic review and meta-analysis. Scientifica . 2020;2020:12. doi: 10.1155/2020/4273510.4273510 [DOI] [PMC free article] [PubMed] [Google Scholar]
- 82.Oumer M., Kibret A. A., Girma A., Tazebew A., Silamsaw M. Prevalence of anencephaly in Africa: a systematic review and meta-analysis. Scientific Reports . 2021;11(1, article 23707) doi: 10.1038/s41598-021-02966-w. [DOI] [PMC free article] [PubMed] [Google Scholar]
- 83.Oumer M., Kassahun A. D. Birth prevalence of encephalocele in Africa: a systematic review and meta-analysis. BMJ Paediatrics Open . 2021;5(1, article e001117) doi: 10.1136/bmjpo-2021-001117. [DOI] [Google Scholar]
- 84.Atta C. A. M., Fiest K. M., Frolkis A. D., et al. Global birth prevalence of spina bifida by folic acid fortification status: a systematic review and meta-analysis. American Journal of Public Health . 2016;106(1):p. 159. doi: 10.2105/AJPH.2015.302902a. [DOI] [PMC free article] [PubMed] [Google Scholar]
- 85.Chen C., Bifida S. Chromosomal abnormalities associated with NTDs in fetal and newborn patients. Taiwanese Journal of Obstetrics & Gynecology . 2007;46(4):325–335. doi: 10.1016/S1028-4559(08)60002-9. [DOI] [PubMed] [Google Scholar]
- 86.Chen C. Chromosomal abnormalities associated with neural tube defects (II): partial aneuploidy. Taiwanese Journal of Obstetrics & Gynecology . 2007;46(4):336–351. doi: 10.1016/S1028-4559(08)60003-0. [DOI] [PubMed] [Google Scholar]
- 87.Kurahashi H., Tsutsumi M., Nishiyama S., Kogo H., Inagaki H., Ohye T. Molecular basis of maternal age-related increase in oocyte aneuploidy. Congenital Anomalies . 2012;52(1):8–15. doi: 10.1111/j.1741-4520.2011.00350.x. [DOI] [PubMed] [Google Scholar]
- 88.Lakhani C. M., Tierney B. T., Jian A. K., Pate M. Y. C. Barriers to use contraceptive methods among rural young married couples in Maharashtra, India: Qualitative findings. Physiology & Behavior . 2019;176(3):139–148. [Google Scholar]
- 89.Suarez L., Felkner M., Brender J. D., Canfield M., Hendricks K. Maternal exposures to cigarette smoke, alcohol, and street drugs and neural tube defect occurrence in offspring. Maternal and Child Health Journal . 2008;12(3):394–401. doi: 10.1007/s10995-007-0251-y. [DOI] [PubMed] [Google Scholar]
- 90.Brender J. D., Felkner M., Suarez L., Canfield M. A., Henry J. P. Maternal pesticide exposure and neural tube defects in Mexican Americans. Annals of Epidemiology . 2010;20(1):16–22. doi: 10.1016/j.annepidem.2009.09.011. [DOI] [PubMed] [Google Scholar]
- 91.Kulkarni M. L., Kurian M. Consanguinity and its effect on fetal growth and development: a south Indian study. Journal of Medical Genetics . 1990;27(6):348–352. doi: 10.1136/jmg.27.6.348. [DOI] [PMC free article] [PubMed] [Google Scholar]
- 92.Cointegration P., Neural M. L. P. The relationship among political instability, consanguineous marriage, genetic structure and economic development: panel cointegration the relationship among political instability, consanguineous marriage, genetic structure and economic development . Panel Cointegration Regression , Panel Cointegration MLP Neural Network and Panel Cointegration SVM Models 1; 2011. [Google Scholar]
- 93.Brook F. A., Estibeiro J. P., Copp A. J. Female predisposition to cranial neural tube defects is not because of a difference between the sexes in the rate of embryonic growth or development during neurulation. Journal of Medical Genetics . 1994;31(5):383–387. doi: 10.1136/jmg.31.5.383. [DOI] [PMC free article] [PubMed] [Google Scholar]
- 94.Liu J., Xie J., Li Z., Greene N. D. E., Ren A. Sex differences in the prevalence of neural tube defects and preventive effects of folic acid (FA) supplementation among five counties in northern China: results from a population-based birth defect surveillance programme. BMJ Open . 2018;8(11, article e022565) doi: 10.1136/bmjopen-2018-022565. [DOI] [PMC free article] [PubMed] [Google Scholar]
- 95.Reefhuis J., Fitzharris L. F., Gray K. M., Nesheim S., Tinker S. C., Isenburg J. Neural tube defects in pregnancies among women with diagnosed HIV infection — 15 jurisdictions, 2013-2017. MMWR. Morbidity and Mortality Weekly Report . 2020;69(1):1–5. doi: 10.15585/mmwr.mm6901a1. [DOI] [PMC free article] [PubMed] [Google Scholar]
- 96.Milunsky A., Ulcickas M., Rothman K. J., Willett W., Jick S. S., Jick H. Maternal heat exposure and neural tube defects. JAMA: The Journal of the American Medical Association . 1992;268(7):882–885. doi: 10.1001/jama.1992.03490070064043. [DOI] [PubMed] [Google Scholar]
- 97.Suarez L., Cardarelli K., Hendricks K. Maternal stress, social support, and risk of neural tube defects among Mexican Americans. Epidemiology . 2003;14(5):612–616. doi: 10.1097/01.ede.0000073270.39780.e9. [DOI] [PubMed] [Google Scholar]
- 98.Cuckle H. S. Recurrence risk of neural tube defects following a miscarriage. Prenatal Diagnosis . 1983;3(4):287–289. doi: 10.1002/pd.1970030404. [DOI] [PubMed] [Google Scholar]
Associated Data
This section collects any data citations, data availability statements, or supplementary materials included in this article.
Data Availability Statement
The datasets used and/or evaluated in this study are available from the corresponding author upon reasonable request.