

Abstract
Neuroinflammation has been implicated in frontotemporal lobar degeneration (FTLD) pathophysiology, including in genetic forms with microtubule‐associated protein tau (MAPT) mutations (FTLD‐MAPT) or chromosome 9 open reading frame 72 (C9orf72) repeat expansions (FTLD‐C9orf72). Iron accumulation as a marker of neuroinflammation has, however, been understudied in genetic FTLD to date. To investigate the occurrence of cortical iron accumulation in FTLD‐MAPT and FTLD‐C9orf72, iron histopathology was performed on the frontal and temporal cortex of 22 cases (11 FTLD‐MAPT and 11 FTLD‐C9orf72). We studied patterns of cortical iron accumulation and its colocalization with the corresponding underlying pathologies (tau and TDP‐43), brain cells (microglia and astrocytes), and myelination. Further, with ultrahigh field ex vivo MRI on a subset (four FTLD‐MAPT and two FTLD‐C9orf72), we examined the sensitivity of T2*‐weighted MRI for iron in FTLD. Histopathology showed that cortical iron accumulation occurs in both FTLD‐MAPT and FTLD‐C9orf72 in frontal and temporal cortices, characterized by a diffuse mid‐cortical iron‐rich band, and by a superficial cortical iron band in some cases. Cortical iron accumulation was associated with the severity of proteinopathy (tau or TDP‐43) and neuronal degeneration, in part with clinical severity, and with the presence of activated microglia, reactive astrocytes and myelin loss. Ultra‐high field T2*‐weighted MRI showed a good correspondence between hypointense changes on MRI and cortical iron observed on histology. We conclude that iron accumulation is a feature of both FTLD‐MAPT and FTLD‐C9orf72 and is associated with pathological severity. Therefore, in vivo iron imaging using T2*‐weighted MRI or quantitative susceptibility mapping may potentially be used as a noninvasive imaging marker to localize pathology in FTLD.
Keywords: C9orf72, frontotemporal lobar degeneration, iron accumulation, MAPT, neuroinflammation
1. INTRODUCTION
Frontotemporal dementia (FTD), the second most common early onset dementia, is clinically characterized by progressive behavioral change, executive dysfunction and/or language difficulties. [1, 2]. FTD is hereditary in ~30% of the cases, with mutations in microtubule‐associated protein tau (MAPT), progranulin (GRN), and chromosome 9 open reading frame 72 (C9orf72) as most common gene defects [3, 4]. Pathologically, brains of FTD patients have frontotemporal lobar degeneration (FTLD), which includes two major groups based on the main proteinopathy: tauopathies (FTLD‐Tau) and TDP‐43 proteinopathies (FTLD‐TDP). In genetic FTD, MAPT mutations are associated with FTLD‐Tau, whereas GRN and C9orf72 lead to FTLD‐TDP [2, 5, 6]. The pathophysiological processes leading to FTLD are still unclear, but neuroinflammation has been implicated as a potential contributive or even etiological factor [7]; its exact role may vary in different genetic and pathological subtypes of FTLD.
Iron accumulation as a disease‐modifying factor and potential noninvasive biomarker, associated with pathology and neuroinflammation, has received much attention within the Alzheimer's Disease (AD) field. Iron‐sensitive MRI contrast and quantitative techniques such as susceptibility‐weighted MRI and quantitative‐susceptibility mapping (QSM) have previously shown increased iron levels within the cortex of AD patients [8, 9, 10, 11]. Iron accumulation measured through ex vivo MRI has been found to strongly correlate with both the pathological burden and spatial distribution of tau pathology over the cortex [9, 12, 13]. The same association between iron deposition and tau aggregates has been confirmed in vivo by a study combining tau PET and iron‐sensitive MRI (QSM) in AD patients [14]. Pathophysiologically, iron accumulation may be (in part) mediated by neuroinflammation, as activated glial cells and proinflammatory cytokines disrupt brain iron homeostasis, leading to iron overload and deposition [15]. In AD, iron accumulation strongly correlated with ferritin immunostainings, and with the presence of ferrihydrite minerals, indicating that nonheme iron is largely stored in ferritin complexes [16, 17], although labile iron is also present [9, 12].
Compared to AD, there is only sparse data on iron accumulation in FTLD. Two in vivo MRI studies showed that brain iron levels are increased in patients with sporadic FTD or with clinical PSP (associated with FTLD‐Tau) [18, 19]. However, these series are small and heterogeneous, without genetic or pathological confirmation. Recently, a single ex vivo MRI study comparing a small group of four FTLD‐Tau and three FTLD‐TDP found iron‐rich patterns distinctive of these pathologies, potentially associated with different mechanisms of neuroinflammation [20]. In particular, laminar and cellular differences in cortical iron distribution were found. FTLD‐Tau showed primarily deep cortical iron deposition, associated with iron‐rich hypertrophic microglia, while FTLD‐TDP was characterized by superficial cortical iron, localized in astrocytic processes surrounding small blood vessels and dystrophic microglia. While this study looked at sporadic cases, iron abnormalities in genetic forms of FTLD have not been studied thus far, to our knowledge.
The objective of this study was to gain insight into the occurrence of cortical iron accumulation in genetic FTLD with tau or TDP‐43 pathology, studying a cohort of cases with FTLD due to MAPT mutations (FTLD‐MAPT) or C9orf72 repeat expansions (FTLD‐C9orf72). We hypothesized that iron accumulation would be present in both FTLD‐MAPT and FTLD‐C9orf72 as a marker of pathology‐associated neuroinflammation, and that the two groups would show different pathology‐specific patterns of iron accumulation, similar to those observed in sporadic variants of these pathologies [20]. We performed histopathology on the frontal and temporal cortex to delineate iron accumulation patterns and colocalization with the corresponding underlying pathologies and brain cells. In addition, we performed ultrahigh field ex vivo MRI on a subset of cases (N = 6) to examine the sensitivity of T2*‐weighted MRI to detect iron accumulation in FTLD.
2. METHODS
2.1. Study design
Formalin‐fixed paraffin‐embedded (FFPE) tissue of frontal and temporal cortex from 11 FTLD‐MAPT and 11 FTLD‐C9orf72 cases was included for histological examination. Histological stainings for tau, TDP‐43, amyloid, iron, microglia, astrocytes, and myelin were performed. Formalin‐fixed tissue of a subset with most recent autopsies (from 2018 onwards: four FTLD‐MAPT and two FTLD‐C9orf72) underwent high‐resolution 7 T MRI to investigate the colocalization of histological iron with MRI contrast changes (Figure 1). For an assessment of clinical severity, the global CDR® plus NACC FTLD (FTLD‐CDR) score [21] prior to death was retrospectively scored based on detailed clinical data from clinical charts and autopsy reports.
FIGURE 1.

Schematic overview of the study design. Formalin‐fixed paraffin‐embedded tissue of the frontal cortex (i.e., middle frontal gyrus) and temporal cortex (i.e., either temporal pole [TP] or middle temporal gyrus [MTG]) of 11 FTLD‐MAPT and 11 FTLD‐C9orf72 cases was included for histological examination. Of these 22 cases, formalin‐fixed tissue of 4 FTLD‐MAPT and 2 FTLD‐C9orf72 cases was included for high‐resolution 7 T MRI. Anatomical images have been obtained and adapted from the Allen Reference Atlas (Adult Human). C9orf72, chromosome 9 open reading frame 72; FTLD, frontotemporal lobar degeneration; MAPT, microtubule‐associated protein tau
2.2. Postmortem brain material
FFPE tissue blocks from the right hemisphere of 11 FTLD‐MAPT and 11 FTLD‐C9orf72 cases were included. For all cases, the middle frontal gyrus was included, but depending on tissue availability either the temporal pole (N = 5) or the middle temporal cortex (N = 17) was included (Table 1). This tissue collected was collected at autopsy from one hemisphere, fixed in 10% neutral buffered formalin for 4 weeks and subsequently embedded in paraffin blocks.
TABLE 1.
Demographic and autopsy features of FTLD‐MAPT and FTLD‐C9orf72 groups.
| FTLD‐MAPT | FTLD‐C9orf72 | |
|---|---|---|
| N | 11 | 11 |
| Female (%) | 6 (54.5%) | 1 (9.1%)* |
| Clinical diagnosis | ||
| bvFTD (%) | 11/11 (100%) | 10/11 (90.9%) |
| PPA (%) | 0 | 1/11 (9.1%) |
| MAPT mutations | ||
| P301L (%) | 7 (63.6%) | |
| G272V (%) | 3 (27.3%) | |
| N296H (%) | 1 (9.1%) | |
| Age at death (yrs) | 57.0 ± 7.1 | 65.8 ± 9.6* |
| Disease duration (yrs) | 7.1 ± 3.8 | 8.2 ± 3.3 |
| PMI (h) | 6.0 ± 2.0 | 7.2 ± 3.8 |
| Copathology | ||
| Amyloid (%) | 1/11 (9.1%) a | 5/11 (45.5%) b |
| Tau (%) | 11/11 (100%) b | |
| Area temporal cortex | ||
| Temporal pole (%) | 10 (90.9%) | 7 (63.6%) |
| Middle temporal gyrus (%) | 1 (9.1%) | 4 (36.4%) |
Note: *p < 0.05.
Abbreviations: bvFTD, behavioral variant frontotemporal dementia; C9orf72, chromosome 9 open reading frame 72; FTLD‐MAPT, frontotemporal lobar degeneration with MAPT mutations; FTLD‐C9orf72, frontotemporal lobar degeneration with C9orf72 repeat expansions; MAPT, microtubule‐associated protein tau; PMI, postmortem interval; PPA, primary progressive aphasia.
One FTLD‐MAPT case had limited amyloid copathology as cerebral amyloid angiopathy (CAA), but no amyloid plaques.
All FTLD‐C9orf72 cases had some copathology, that is 11/11 tau (10 B1, 1 B2) and 5/11 amyloid (3 A1, 2 A2; 1 C0, 2 C1, and 2 C2).
From a subset of six FTLD cases (four FTLD‐MAPT and two FTLD‐C9orf72) additional formalin‐fixed tissue of the frontal and temporal cortex was available for postmortem ex vivo MRI, based on a maximum fixation duration of 4 years [22, 23]. As antibodies used for the detection of microglia on histology (Iba1) do not work properly on long‐fixed tissues [24], histology was not done on the same tissue used for the MRI but on adjacent FFPE tissue blocks. Thus, fixation time for histology was consistently 4 weeks, while fixation time for ex vivo MRI was 0.2–2.5 years (Table S1).
For histological comparison of the iron staining to a normal cortex, FFPE tissue of the middle temporal gyrus of four nondemented controls was included (F/72, F/89, F/91, and M/93). All material was obtained through the Netherlands Brain Bank (Netherlands Institute for Neuroscience, Amsterdam, Netherlands). These four controls have been used previously [13], but for this study all stainings were performed again to match the protocols for the FTLD cases.
At Netherlands Brain Bank, per protocol, paraffin‐embedded tissue was cut into 6 μm sections for immunohistochemical staining for tau, Aβ, TDP‐43, and alpha‐synuclein with well‐characterized antibodies. Neuropathological diagnosis was established using established criteria [25, 26, 27], the occurrence of age‐related copathology was noted and is reported in this article as ABC score [26]. Brain autopsy was carried out according to the Legal and Ethical Code of Conduct of the Netherlands Brain Bank. Anonymity of all subjects was preserved by using a de‐identified system for the tissue samples following Dutch ethical guidelines (Code for Proper Secondary Use of Human Tissue and Dutch Federation of Medical Scientific Societies). Informed consent was obtained prior to death.
2.3. Histology
All tissue blocks were serially cut into 20 μm and 5 μm sections. Cortical iron accumulation was detected using a modified Meguro protocol on 20 μm‐thick sections [28]. This staining method was originally thought to stain nonheme iron in its ferric form (Fe3+) [29], but it is now recognized as aspecific for either the ferric or ferrous state. In short, after deparaffinization in xylene and decreasing concentrations of ethanol in water, sections were first incubated in 1% potassium ferrocyanide (80 min). After washing, sections were incubated in methanol with 0.01 M NaN3 and 0.3% H2O2 for 100 min. Lastly, sections were washed with 0.1 M phosphate buffer followed by incubation in a solution containing 0.025% 303‐diaminobenzidine‐tetrahydrochloride (DAB, DakoCytomation) and 0.005% H2O2 in 0.1 M phosphate buffer for 80 min. The reaction was stopped by washing with tap water.
The 5 μm‐thick sections adjacent to the section stained for iron were used for the detection of phosphorylated tau (antiphospho‐tau monoclonal antibody [AT8], MN1020, thermo fisher scientific; dilution 1:400), phosphorylated TDP‐43 (antiphosphorylated TDP‐43 [409/410], CAC‐TIP‐PTD‐M01, Cosmo Bio; dilution 1:1000), amyloid beta (anti‐β‐Amyloid, 17–24 [clone 4G8], Biolegend; dilution 1:1000), microglia (anti‐Iba1 polyclonal rabbit, Wako Chemicals; dilution 1:1000), astrocytes (antihuman GFAP monoclonal mouse, Sigma‐Aldrich; dilution 1:250), and myelin (antimyelin proteolipid protein monoclonal mouse, Biorad; dilution 1:1000). After deparaffinization, an antigen retrieval step using 0.01 M sodium citrate followed for all sections. Next, sections were treated with 0.3% H2O2 and 0.125% NaN3 in methanol to block endogenous peroxidase activity. The primary antibody was incubated overnight at 4°C. The secondary antibody (Brightvision Poly‐HRP‐antiMs/Rb/Ra IgG one component, DPVO‐HRP 55, Immunologic for AT8, pTDP‐43, Iba‐1, and PLP; Polyclonal Swine Anti‐Rabbit Immunoglobulins/HRP, Dako for GFAP) was incubated for 60 min at room temperature. Signal enhancement was completed by immersion in DAB solution. The sections were counterstained with Harris Haematoxylin, dehydrated, cleared, and mounted with Entallan (Merck, Darmstadt, Germany). The slides were digitized using an automatic bright field microscope (Philips Ultra Fast Scanner, Philips, Netherlands) for microscopic evaluation.
For each subject the frontal and temporal cortex were scored for the severity of tau pathology (Figure S1), TDP‐43 pathology (Figure S2), neuronal degeneration (Figure S3), and amyloid copathology (Figure S4) using standardized ordinal scales [30, 31, 32], and for the presence of iron abnormalities [9, 13]. Slides were independently scored by two experienced investigators (MB, LAAG for tau, and TDP‐43 pathology; AR, LAAG for neuronal degeneration; HS, LAAG for amyloid copathology; BK, MB for iron abnormalities). In cases of discrepancy between the two raters, the slide was reviewed together and consensus was reached.
Cortical iron accumulation was scored using an adapted version of previously used categories for cortical iron accumulation in AD [9, 13], as one category (partially thickened cortical staining) was not observed within this study. We scored for the presence or absence of abnormal diffuse band‐shaped cortical iron staining (Figure 2E,F) as opposed to normal cortical iron staining, displaying sharply delineated cortical layers. This abnormality was observable as the typical diffuse band‐shaped pattern of increased iron labeling covering the mid‐cortical layers, hereafter named as “diffuse mid‐cortical iron band.” In some cases, an additional band‐shaped pattern of cortical iron was observed in the upper layers (in particular layer II) of the cortex, hereafter named as “superficial cortical iron band” (Figure 2G,H). All subjects were scored for the absence or presence of this abnormality. Additionally, we scored for the presence or absence of iron‐rich plaques as observed in association with amyloid pathology [9, 33]. Cortical iron bands and iron‐rich plaques were scored independently of each other, as these were distinct and recognizable abnormalities, and the presence of iron‐rich plaques did not prevent the assessment of cortical band‐shaped iron accumulation.
FIGURE 2.

Normal and abnormal cortical iron distribution in nondemented controls and frontotemporal lobar degeneration (FTLD) cases. (A–D) Normal cortical iron was observed in nondemented controls (A,B) and a subset of FTLD (C,D) as iron concentrated in the myelin rich areas of the white matter and the lines of Baillarger, observable as a well‐defined thin line covering layer IV of the cortex (arrow heads in A2 and B2). (E–H) Abnormal cortical iron was observed as a diffuse mid‐cortical band‐shaped iron staining covering the middle layers of the cortex (III/IV), sometimes extending to layer V (arrows in E2 and F2), or as superficial cortical iron band in layer II of the cortex (arrow heads in G and H). The superficial cortical iron band occurred in some cases as the only abnormality present (G), or in other cases in conjunction with the diffuse mid‐cortical band (H). Scale bar in zoom: 2 mm.
2.4. Postmortem MRI
The tissue blocks selected for postmortem MRI were put in a 50 mL tube (Greiner Bio‐One) and rinsed with phosphate buffered saline (PBS) for 24 h to partially restore the MRI relaxation parameters [22]. Before scanning, the PBS was replaced with Fomblin (LC08, Solvay), an MRI‐invisible proton‐free fluid. Care was taken to avoid the inclusion of air bubbles.
MRI scans were performed on a 7 T horizon bore Bruker MRI system equipped with a 38 mm transmit‐receive volume coil and Paravision 360 imaging software (Bruker Biospin, Ettlingen, Germany). Multiple gradient echo scans with a total scan time of 10 h were acquired for each tissue block. The following scan parameters were used during scanning: repetition time 150 ms, echo time (TE) 3.5 ms, delta TE 5 ms, 9 echoes, flip angle 25° at 100 μm isotropic resolution with 8 averages. A flowchart illustrating postmortem MRI procedures can be found in Figure S5.
The sixth echo (TE 28.5 ms, selected based on previous studies showing best contrast [9, 12]) was visually examined and compared with the iron staining obtained on a section derived from a tissue block adjacent to the tissue used for MRI. The same criteria as previously defined for iron‐induced MRI contrast changes in the cortex of AD patients were used to describe the cortex in FTLD‐MAPT and FTLD‐C9orf72 [9, 13]. In short, a normal cortex was defined as a homogeneous cortex containing two well‐defined layers separated by a thin layer with lower signal intensity compared to the other layers. This thin hypointense layer is previously described in cortical regions with highly myelinated layers, that is, the line of Baillarger [34]. An abnormal cortex showed an inhomogeneous cortex on MRI characterized by a granular/patchy structure containing a diffuse hypointense band covering the mid‐cortical layers, obscuring normal cortical lamination. Additionally, the presence of a thin superficial hypointense band in the upper layers, analogous to the superficial iron band on histology, was assessed.
2.5. Statistical analysis
Demographic characteristics were compared using independent t‐test for continuous data and chi‐square tests for categorical data. Histological iron scores (i.e., presence/absence of specific iron abnormalities) were compared using Chi‐Square tests, related to pathology ordinal scores using the Mann Whitney U test, and related to clinical variables (dichotomized disease duration: above vs. below median; dichotomized FTLD‐CDR: severe = 3 vs. mild/moderate <3) using Chi‐Square tests. All statistical analyses were performed with R statistical software, version 4.0.3.
3. RESULTS
3.1. Histology: Abnormal cortical iron is present in FTLD‐MAPT and FTLD‐C9orf72
The majority of FTLD‐MAPT cases showed an abnormal distribution of iron in 9/11 (81.8%) cases in both frontal and temporal cortex, while this occurred in 8/11 (72.7%) FTLD‐C9orf72 cases in the frontal cortex and 6/11 (54.5%) in the temporal cortex. Abnormal cortex was characterized by either diffuse mid‐cortical iron band and/or a superficial cortical iron band (Figure 2). These abnormalities were not present in nondemented control tissue (Figure 2A,B), confirming earlier findings in these and other control subjects [9, 13].
The diffuse mid‐cortical band appeared as band‐shaped iron staining covering the middle layers of the cortex (III/IV), obscuring the lines of Baillarger, extending into layer V in some cases (Figure 2E,F). This band occurred in FTLD‐MAPT in 8/11 (72.7%) cases in the frontal cortex and in 9/11 (81.8%) cases in the temporal cortex (9/11, 81.8%), while in FTLD‐C9orf72 it was present in 5/11 (45.5%) cases in the frontal cortex and 4/11 (36.4%) in the temporal cortex (Figure 3A). While the frequency of this diffuse mid‐cortical band did not differ between FTLD‐MAPT and FTLD‐C9orf72 in the frontal cortex (p = 0.386), there was a trend for more frequent occurrence of this abnormality in FTLD‐MAPT in the temporal cortex (p = 0.083).
FIGURE 3.

Occurrence of a diffuse mid‐cortical iron band and a superficial cortical iron band in FTLD‐MAPT and FTLD‐C9orf72. (A) A diffuse mid‐cortical iron band was found in the frontal cortex in 72.7% of the FTLD‐MAPT cases and 45.5% of the FTLD‐C9orf72 cases. In the temporal cortex, relatively more FTLD‐MAPT cases showed a diffuse mid‐cortical iron band, that is, 81.8% in FTLD‐MAPT compared to 36.4% in FTLD‐C9orf72 (statistical trend, p = 0.083). (B) A superficial cortical iron band in the frontal cortex was found in 54.5% of the FTLD‐MAPT and 27.3% of the FTLD‐C9orf72 cases. Within the temporal cortex 36.4% of the FTLD‐MAPT and 27.3% of the FTLD‐C9orf72 cases showed this abnormal cortical iron pattern. (C) The cooccurrence of both bands was relatively more frequent in FTLD‐MAPT, in particular in the frontal cortex (p = 0.042). Numbers in plot depict the number of cases in the different categories used in these comparisons. C9orf72, chromosome 9 open reading frame 72; FTLD, frontotemporal lobar degeneration; MAPT, microtubule‐associated protein tau.
Another abnormality was a superficial cortical iron band in layer II of the cortex (Figure 2G,H). This superficial band was present in FTLD‐MAPT in 6/11 (54.5%) cases in the frontal cortex and 4/11 (36.4%) cases in the temporal cortex, whereas FTLD‐C9orf72 showed this band in 3/11 (27.3%) cases in both frontal and temporal cortices (Figure 3B). The frequency of occurrence of the superficial cortical band did not differ between FTLD‐MAPT and FTLD‐C9orf72 neither in the frontal nor temporal cortex (p > 0.3). The cooccurrence of both diffuse mid‐cortical and superficial cortical bands was observed relatively more often in FTLD‐MAPT compared to FTLD‐C9orf72 (Figure 3C), in particular in the frontal cortex (p = 0.042).
The remaining cases (FTLD‐MAPT: 2/11 frontal, 2/11 temporal; FTLD‐C9orf72: 3/11 frontal, 5/11 temporal) showed no iron accumulation as mid‐cortical or superficial bands. These cases had a pattern comparable to that of nondemented control cases, showing a normal iron distribution on histology with iron concentrated in the lines of Baillarger, which are highly myelinated fibers that course in the internal granular layer (IV) and internal pyramidal layer (layer V), observable as a well‐defined thin line covering layer IV/V of the cortex (Figure 2A,B).
In 4/11 cases with FTLD‐C9orf72 (and none with FTLD‐MAPT), we additionally observed iron‐rich plaques in both the frontal and temporal cortex (Table S2), which cooccurred with either a mid‐cortical band (one frontal and one temporal), a superficial band (two frontal and one temporal) or an otherwise normal cortex (one frontal and two temporal).
3.2. Histology: Cortical iron and pathological severity
Further, we investigated the correlation between the occurrence of iron abnormalities and measures of pathological severity. In FTLD‐MAPT, tau pathology was predominantly found in upper layers II and III as well as in lower layers V and VI. In FTLD‐C9orf72, TDP‐43 pathology was most prominent in upper layers II and III but often also present throughout lower layers (IV–VI), especially in moderately or severely affected cases.
In FTLD‐MAPT cases, the presence of a diffuse mid‐cortical iron band was associated with higher severity of tau pathology in the frontal cortex (p = 0.045) but not in the temporal cortex (p = 0.272), which may be due to the small number of cases without a mid‐cortical band in this region (n = 2), both with mild tau pathology. In FTLD‐C9orf72 cases, higher TDP‐43 pathological severity was not associated with the presence of the diffuse mid‐cortical band (frontal: p = 0.335; temporal: p = 0.279); yet, we observed that the occurrence of a diffuse mid‐cortical iron band was always accompanied by a moderate‐to‐severe amount of TDP‐43 pathology (Figure 4). Additionally, the severity of neuronal degeneration was also positively associated with the occurrence of a diffuse mid‐cortical iron band in FTLD‐MAPT frontal cortex (p = 0.028) and temporal cortex (p = 0.037), as well as in FTLD‐C9orf72 frontal cortex (p = 0.037). While FTLD‐C9orf72 temporal cortex did not show a significant correlation (p = 0.508), most cases (3/4, 75%) with a diffuse mid‐cortical band had moderate or more severe neuronal degeneration (score ≥2, Figure 5).
FIGURE 4.

Association of the occurrence of the diffuse mid‐cortical iron band with proteinopathy severity in FTLD‐MAPT and FTLD‐C9orf72. (A) In FTLD‐MAPT, cases with moderate‐to‐severe tau pathology always had a diffuse mid‐cortical iron band in the frontal and temporal cortex. In FTLD‐C9orf72, the diffuse mid‐cortical iron band was only observed in cases with moderate‐to‐severe TDP‐43 pathology. Numbers in plot depict the number of cases in the different categories used in these comparisons. (B) Microscopic observation showed colocalization of relatively diffuse tau and TDP‐43 pathology in these cases and iron accumulation in the mid‐cortical layers corresponding to the laminar distribution of the diffuse mid‐cortical iron band. Scale bar in zoom = 100 μm. C9orf72, chromosome 9 open reading frame 72; FTLD, frontotemporal lobar degeneration; MAPT, microtubule‐associated protein tau.
FIGURE 5.

Association of the occurrence of the diffuse mid‐cortical iron band with neuronal degeneration in FTLD‐MAPT and FTLD‐C9orf72. In FTLD‐MAPT, cases with moderate‐to‐(very) severe neuronal degeneration always had a diffuse mid‐cortical iron band in the frontal and temporal cortex. Similarly, in FTLD‐C9orf72, all cases with severe or very severe neuronal degeneration had a diffuse mid‐cortical iron band in the frontal cortex, while this association was less evident in the temporal cortex. Numbers in plot depict the number of cases in the different categories used in these comparisons. C9orf72, chromosome 9 open reading frame 72; FTLD, frontotemporal lobar degeneration; MAPT, microtubule‐associated protein tau.
The presence of iron‐rich plaques in four FTLD‐C9orf72 cases were associated with an amyloid pathology score ≥2 (moderate or severe), while one FTLD‐C9orf72 case with mild amyloid pathology in the temporal cortex did not show any iron reactivity within plaques on the iron stain (Figure S6).
The presence of a superficial iron band was not associated with pathological severity nor with neuronal degeneration in both FTLD‐MAPT and FTLD‐C9orf72 (Figures S7 and S8), which may in part be due to the relatively low amount of cases with this abnormality. Yet, we observed that the superficial band was only associated with moderate or severe TDP‐43 pathology in FTLD‐C9orf72, and it was relatively more frequent in cases with moderate or severe tau pathology (compared to mild pathology) in FTLD‐MAPT (Figure S7).
As for clinical severity, the presence of the mid‐cortical band in the frontal cortex of FTLD‐MAPT was associated with higher clinical severity (25% of cases with FTLD‐CDR <3 as opposed to 100% of cases with FTLD‐CDR = 3; p = 0.047). In the temporal cortex, the mid‐cortical band was less frequent in cases with FTLD‐CDR <3 (50% as opposed to 100% in cases with FTLD‐CDR = 3), yet not enough to reach statistical significance (p = 0.209). The presence of the superficial band was not associated with clinical severity. We could not perform these comparisons in the FTLD‐C9orf72 group due to a ceiling effect in FTLD‐CDR scores (all FTLD‐CDR = 3). We found no association between disease duration (dichotomized) and the presence of either iron abnormality, in each group and overall (p > 0.1 for all).
3.3. Histology: Cortical iron is associated with glial cells
Furthermore, we investigated whether iron abnormalities colocalized with specific cellular markers (Figure 6).
FIGURE 6.
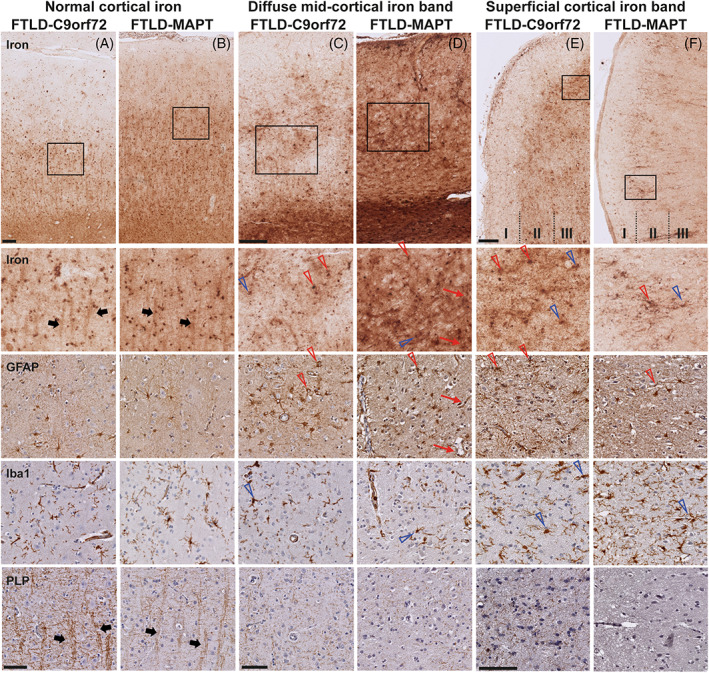
Colocalization of iron with microglia, astrocytes, and myelin in cortex with normal and abnormal cortical iron. (A) FTLD‐C9orf72 and (B) FTLD‐MAPT cases with a normal cortical iron distribution showed iron in cells morphologically resembling glia cells (both microglia and astrocytes). Microscopically, the iron staining also showed iron reactivity within myelinated‐fiber bundles traversing the cortex (thick black arrows). In FTLD‐C9orf72 (C) and FTLD‐MAPT (D) cases with a diffuse mid‐cortical band‐shaped iron staining, an area of high iron load showed, next to diffuse iron present in the neuropil, iron within both active and dystrophic microglia (open blue arrows) and reactive astrocytes (open red arrows). Iron was also found within the vessel wall of small capillaries, probably caused by iron within processes of astrocytes surrounding these capillaries (thin red arrows). Within these areas with high iron load, cortical myelin was clearly reduced. In FTLD‐C9orf72 (E) and FTLD‐MAPT (F) cases with a superficial cortical iron band, layer II of the cortex was characterized by high amounts of activated and dystrophic microglia (open blue arrows), reactive astrocytes (open red arrows) and a reduction in myelin. Scale bars overview (A,B; C,D; E,F) = 200 μm; scale bars in zoom (A,B; C,D; E,F) = 100 μm. C9orf72, chromosome 9 open reading frame 72; FTLD, frontotemporal lobar degeneration; MAPT, microtubule‐associated protein tau.
Examination of abnormal areas with a diffuse mid‐cortical iron band showed: diffuse iron present in the neuropil, iron within both active and dystrophic microglia and within reactive astrocytes (Figure 6C,D). Iron was also found within the vessel wall of small capillaries, associated with processes of astrocytes surrounding these capillaries. Areas with abnormally high iron load also showed reduced amounts of myelin. The layer II of cortices with a superficial iron band was characterized by high amounts of activated and dystrophic microglia and reactive astrocytes, associated with iron accumulation in glia cells and a reduction in myelin (Figure 6E,F).
In FTLD cases with no iron accumulation, iron was colocalized with homeostatic glial cells (Figure 6A,B), similar to controls, while activated or dystrophic microglia and reactive astrocytes were not present.
3.4. 7 T MRI: Changes in cortical iron are visible on ex vivo 7 T MRI
Finally, we compared histological changes in cortical iron with ex vivo ultrahigh field MRI images of adjacent tissue blocks in four FTLD‐MAPT and two FTLD‐C9orf72 cases (Figure 7).
FIGURE 7.

Ex vivo 7 T T2*‐weighted MRI and iron histology in FTLD. (A) A normal distribution of iron was observed in the frontal cortex of the FTLD‐MAPT case, which was also reflected on MRI. The cortex was characterized by a homogeneous cortex containing two well‐defined layers separated by a thin layer (line of Baillarger, arrow heads) with lower signal intensity compared to the other layers. (B) The temporal cortex of this FTLD‐MAPT case showed a diffuse mid‐cortical iron band on histology, and the same pattern was observed on MRI (arrows). (C) The temporal cortex of this FTLD‐C9orf72 showed a superficial cortical iron band in layer II of the cortex, which was visible on both MRI and histology (red arrows), next to a diffuse mid‐cortical band in adjacent parts of the gyrus. C9orf72, chromosome 9 open reading frame 72; FTLD, frontotemporal lobar degeneration; MAPT, microtubule‐associated protein tau.
On histology, two out of these four FTLD‐MAPT cases had no iron accumulation in neither frontal nor temporal cortex. This normal distribution was also visible on MRI, observable as a homogeneous cortex containing two well‐defined layers separated by a thin layer with lower signal intensity compared to the other layers (Figure 7A, arrow heads). Interestingly, one of these cases (45‐year‐old male) had early‐stage clinical disease and underwent euthanasia 2 years after diagnosis. This case had mild tau pathology (i.e., score 1) in both frontal and temporal cortex, and no neuronal degeneration, in the less affected hemisphere used for brain sampling. The second case (65‐year‐old male) was diagnosed only 1 year before death, showed behavioral changes but otherwise relatively preserved cognition, and died relatively early of aspiration pneumonia. From this case, the middle temporal gyrus was sampled instead of the temporal pole (tissue unavailable), which is less severely affected in FTLD‐MAPT. Both frontal and temporal cortex of this case showed mild tau pathology and mild neuronal degeneration (i.e., score 1 for both).
The other two FTLD‐MAPT cases showed a diffuse mid‐cortical iron band on histology in both the frontal and temporal cortex. Also on MRI, these two cases showed an altered MRI contrast, characterized by an inhomogeneous cortex and the presence of a diffuse hypointense band covering the mid‐cortical layers of the cortex obscuring the normal cortical lamination (Figure 7B, white arrows). The superficial cortical band, present on histology in both cases in the adjacent frontal cortex blocks, was visible in only one of the two cases on MRI. In the first case, with a visible superficial band on MRI, the band was not continuously present throughout the gyri, but when present it appeared as a well‐defined thin band in the upper layers of the cortex on both histology and MRI. In the second case, the band appeared patchy and less well‐defined on histology, while it could not be detected on MRI.
Also, in both FTLD‐C9orf72 cases, 7 T ex vivo MRI reflected the iron staining. The cortical regions with a diffuse mid‐cortical iron band on histology (case 1 temporal and case 2 frontal) showed an inhomogeneous cortex in adjacent blocks on MRI. As described above for the FTLD‐MAPT cases, the diffuse mid‐cortical band was observed on MRI as a diffuse hypointense band covering the mid‐cortical layers. These cases also showed a superficial cortical iron band on histology (case 1 both frontal and temporal and case 2 only temporal), which was also visible on the adjacent blocks used for MRI as a thin layer, intermittently present, covering the upper layers of the cortex (Figure 7C, red arrows). Similar to the histology, none of these FTLD‐C9orf72 cases had a normal iron distribution on MRI.
Overall, we thus observed a good correspondence between abnormal iron histology and hypointense abnormalities on ex vivo ultrahigh field MRI.
4. DISCUSSION
This study aimed to gain more insight into the occurrence of cortical iron accumulation in FTLD caused by MAPT mutations or C9orf72 repeat expansions, and into the potential of T2*‐weighted MRI to detect iron accumulation in these cases. Histopathology showed that cortical iron accumulation as a diffuse mid‐cortical iron band, and in some cases with an additional superficial cortical iron band, is present in both FTLD‐MAPT and, though less pronounced, in FTLD‐C9orf72 patients in the frontal and temporal cortex. Overall, cortical iron accumulation was associated with severity of pathology and of neuronal degeneration. In both FTLD‐MAPT and FTLD‐C9orf72 cases, iron accumulated in activated or dystrophic microglia and reactive astrocytes. Ultrahigh field ex vivo MRI of postmortem brain tissue showed that changes in cortical iron on histology are well captured on T2*‐weighted MRI as a diffuse hypointense band covering the mid‐cortical layers (i.e., diffuse mid‐cortical iron band) and/or a superficial cortical hypointense band (i.e., superficial cortical iron band).
Based on previous ex vivo and in vivo studies in AD and FTD [9, 20], we hypothesized that iron accumulation would be present in genetic FTD cases carrying MAPT mutations or C9orf72 repeat expansion, but would differ in these two proteinopathies. Our hypothesis was based on earlier observations of deeper GM layers iron distribution in sporadic FTLD‐Tau, as opposed to superficial cortical layer iron distribution in sporadic FTLD‐TDP. In our study, however, FTLD‐MAPT and FTLD‐C9orf72 showed similar cortical iron distribution. In both genetic groups, slightly more in FTLD‐MAPT than FTLD‐C9orf72, we found a diffuse mid‐cortical iron band and, in addition, a superficial cortical iron band covering layer II of the cortex in a subset of cases. Similar abnormalities have been described before, and associated with neurodegenerative disease conditions, as opposed to nondemented control tissue [9, 20, 33, 35]. The mid‐cortical iron band has been observed in AD [9, 33, 35], FTLD‐Tau 3R and 4R tauopathy cases [20], while the superficial band has been reported only in sporadic FTLD‐TDP previously [20]. The occurrence of these abnormalities in our study thus suggests that iron accumulation is implicated in both FTLD‐MAPT and, to a lesser extent, in FTLD‐C9orf72, with similar laminar involvement.
The laminar distribution pattern of iron reflected the diffuse distribution of tau or TDP‐43 pathology in FTLD‐MAPT and FTLD‐C9orf72. The diffuse mid‐cortical iron band, previously reported by Tisdall et al. in sporadic FTLD‐Tau [20], was observed in both FTLD‐C9orf72 and FTLD‐MAPT in our study. Similarly, the superficial cortical iron band in layer II of the cortex described in sporadic FTLD‐TDP [20] was found in both pathologies. The cooccurrence of these abnormalities may be related to the diffuse distribution of proteinopathy inclusions in both groups. FTLD‐Tau affects both upper and deeper layers [36], and FTLD‐TDP type B (uniquely included in our cohort) as well [37]. This may explain the discrepancy with the findings by Tisdall et al., based on FTLD‐TDP type A and C cases [20], which tend to selectively affect the upper cortical layers [25, 37]. Additionally, iron distribution in our FTLD‐C9orf72 cohort may in part be related to age‐related Alzheimer copathology, which was present to a mild or moderate extent in all cases (Table 1). Indeed, in a subset with FTLD‐C9orf72 the presence of moderate to severe amyloid copathology was associated with the occurrence of iron‐rich plaques, consistent with those observed in AD [9, 33]. These iron‐rich plaques were not clearly related to other FTLD‐related iron abnormalities, as they could coexist with either abnormal or otherwise healthy cortices. Thus, iron may be an aspecific marker following the distribution of pathological burden within affected cortices in genetic FTLD.
The diffuse mid‐cortical iron band was associated with moderate‐to‐severe pathological tau or TDP‐43 pathology and neuronal degeneration. These results are in line with prior studies in AD showing a correlation between iron and pathological severity [13, 33, 38]. Further, in vivo, increasing evidence suggests that iron may be a marker of disease progression [39, 40, 41, 42]. Interestingly, two cases with relatively early‐stage pathology in the FTLD‐MAPT group showed normal iron distribution, while all remaining FTLD‐MAPT cases showed iron abnormalities. The lower frequency of iron abnormalities in the FTLD‐C9orf72 group may also be due to relatively less pronounced pathologic disease in this group, especially in the temporal cortex, where 6/11 (54.5%) cases showed only mild neuronal degeneration. Thus, the reported occurrence of iron abnormalities in FTLD‐MAPT and FTLD‐C9orf72 may in part be influenced by regional variability in the severity of these pathologies. These findings also suggest that iron may play a role only later in FTLD disease pathophysiology, when at least moderate proteinopathy deposition and neuronal degeneration have occurred. Consistent with this hypothesis, we found an association between higher clinical severity (before death) and the occurrence of iron abnormalities, which were more often observed in severe cases (FTLD‐CDR = 3) in FTLD‐MAPT. Conversely, we could not find a clear association of iron abnormalities with clinical disease duration, which may be due to the heterogeneity in disease course and rate of progression in FTLD, where a short disease duration does not always correspond to mild disease postmortem and vice versa [32]. Indeed, these observations should be further verified in larger postmortem as well as in vivo cohorts.
The occurrence of iron accumulation colocalized with the presence of activated or dystrophic microglia and reactive astrocytes. Iron was also observed within the vessel wall of small capillaries, probably as iron present within astrocytic processes surrounding these capillaries, which could signal a dysfunction of iron transport regulation across the blood–brain barrier (BBB) [43]. These observations are in line with previous results in FTLD showing iron within activated or dystrophic microglia and reactive astrocytes, including those surrounding small capillaries [20]. However, while this prior study found predominantly iron‐associated astrocytes in FTLD‐TDP and iron‐associated microglia in FTLD‐Tau, we found iron‐associated reactive astrocytes and activated microglia in both pathologies. This could be explained in part by the different groups investigated (i.e., genetic subtypes), and in part by the fact that neuroinflammation is a dynamic process varying across regions, disease stages and individuals. In other neurodegenerative disorders including AD, Huntington's disease (HD) and multiple sclerosis, microglia and astrocytes are the predominant iron‐sequestering cells [44, 45, 46], as observed here. Whereas microglia are thought to be the first responders to iron accumulation within the brain parenchyma, astrocytes likely contribute to sequestering iron upon activation in a neuroinflammatory and neurodegenerative environment [47, 48, 49]. Additionally, capillary‐associated astrocytes appear responsible for iron uptake and storage if iron crosses the BBB [43]. Similar mechanisms could play a role in FTLD, as substantial evidence suggests that neuroinflammation and BBB dysfunction are important mechanisms underlying FTLD pathogenesis, implicating microglia, astrocytes, and other cells of the neurovascular units [7, 50, 51, 52, 53]. Additional studies are needed to determine whether FTLD‐Tau and FTLD‐TDP have specific iron‐associated neuroinflammatory or neurovascular signatures that may help improve antemortem diagnosis of sporadic FTLD pathologies.
In addition to iron within glia cells, we also observed that areas with iron accumulation were characterized by reduced amounts of myelin. The typical organization of myelin across cortical layers was lost, which was also observed in sporadic FTLD [20]. Myelin loss was also observed in subcortical white matter in sporadic FTLD, but in the white matter it did not always correspond to prominent iron accumulation [20]. Recent studies have found pronounced white matter degeneration and myelin loss in FTLD‐Tau (both genetic and sporadic) and in genetic forms of FTLD‐TDP, including FTLD‐C9orf72, more than in sporadic FTLD‐TDP [54, 55]. The degeneration of white‐matter myelinated fibers is thought to be in part due to Wallerian degeneration, in part to pathological aggregates in oligodendrocytes [54]. While here we focused on gray matter changes, our findings raise the question as to whether iron‐associated neuroinflammatory processes may also directly contribute to myelin degeneration. In contrast, a spatial correlation between cortical iron (as diffuse mid‐cortical band) and myelin accumulation has been shown in AD [9, 33], where myelin staining appears as a diffuse band as well, suggesting an increase rather than decrease [46, 56]. While the origin of increased myelin content in AD is still unknown, a similar process was not observed in FTLD.
Finally, we found a good correspondence between cortical iron as observed on histology and abnormalities on T2*‐weighted MRI. While, the occurrence of a diffuse mid‐cortical iron band was always detectable on MRI, the superficial iron band was not detectable on MRI in one case. This may be due to the amount of iron, which was less defined and patchy in this case, or due to regional differences, as we used adjacent tissue blocks for MRI and histology due to technical constraints. Cortical laminar patterns of iron accumulation and corresponding hypointense signal on T2*‐weighted MRI, similar to those observed in our study, have been recently reported in sporadic FTLD [20], confirming the sensitivity of T2*‐weighted MRI to potentially detect iron accumulation in patients with FTD in vivo.
In this study, we examined a well‐characterized autopsy cohort of genetic FTLD with MAPT mutations and C9orf72 repeat expansions. Through histological and ex vivo imaging analysis of brain tissue in this postmortem cohort, we provide novel findings for genetic FTLD that complement recent literature on iron pathology of sporadic FTLD.
Some limitations should be considered when interpreting the findings of this study. Iron histology can be affected by several factors, such as sample storage, fixation and preparation, and the occurrence of histological artifacts [57, 58]. To account for this, all tissue used for histology in this study underwent the same processing procedures, which have been validated and applied before [9, 28]. We used a modified Meguro protocol [28], based on a DAB‐enhanced Perl's staining. Contrary to prior claims, this method stains both Fe2+ and Fe3+, partly depending on oxidation by exposure to air and aqueous solutions [29]. We implemented strict protocols to control for the timing of sectioning and subsequent iron staining to standardize air exposure and oxidation, nevertheless our stainings should be considered to reflect both ferrous and ferric iron. We demonstrated earlier that the majority of the iron in AD cortex was present as ferrihydrite minerals, indicating that nonheme iron is largely stored in ferritin complexes, which was confirmed by the high degree of colocalization with ferritin immunostaining [16, 17]. It should be noted, however, that also substantial amounts of noncellular iron are often observed, thought to be labile iron. This study was not designed to unravel the iron speciation in FTLD. The interpretation of ex vivo MRI images may have been partly influenced by fixation time, as longer fixation times prior to MRI can contribute to iron retention in the formalin tissue [23]. We included two regions of interest for FTLD pathology (frontal and temporal cortex); however, we cannot exclude that other regions implicated in FTLD may also provide additional information on the anatomical patterns of iron accumulation. Further, there was some variability in the sampling of the temporal cortex due to tissue availability (17 temporal pole and 5 middle temporal gyrus), which may in part influence our results. Iron abnormalities and pathological scores were obtained by ordinal rater‐based assessment, with rigorous interrater and consensus procedures. However, more objective digital methods to assess iron load and pathological burden could be useful in follow‐up studies to obtain quantitative information on iron and other markers. Finally, we included a relatively uniform cohort of genetic FTLD with two specific genetic defects; therefore, our results cannot be generalized, and should be further verified, in other genetic (e.g., GRN‐associated FTLD) and sporadic subtypes in this heterogeneous disease spectrum.
In conclusion, this study shows that iron accumulation occurs in both FTLD‐MAPT and FTLD‐C9orf72 in the frontal and temporal cortex, and may be slightly more pronounced in FTLD‐MAPT. In both pathologies, iron accumulation reflects the presence of activated and dystrophic microglia, reactive astrocytes, and myelin loss. Our results suggest that iron accumulation is similar between FTLD‐MAPT and FTLD‐C9orf72, and is associated with pathological severity and in part with clinical severity. Therefore, in vivo iron imaging using T2*‐weighted MRI may be used as a noninvasive imaging marker to localize pathology in FTLD. This requires advanced imaging techniques, such as high resolution acquisition at 7 T [59], allowing the detection of layer‐specific MRI contrast changes within the cortex in vivo. In addition, most available data on iron pathology comes from end‐stage FTD patients, with the exception of two unique early FTLD‐MAPT cases in our cohort. This raises questions on the timing of iron accumulation in the disease process and on the role of iron at different disease stages. In AD and HD for example, iron is shown to be already increased in early disease stages and in HD already in the pre‐symptomatic phase [60, 61, 62]. In vivo iron imaging of a larger cohort of presymptomatic carriers and FTD patients at different stages of disease will be important to elucidate the role of iron at disease onset and during disease progression.
AUTHOR CONTRIBUTIONS
LAAG, MB, JCvS, LvdW, HS designed the study. LAAG, MB, JCvS, LvdW, HS drafted or revised the manuscript. LAAG, MB performed the main analyses of the study. BK, AR, SM, IH, LB, ES, EGPD, JCvS, LvdW, HS contributed substantially to data collection and/or analysis. All authors read and approved the final manuscript.
ETHICS STATEMENT
Study procedures were performed in accordance with Dutch ethical guidelines (Code for Proper Secondary Use of Human Tissue, Dutch Federation of Medical Scientific Societies). Approval by an ethical committee was not required for the performance of this study, which used de‐anonymized brain bank tissue samples.
INFORMED CONSENT
Informed consent for brain donation and scientific use was obtained prior to death.
Supporting information
Data S1: Supporting Information
ACKNOWLEDGMENTS
We thank all patients and their families for making this research possible. We thank Shamiram Melhem and Renee van Buuren for technical assistance in histological experiments. This work was supported by a personal grant (M. Bulk) from Alzheimer Nederland (Call for Biomedical Research WE.03‐2020‐10) and a personal grant (H. Seelaar) from ZonMW‐Alzheimer Nederland (Memorabel Research Fellowship 2019: project 733050513).
Giannini LAA, Bulk M, Kenkhuis B, Rajicic A, Melhem S, Hegeman‐Kleinn I, et al. Cortical iron accumulation in MAPT ‐ and C9orf 72‐associated frontotemporal lobar degeneration. Brain Pathology. 2023;33(4):e13158. 10.1111/bpa.13158
Lucia A.A. Giannini and Marjolein Bulk shared first authorship.
Louise van der Weerd and Harro Seelaar shared last authorship.
Contributor Information
Louise van der Weerd, Email: l.van_der_weerd@lumc.nl.
Harro Seelaar, Email: h.seelaar@erasmusmc.nl.
DATA AVAILABILITY STATEMENT
Data used in this study will be made available by the corresponding author upon reasonable request.
REFERENCES
- 1. Onyike CU, Diehl‐Schmid J. The epidemiology of frontotemporal dementia. Int Rev Psychiatry. 2013;25:130–7. [DOI] [PMC free article] [PubMed] [Google Scholar]
- 2. Seelaar H, Rohrer JD, Pijnenburg YA, Fox NC, van Swieten JC. Clinical, genetic and pathological heterogeneity of frontotemporal dementia: a review. J Neurol Neurosurg Psychiatry. 2011;82:476–86. [DOI] [PubMed] [Google Scholar]
- 3. Greaves CV, Rohrer JD. An update on genetic frontotemporal dementia. J Neurol. 2019;266:2075–86. [DOI] [PMC free article] [PubMed] [Google Scholar]
- 4. Rohrer JD, Guerreiro R, Vandrovcova J, Uphill J, Reiman D, Beck J, et al. The heritability and genetics of frontotemporal lobar degeneration. Neurology. 2009;73:1451–6. [DOI] [PMC free article] [PubMed] [Google Scholar]
- 5. Mackenzie IR, Neumann M, Bigio EH, Cairns NJ, Alafuzoff I, Kril J, et al. Nomenclature and nosology for neuropathologic subtypes of frontotemporal lobar degeneration: an update. Acta Neuropathol. 2010;119:1–4. [DOI] [PMC free article] [PubMed] [Google Scholar]
- 6. Mackenzie RW, Watt P. A molecular and whole body insight of the mechanisms surrounding glucose disposal and insulin resistance with hypoxic treatment in skeletal muscle. J Diabetes Res. 2016;2016:6934937. [DOI] [PMC free article] [PubMed] [Google Scholar]
- 7. Bright F, Werry EL, Dobson‐Stone C, Piguet O, Ittner LM, Halliday GM, et al. Neuroinflammation in frontotemporal dementia. Nat Rev Neurol. 2019;15:540–55. [DOI] [PubMed] [Google Scholar]
- 8. Acosta‐Cabronero J, Williams GB, Cardenas‐Blanco A, Arnold RJ, Lupson V, Nestor PJ. In vivo quantitative susceptibility mapping (QSM) in Alzheimer's disease. PLoS One. 2013;8:e81093. [DOI] [PMC free article] [PubMed] [Google Scholar]
- 9. Bulk M, Abdelmoula WM, Nabuurs RJA, van der Graaf LM, Mulders CWH, Mulder AA, et al. Postmortem MRI and histology demonstrate differential iron accumulation and cortical myelin organization in early‐ and late‐onset Alzheimer's disease. Neurobiol Aging. 2018;62:231–42. [DOI] [PubMed] [Google Scholar]
- 10. van Bergen JM, Li X, Hua J, Schreiner SJ, Steininger SC, Quevenco FC, et al. Colocalization of cerebral iron with amyloid beta in mild cognitive impairment. Sci Rep. 2016;6:35514. [DOI] [PMC free article] [PubMed] [Google Scholar]
- 11. van Rooden S, Versluis MJ, Liem MK, Milles J, Maier AB, Oleksik AM, et al. Cortical phase changes in Alzheimer's disease at 7T MRI: a novel imaging marker. Alzheimers Dement. 2014;10:e19–26. [DOI] [PubMed] [Google Scholar]
- 12. Bulk M, Abdelmoula WM, Geut H, Wiarda W, Ronen I, Dijkstra J, et al. Quantitative MRI and laser ablation‐inductively coupled plasma‐mass spectrometry imaging of iron in the frontal cortex of healthy controls and Alzheimer's disease patients. Neuroimage. 2020;215:116808. [DOI] [PubMed] [Google Scholar]
- 13. Bulk M, Kenkhuis B, van der Graaf LM, Goeman JJ, Natte R, van der Weerd L. Postmortem T2*‐ weighted MRI Imaging of cortical iron reflects severity of Alzheimer's disease. J Alzheimers Dis. 2018;65:1125–37. [DOI] [PMC free article] [PubMed] [Google Scholar]
- 14. Spotorno N, Acosta‐Cabronero J, Stomrud E, Lampinen B, Strandberg OT, van Westen D, et al. Relationship between cortical iron and tau aggregation in Alzheimer's disease. Brain. 2020;143:1341–9. [DOI] [PMC free article] [PubMed] [Google Scholar]
- 15. Ward RJ, Dexter DT, Crichton RR. Iron, neuroinflammation and neurodegeneration. Int J Mol Sci. 2022;23:7267. [DOI] [PMC free article] [PubMed] [Google Scholar]
- 16. van der Weerd L, Lefering A, Webb A, Egli R, Bossoni L. Effects of Alzheimer's disease and formalin fixation on the different mineralised‐iron forms in the human brain. Sci Rep. 2020;10:16440. [DOI] [PMC free article] [PubMed] [Google Scholar]
- 17. Kenkhuis B, Somarakis A, de Haan L, Dzyubachyk O, Me IJ, de Miranda N, et al. Iron loading is a prominent feature of activated microglia in Alzheimer's disease patients. Acta Neuropathol Commun. 2021;9:27. [DOI] [PMC free article] [PubMed] [Google Scholar]
- 18. Mazzucchi S, Frosini D, Costagli M, Del Prete E, Donatelli G, Cecchi P, et al. Quantitative susceptibility mapping in atypical Parkinsonisms. Neuroimage Clin. 2019;24:101999. [DOI] [PMC free article] [PubMed] [Google Scholar]
- 19. Sheelakumari R, Kesavadas C, Varghese T, Sreedharan RM, Thomas B, Verghese J, et al. Assessment of iron deposition in the brain in frontotemporal dementia and its correlation with behavioral traits. AJNR Am J Neuroradiol. 2017;38:1953–8. [DOI] [PMC free article] [PubMed] [Google Scholar]
- 20. Tisdall MD, Ohm DT, Lobrovich R, Das SR, Mizsei G, Prabhakaran K, et al. Ex vivo MRI and histopathology detect novel iron‐rich cortical inflammation in frontotemporal lobar degeneration with tau versus TDP‐43 pathology. Neuroimage Clin. 2022;33:102913. [DOI] [PMC free article] [PubMed] [Google Scholar]
- 21. Miyagawa T, Brushaber D, Syrjanen J, Kremers W, Fields J, Forsberg LK, et al. Utility of the global CDR((R)) plus NACC FTLD rating and development of scoring rules: data from the ARTFL/LEFFTDS consortium. Alzheimers Dement. 2020;16:106–17. [DOI] [PMC free article] [PubMed] [Google Scholar]
- 22. Shepherd TM, Thelwall PE, Stanisz GJ, Blackband SJ. Aldehyde fixative solutions alter the water relaxation and diffusion properties of nervous tissue. Magn Reson Med. 2009;62:26–34. [DOI] [PMC free article] [PubMed] [Google Scholar]
- 23. van Duijn S, Nabuurs RJ, van Rooden S, Maat‐Schieman ML, van Duinen SG, van Buchem MA, et al. MRI artifacts in human brain tissue after prolonged formalin storage. Magn Reson Med. 2011;65:1750–8. [DOI] [PubMed] [Google Scholar]
- 24. Bulk M, Hegeman‐Kleinn I, Kenkhuis B, Suidgeest E, van Roon‐Mom W, Lewerenz J, et al. Pathological characterization of T2*‐weighted MRI contrast in the striatum of Huntington's disease patients. Neuroimage Clin. 2020;28:102498. [DOI] [PMC free article] [PubMed] [Google Scholar]
- 25. Mackenzie IR, Neumann M, Baborie A, Sampathu DM, Du Plessis D, Jaros E, et al. A harmonized classification system for FTLD‐TDP pathology. Acta Neuropathol. 2011;122:111–3. [DOI] [PMC free article] [PubMed] [Google Scholar]
- 26. Montine TJ, Phelps CH, Beach TG, Bigio EH, Cairns NJ, Dickson DW, et al. National Institute on Aging‐Alzheimer's Association guidelines for the neuropathologic assessment of Alzheimer's disease: a practical approach. Acta Neuropathol. 2012;123:1–11. [DOI] [PMC free article] [PubMed] [Google Scholar]
- 27. Kovacs GG, Ghetti B, Goedert M. Classification of diseases with accumulation of tau protein. Neuropathol Appl Neurobiol. 2022;48:e12792. [DOI] [PMC free article] [PubMed] [Google Scholar]
- 28. van Duijn S, Nabuurs RJ, van Duinen SG, Natte R. Comparison of histological techniques to visualize iron in paraffin‐embedded brain tissue of patients with Alzheimer's disease. J Histochem Cytochem. 2013;61:785–92. [DOI] [PMC free article] [PubMed] [Google Scholar]
- 29. Meguro R, Asano Y, Odagiri S, Li C, Iwatsuki H, Shoumura K. Nonheme‐iron histochemistry for light and electron microscopy: a historical, theoretical and technical review. Arch Histol Cytol. 2007;70:1–19. [DOI] [PubMed] [Google Scholar]
- 30. Brettschneider J, Del Tredici K, Irwin DJ, Grossman M, Robinson JL, Toledo JB, et al. Sequential distribution of pTDP‐43 pathology in behavioral variant frontotemporal dementia (bvFTD). Acta Neuropathol. 2014;127:423–39. [DOI] [PMC free article] [PubMed] [Google Scholar]
- 31. Irwin DJ, Brettschneider J, McMillan CT, Cooper F, Olm C, Arnold SE, et al. Deep clinical and neuropathological phenotyping of pick disease. Ann Neurol. 2016;79:272–87. [DOI] [PMC free article] [PubMed] [Google Scholar]
- 32. Giannini LAA, Ohm DT, Rozemuller AJM, Dratch L, Suh E, van Deerlin VM, et al. Isoform‐specific patterns of tau burden and neuronal degeneration in MAPT‐associated frontotemporal lobar degeneration. Acta Neuropathol. 2022;144:1065–84. [DOI] [PMC free article] [PubMed] [Google Scholar]
- 33. van Duijn S, Bulk M, van Duinen SG, Nabuurs RJA, van Buchem MA, van der Weerd L, et al. Cortical iron reflects severity of Alzheimer's disease. J Alzheimers Dis. 2017;60:1533–45. [DOI] [PMC free article] [PubMed] [Google Scholar]
- 34. Braak H, Braak E, Kalus P. Alzheimer's disease: areal and laminar pathology in the occipital isocortex. Acta Neuropathol. 1989;77:494–506. [DOI] [PubMed] [Google Scholar]
- 35. Kenkhuis B, Jonkman LE, Bulk M, Buijs M, Boon BDC, Bouwman FH, et al. 7T MRI allows detection of disturbed cortical lamination of the medial temporal lobe in patients with Alzheimer's disease. Neuroimage Clin. 2019;21:101665. [DOI] [PMC free article] [PubMed] [Google Scholar]
- 36. Ohm DT, Cousins KAQ, Xie SX, Peterson C, McMillan CT, Massimo L, et al. Signature laminar distributions of pathology in frontotemporal lobar degeneration. Acta Neuropathol. 2022;143:363–82. [DOI] [PMC free article] [PubMed] [Google Scholar]
- 37. Tan RH, Shepherd CE, Kril JJ, McCann H, McGeachie A, McGinley C, et al. Classification of FTLD‐TDP cases into pathological subtypes using antibodies against phosphorylated and non‐phosphorylated TDP43. Acta Neuropathol Commun. 2013;1:33. [DOI] [PMC free article] [PubMed] [Google Scholar]
- 38. Ayton S, Wang Y, Diouf I, Schneider JA, Brockman J, Morris MC, et al. Brain iron is associated with accelerated cognitive decline in people with Alzheimer pathology. Mol Psychiatry. 2020;25:2932–41. [DOI] [PMC free article] [PubMed] [Google Scholar]
- 39. Ayton S, Faux NG, Bush AI. Alzheimer's disease neuroimaging I. ferritin levels in the cerebrospinal fluid predict Alzheimer's disease outcomes and are regulated by APOE. Nat Commun. 2015;6:6760. [DOI] [PMC free article] [PubMed] [Google Scholar]
- 40. Ayton S, Fazlollahi A, Bourgeat P, Raniga P, Ng A, Lim YY, et al. Cerebral quantitative susceptibility mapping predicts amyloid‐beta‐related cognitive decline. Brain. 2017;140:2112–9. [DOI] [PubMed] [Google Scholar]
- 41. Raven EP, Lu PH, Tishler TA, Heydari P, Bartzokis G. Increased iron levels and decreased tissue integrity in hippocampus of Alzheimer's disease detected in vivo with magnetic resonance imaging. J Alzheimers Dis. 2013;37:127–36. [DOI] [PubMed] [Google Scholar]
- 42. Zhu WZ, Zhong WD, Wang W, Zhan CJ, Wang CY, Qi JP, et al. Quantitative MR phase‐corrected imaging to investigate increased brain iron deposition of patients with Alzheimer disease. Radiology. 2009;253:497–504. [DOI] [PubMed] [Google Scholar]
- 43. Dringen R, Bishop GM, Koeppe M, Dang TN, Robinson SR. The pivotal role of astrocytes in the metabolism of iron in the brain. Neurochem Res. 2007;32:1884–90. [DOI] [PubMed] [Google Scholar]
- 44. Jellinger K, Paulus W, Grundke‐Iqbal I, Riederer P, Youdim MB. Brain iron and ferritin in Parkinson's and Alzheimer's diseases. J Neural Transm Park Dis Dement Sect. 1990;2:327–40. [DOI] [PubMed] [Google Scholar]
- 45. Simmons DA, Casale M, Alcon B, Pham N, Narayan N, Lynch G. Ferritin accumulation in dystrophic microglia is an early event in the development of Huntington's disease. Glia. 2007;55:1074–84. [DOI] [PubMed] [Google Scholar]
- 46. Streit WJ, Xue QS, Tischer J, Bechmann I. Microglial pathology. Acta Neuropathol Commun. 2014;2:142. [DOI] [PMC free article] [PubMed] [Google Scholar]
- 47. Moos T, Rosengren Nielsen T, Skjorringe T, Morgan EH. Iron trafficking inside the brain. J Neurochem. 2007;103:1730–40. [DOI] [PubMed] [Google Scholar]
- 48. Pelizzoni I, Zacchetti D, Campanella A, Grohovaz F, Codazzi F. Iron uptake in quiescent and inflammation‐activated astrocytes: a potentially neuroprotective control of iron burden. Biochim Biophys Acta. 2013;1832:1326–33. [DOI] [PMC free article] [PubMed] [Google Scholar]
- 49. Rathore KI, Redensek A, David S. Iron homeostasis in astrocytes and microglia is differentially regulated by TNF‐alpha and TGF‐beta1. Glia. 2012;60:738–50. [DOI] [PubMed] [Google Scholar]
- 50. Bevan‐Jones WR, Cope TE, Jones PS, Kaalund SS, Passamonti L, Allinson K, et al. Neuroinflammation and protein aggregation co‐localize across the frontotemporal dementia spectrum. Brain. 2020;143:1010–26. [DOI] [PMC free article] [PubMed] [Google Scholar]
- 51. Malpetti M, Rittman T, Jones PS, Cope TE, Passamonti L, Bevan‐Jones WR, et al. In vivo PET imaging of neuroinflammation in familial frontotemporal dementia. J Neurol Neurosurg Psychiatry. 2021;92:319–22. [DOI] [PMC free article] [PubMed] [Google Scholar]
- 52. Sakae N, Roemer SF, Bieniek KF, Murray ME, Baker MC, Kasanuki K, et al. Microglia in frontotemporal lobar degeneration with progranulin or C9ORF72 mutations. Ann Clin Transl Neurol. 2019;6:1782–96. [DOI] [PMC free article] [PubMed] [Google Scholar]
- 53. Gerrits E, Giannini LAA, Brouwer N, Melhem S, Seilhean D, Le Ber I, et al. Neurovascular dysfunction in GRN‐associated frontotemporal dementia identified by single‐nucleus RNA sequencing of human cerebral cortex. Nat Neurosci. 2022;25:1034–48. [DOI] [PubMed] [Google Scholar]
- 54. Giannini LAA, Peterson C, Ohm D, Xie SX, McMillan CT, Raskovsky K, et al. Frontotemporal lobar degeneration proteinopathies have disparate microscopic patterns of white and grey matter pathology. Acta Neuropathol Commun. 2021;9:30. [DOI] [PMC free article] [PubMed] [Google Scholar]
- 55. Sirisi S, Querol‐Vilaseca M, Dols‐Icardo O, Pegueroles J, Montal V, Munoz L, et al. Myelin loss in C9orf72 hexanucleotide expansion carriers. J Neurosci Res. 2022;100:1862–75. [DOI] [PubMed] [Google Scholar]
- 56. Dopper EG, Rombouts SA, Jiskoot LC, den Heijer T, de Graaf JR, de Koning I, et al. Structural and functional brain connectivity in presymptomatic familial frontotemporal dementia. Neurology. 2014;83:e19–26. [DOI] [PubMed] [Google Scholar]
- 57. Hare DJ, Gerlach M, Riederer P. Considerations for measuring iron in post‐mortem tissue of Parkinson's disease patients. J Neural Transm (Vienna). 2012;119:1515–21. [DOI] [PubMed] [Google Scholar]
- 58. De Barros A, Arribarat G, Combis J, Chaynes P, Peran P. Matching ex vivo MRI with iron histology: pearls and pitfalls. Front Neuroanat. 2019;13:68. [DOI] [PMC free article] [PubMed] [Google Scholar]
- 59. Balasubramanian M, Mulkern RV, Neil JJ, Maier SE, Polimeni JR. Probing in vivo cortical myeloarchitecture in humans via line‐scan diffusion acquisitions at 7 T with 250‐500 micron radial resolution. Magn Reson Med. 2021;85:390–403. [DOI] [PMC free article] [PubMed] [Google Scholar]
- 60. Dominguez DJF, Ng ACL, Poudel G, Stout JC, Churchyard A, Chua P, et al. Iron accumulation in the basal ganglia in Huntington's disease: cross‐sectional data from the IMAGE‐HD study. J Neurol Neurosurg Psychiatry. 2016;87:545–9. [DOI] [PubMed] [Google Scholar]
- 61. Dumas EM, Versluis MJ, van den Bogaard SJ, van Osch MJ, Hart EP, van Roon‐Mom WM, et al. Elevated brain iron is independent from atrophy in Huntington's disease. Neuroimage. 2012;61:558–64. [DOI] [PubMed] [Google Scholar]
- 62. van Rooden S, Buijs M, van Vliet ME, Versluis MJ, Webb AG, Oleksik AM, et al. Cortical phase changes measured using 7‐T MRI in subjects with subjective cognitive impairment, and their association with cognitive function. NMR Biomed. 2016;29:1289–94. [DOI] [PubMed] [Google Scholar]
Associated Data
This section collects any data citations, data availability statements, or supplementary materials included in this article.
Supplementary Materials
Data S1: Supporting Information
Data Availability Statement
Data used in this study will be made available by the corresponding author upon reasonable request.