

Abstract
Mitochondrial encephalomyopathies (ME) are frequently associated with mutations of mitochondrial DNA, but the pathogenesis of a subset of ME (sME) remains elusive. Here we report that haploinsufficiency of a mitochondrial inner membrane protein, Mic60, causes progressive neurological abnormalities with insulted mitochondrial structure and neuronal loss in mice. In addition, haploinsufficiency of Mic60 reduces mitochondrial membrane potential and cellular ATP production, increases reactive oxygen species, and alters mitochondrial oxidative phosphorylation complexes in neurons in an age‐dependent manner. Moreover, haploinsufficiency of Mic60 compromises brain glucose intake and oxygen consumption in mice, resembling human ME syndrome. We further discover that MIC60 protein expression declined significantly in human sME, implying that insufficient MIC60 may contribute for pathogenesis of human ME. Notably, systemic administration of antioxidant N‐acetylcysteine largely reverses mitochondrial dysfunctions and metabolic disorders in haplo‐insufficient Mic60 mice, also restores neurological abnormal symptom. These results reveal Mic60 is required in the maintenance of mitochondrial integrity and function, and likely a potential therapeutics target for mitochondrial encephalomyopathies.
Keywords: antioxidant, Mic60, mitochondria, mitochondrial encephalomyopathies, neurodegeneration, reactive oxygen species
Haploinsufficiency of a mitochondrial inner membrane protein, Mic60, causes murine progressive neurological abnormalities with mitochondrial dysfunction and metabolic disorder. Antioxidant N‐acetylcysteine reverses mitochondrial dysfunctions and metabolic disorders in haploinsufficient Mic60 mice robustly. Mic60 protein expression decreases significantly in a subset of mitochondrial encephalomyopathies patients, implying a defective Mic60 may contribute for pathogenesis of human mitochondrial encephalomyopathies.

1. INTRODUCTION
Mitochondria are cytoplasmic organelles with outer and inner membranes of all aerobic nucleated cells. The inner mitochondrial membrane is highly folded into the cristae and harbors the respiratory chain complexes of the electron transport chain and ATP synthase [1]. Maintenance of mitochondrial structure and function is particularly important to neurons because its high energy demand only relies on glucose oxidation [2]. Thus, mitochondrial dysfunction can severely compromise neuronal functions and is in turn one of the main causative factors leading to neurodegenerative disorders [3, 4]. Mitochondrial DNA (mtDNA) mutations, by impairing respiratory chain/oxidative phosphorylation (OXPHOS), could affect the organs with a high demand of oxidative metabolism (such as the brain and muscle) and further lead to mitochondrial encephalomyopathies (ME) [5, 6, 7]. Because of an impaired energy state, ME may be accompanied with lactic acidosis and stroke‐like episodes (MELAS) or myoclonus epilepsy and ragged red fibers (MERRF). However, a subset of ME (sME) was found of no mtDNA mutation, which indicates the presence of other reasons causing mitochondrial dysfunction, such as mutations of energy related nuclear genes [8].
Mic60 (also called Mitofilin or Immt), originally named as heart muscle protein (HMP) [9], is a nuclear gene encoding mitochondrial inner membrane protein ubiquitously expressed in fetal and adult tissues, with the highest expression in muscle and the brain [10]. Mic60 expression was significantly decreased in the brains of fetal Down syndrome as well as Parkinson’ disease (PD). [11, 12] As a central component of the mitochondrial contact site and cristae organizing system (MICOS), a large protein complex which comprises MIC60, MIC27/APOOL, MIC26, MIC25/CHCHD6, MIC19/CHCHD3, MIC10, MIC14/CHCHD10, MIC23/APOO and MIC13/QIL1 [13, 14, 15], MIC60 is essential for mitochondrial membrane architecture as well as in mitochondrial dynamics [15, 16]. Moreover, Mic60 has physical interaction with the outer membrane proteins including SAMM50 and Metaxin, as well as inner membrane/intermembrane space proteins OPA1 and Hsp70, which are involved in mitochondrial cristae morphology and function [17, 18, 19, 20, 21, 22]. In addition, Mic60 was found to interact with a mitochondrial protein DISC1 involved in schizophrenia [23], DNA damage response protein PARP‐1 [24], PNKP functioning in mitochondrial DNA (mtDNA) stability [25], and PINK1, a mitochondrial serine/threonine kinase involved in PD [26]. Furthermore, phosphorylation of Mic60 by PKA and PINK1 is essential in maintaining mitochondrial membrane structures and might be involved in the pathogenesis of Parkinson's disease [27, 28]. Interestingly, all these mitochondrial proteins are involved in a subset of neurodegenerative diseases [16].
In this study, we investigated the potential role of Mic60 in neuronal function by using Mic60 haplo‐insufficient mouse model. We found that haploinsufficiency of Mic60 caused neurological abnormalities with neuronal loss in an age‐dependent manner. In addition, haploinsufficiency of Mic60 altered mitochondrial function, promoted brain glucose intake and oxygen consumption in mice, which resembles human ME. Intriguingly, antioxidant N‐acetylcysteine largely reversed mitochondrial dysfunctions and metabolic disorders, as well as neurological disable in heterozygotic Mic60 mice. Besides haploinsufficiency of Mic60 induced ME in murine, distinct MIC60 protein expression lessening was observed in human ME. These results revealed an essential role of Mic60 in maintaining mitochondrial function and prevention of neurodegeneration, especially ME.
2. MATERIALS AND METHODS
2.1. Clinical information
Based on clinical presentation, magnetic resonance neuroimaging abnormalities, evidence of muscle histopathological, and mitochondrial ultrastructural changes, a subset of eight ME patients (male 6, female 2 from 16 to 79‐year‐old, median age 39.5 years, out of 57 ME patients screened for mtDNA, without the presence of mtDNA mutations) and four ME patients with mtDNA mutations were enrolled (Table S4) in the Neuromuscular and Genetic Centre, Department of Neurology, Beijing Tiantan Hospital. The subject's consent was obtained according to the Declaration of Helsinki, and Institutional ethical committee approval was obtained.
2.2. Generation of Mic60‐deficient mice
A gene trap with an insertion in the third intron of the Mic60 gene was donated from the Sanger Institute. The ES clone (AW 0256) was injected to generate Mic60 +/− mice. All mice were maintained in a temperature‐controlled barrier facility with a 12‐h light/dark cycle and were given free access to food and water in the Center for Experimental Animal Research, IBMS, PUMC/CAMS, Beijing. All animal experiments were performed according to the guideline of Institutional Animal Care and Use Committee (IACUC) of IBMS/PUMC. Mic60 genotyping PCR primers are listed as follows:
Primer 1 forward 5′‐TTGCTTTGCTGACTGTTCCACT‐3′.
Primer 2 reverse 5′‐CTGACCTGAAGATCGTCTCCGT‐3′.
Primer 3 forward 5′‐AAGCGGTGAAGTGCCTCTGG‐3′.
Primer 4 reverse 5′‐CGTTAGGGTCAATGCGGGTC‐3′.
2.3. Small animal imaging
For small animal magnetic resonance imaging (micro‐MRI), mouse brain MRI was performed on a 7T MRI animal scanner (Varian). For small animal positron emission tomography (microPET) analysis, all mice were examined under overnight fasting status. A total of 7.4 MBq (0.2 mCi) 18F‐FDG (PUMCH, CAMS, Beijing) was injected into peritoneal cavity of each mouse. Anesthesia was performed 45 min later with 1.5% isoflurane in combination with O2 in 2 L/min using a Summit AS‐1‐000‐7 animal anesthesia system. An Inveon microPET system (Siemens) was used and the acquisition procedure lasted for 5 min for each mouse.
2.4. ROS analysis
The endogenous ROS was measured on unfixed frozen sections from mice through the conversion of dihydroethidium (DHE) to ethidium [29]. ROS generation was visualized using fluorescence microscopy (Zeiss), and analyzed using TissueQuest 5.0 system (Tissue Gnostics GmbH, Austria).
The ROS level in isolated mitochondrial was determined by measuring the fluorescence intensity upon its reaction with 2′,7′‐dichlorodihydro‐fluorescein diacetate (DCF, Molecular Probes, Eugene, OR) [30], and measured with a Cary eclipe fluorescence spectrophotometer (Varian).
2.5. LC–MS/MS and data analysis
Proteins were prepared from mice cerebella at different ages and lysed in 7 M urea, 2 M thiourea, 50 mM tris, 50 mM DTE, 1 mM PMSF, 1 mM RNAse and 1 mM DNAse, followed by digestion with trypsin (1:50) overnight. The samples were analyzed in duplicate by a self‐packed RPC18 capillary LC column (75 μm × 100 mm, 1.9 μm, Michrom Bioresources). The raw data was acquired by LTQ Orbitrap Velos, and followed by imported into Progenesis LC–MS (v2.6, Nonlinear Dynamics, UK). To integrate MS features with protein identities, MS/MS spectra were exported and searched against the SwissProt mouse database using Mascot (v2.4, Matrix Science). Among all the proteins (about 3000 proteins) with CV <90% detected in all the samples, we discarded those proteins that were not detected in more than half samples, and the left 716 proteins were considered as expressed proteins for downstream analysis. Principle component analysis (PCA) were performed using R stats package. Besides, heatmap analysis was processed to reflect the fold change of 716 proteins between the Mic60 +/− and Mic60 +/− cerebella of the four stages. The proteins with log2 (fold change of the expression values) >1 or <−1 and p‐value <.05 between the Mic60 +/− and Mic60 +/− cerebella were defined as differentially expressed protein at each time point. KEGG pathway enrichment analyses were done with those proteins by KOBAS 3.0 online tool [31, 32].
2.6. Metabolic analysis
Mitochondrial O2 consumption in cerebellar neuron under basal conditions was measured with high‐resolution respirometer (Oroboros Oxygraph‐2k, Oxygraph, Innsbruck, Austria) as described [33]. Whole body real‐time metabolic analysis was conducted in a comprehensive laboratory animal monitoring system (CLAMS, Columbus Instruments). Oxygen consumption (VO2) and carbon dioxide production (VCO2) were evaluated continuously over a 72‐h period39 and presented in units of mL/kg/h and normalized to 25°C and 760 mm Hg. Respiratory quotient (RER) was calculated as the ratio of VCO2/VO2.
3. RESULTS
3.1. Haploinsufficiency of Mic60 accelerates age‐dependent behavioral alterations
To evaluate whether Mic60‐deficiency affects behavioral and pathological changes, we generated a knockout mouse model of Mic60 by gene trap strategy (Figure S1a–d). After germline transmission, Mic60 heterozygote (Mic60 +/−) mice were born normally with Mendelian ratio and showed no significant phenotype at birth compared to wild‐type mice. Unexpectedly, no Mic60 homozygote (Mic60 −/− ) mice were born. Genotyping analysis of staged embryos revealed that no viable Mic60 −/− embryos were found from embryonic day 10.5 (E10.5) on. Moreover, Mic60 −/− embryos were much smaller than those of wild‐type littermates at E7.5 (Figure S1e), and showed massive apoptosis at E9.5 (Figure S1f), which was also observed in Mic60‐knockdown cells [22]. These results demonstrated an essential role of Mic60 for early embryonic development.
Haploinsufficiency of Mic60 in Mic60 +/− mice was confirmed by determining its expression at both protein and mRNA levels (Figure 1A,B). Although Mic60 +/− mice did not show distinct phenotype at early age, these mice exhibited progressive motor dysfunction as early as 6‐month (6m). Mic60 +/− mice displayed gait changes in the left and right stride length by measuring the hind base between right and left paw prints and the matching (Figure S1g). Shorter stride length but increased hind base and matching were observed in Mic60 +/− mice of 6m and 12m old (Figure 1C,D). Mic60 +/− mice showed time crossing balance beams and missteps increased at different ages by balance beam test, revealing poor motor balance and coordination (Figure 1E,F). We next performed Morris maze test to further evaluate the coordination and spatial memory ability (Figure S1h). In sharp contrast to wild‐type mice, Mic60 +/− mice showed impaired ability to locate the platform after training, with rotated trace (Figure 1G–I). However, the grip strength (Figure 1J) and velocity (Figure 1K) were equivalent to those of wild‐type mice, indicating that abnormal behaviors in Mic60 +/− mice are likely caused by impaired motor function and coordination, rather than reduced muscle tension or motion speed. These early onset neurological abnormalities in Mic60 +/− mice suggested haploinsufficiency Mic60 accelerated neurodegeneration.
FIGURE 1.

Haploinsufficiency of Mic60 caused progressive defects in neuronal functions. (A) Level of Mic60 protein in the cerebella of Mic60 +/− mice compared to those in the control mice at P7. Mitochondrial inner membrane protein Tim23 and β‐actin were used as internal control. (B) Relative expression of Mic60 mRNA in mice cerebella at P7, 2 month (2m), 10m, and >12m mice. n = 5. (C and D) Gait analysis of wild type and Mic60 +/− mice. Strides, hind base and matching were measured in mice at 6m (C) and 12m (D). n = 10. (E and F) Balance beam tests of wild type and Mic60 +/− mice. Time durations (s) (E) to cross the beam were recorded for mice of 3m and 6m. Frequencies of hindfeet missteps (F) in mice of 3m and 6m old (n = 21). Morris water maze tests for distance (G), latency (H) and mean annulus crossing (I) of mice at 12m (n = 11). (J) Grip strength test of 12m‐old mice (n = 12). (K) Analysis of mean mice velocity (expressed in cm/s) (n = 12). White bar, Mic60 +/+; black bar, Mic60 +/−, Error bars represent standard error of the mean (SEM) in this and all following graphs.*p < 0.05, ***p < 0.001, N.S., non‐significant. (Non‐parametric Mann–Whitney t‐test for B–F, I–K. Repeated measures two‐way ANOVA with Tukey's HSD test for G, H).
3.2. Insufficient Mic60 alternates brain structural in mice
To explore the morphological basis of the neurological defects in Mic60 +/− mice, we then performed brain micro‐magnetic resonance imaging analysis (micro‐MRI) using paired Mic60 +/− and wild‐type mice. Representative coronal view of T2‐weighted micro‐MRI images of Mic60 +/− mice with neurological disorders revealed heterogeneity and partial enlargement of lateral ventricle in Mic60 +/− mice (Figure 2A, upper panel). The sizes of hippocampus and cerebellum were quantified by calculating the T2 values in sagittal images (Figure 2A, lower panel) followed by ROI analysis (Figure 2B). Compared to wild‐type mice, Mic60 +/− mice displayed a significant reduction in volume of hippocampus, and a trend toward less volume of cerebellum (p = .0509, non‐parametric Mann–Whitney t‐test) (Figure 2B). T2 mapping was carried out to quantify the differences observed in the T2‐weighted images. T2 relaxation time showed a significant difference in the regions of hippocampus and cerebellum between the wild‐type and Mic60 +/− mice (Figure 2C), which is similar to the MRI characters of ME patient.
FIGURE 2.

Heterozygotic Mic60 mice displayed brain structural alterations. (A) Representative MRI image shown in coronal view (upper panel) and sagittal view (lower panel) of Mic60 +/+ and Mic60 +/− mice at 18m. Cx, cerebral cortex; Hippo, hippocampus; Cb, cerebellum; LV, lateral ventricle. (B) The sizes of hippocampus and cerebella were quantified by calculating the T2 values in sagittal image. The size of hippocampus was measured by mean value of bilateral size in coronal view, and the size of cerebellum was measured by mean value of its size in 1 mm off the median sagittal view. (C) T2 relaxation times were calculated by T2 mapping between the Mic60 +/+ and Mic60 +/− mice in the regions of hippocampus and cerebella (n = 5). White bar, Mic60 +/+ ; black bar, Mic60 +/−, *p < 0.05. (Non‐parametric Mann–Whitney t‐test for B and C). (D) Representative immunostaining images of calbindin‐D28K (D28K) in cerebellar Purkinje cells (arrows) and tyrosine hydroxylase (TH, arrows) in substantia nigra (SNR) in mice with apparent neuronal phenotypes (>12m) (Original magnification ×40). M, molecular layer; P, Purkinje cells; Gr, granule cell layer. the scale bar represents 200 μm. (E) Upper panel: Silver staining of neurofibrillary tangle (NFT, arrows, insert) in hippocampus (Hippo) (original magnification ×40). the scale bar represents 200 μm. Lower panel: Electron microscopic view of mitochondria in cerebellar neuron from age‐matched mice at 12m. N, nucleus; the scale bar represents 500 nm. (F) KEGG pathway analysis of the differentially expressed proteins (DEPs) in heterozygotic Mic60 mice cerebella with LC–MS/MS. The top 10 KEGG pathways enriched in DEPs at each time point were shown. Size of the circles indicates the gene numbers, while the color bar represents the −log10(p value). (G) A Venn diagram showing the numbers and relationships of DEGs enriched in the HD, PD, OXPHOS, AD pathways in the mice of >12m. Thirty‐one proteins involved in mitochondrial complexes formation are enriched in all four pathways.
We next performed histological examination of the Mic60 +/− brains and found a significant loss of cerebellar Purkinje's cells (Figure 2D, upper panel) in 12m‐old mice with typical neurological abnormalities. As Mic60 may be related with dopamine function [12], we analyzed tyrosine hydroxylase (TH) immunoactivity and observed a marked reduction of dopaminergic neurons in the substantia nigra (SNR) of Mic60 +/− brain, mirroring pathological changes in PD (Figure 2D, lower panel). In addition, silver staining of Mic60 +/− brain revealed an increased numbers of neurofibrillary tangles (NFTs) in hippocampus (Figure 2E, upper panel), implying the presence of neurodegenerative changes. To further investigate the role of Mic60 in mitochondria, we examined mitochondrial morphology in Mic60 +/− cerebellar neurons by electron microscopy, and found less condensed mitochondria matrix, vacuolation, and partial loss of mitochondrial cristae (Figure 2E, lower panel). Taken together, these pathological changes indicate the presence of mitochondria‐associated neuronal disorders in Mic60 +/− mice.
3.3. Haploinsufficiency of Mic60 insults oxidative phosphorylation
To further understand the molecular basis of mitochondria dysfunction in Mic60 +/− brain, we performed proteomic analysis by using the mouse cerebella of different age groups (P7, 2m, 10m, >12m, respectively) (Figure S2a, Tables S1–S3). Through principal components analysis (PCA), an unsupervised approach designed to group samples based on their similarity in protein expression, we observed that PCA of cerebella from Mic60‐deficient and ‐proficient mice were closed at age of P7 based on global DEPs, suggesting a compensatory mitochondrial function in Mic60 +/− mice (Figure S2b). However, the data sets were moderately separated in the mature Mic60 +/− mice (2m and 10m) and significantly separated in the phenotypic (>12m) group, implying a compromised mitochondrial function and the onset of ME in the aged mice (Figure S2b). In total, 545 differentially expressed proteins (DEPs) were identified out of ~3000 proteins detected. There is the equal number of DEPs for down‐ and upregulated at P7. As the age grows, more of the DEPs were downregulated in the Mic60 +/− mice with apparent neurological abnormalities (Figure S2c). KEGG pathway analysis of all the DEPs revealed 10 most significant pathways in each group (Figure 2F). Strikingly, the top four pathways affected in Mic60‐deficient neurons were Huntington's disease (HD), Parkinson's disease (PD), OXPHOS pathways and Alzheimer's disease (AD) (Figure 2F). Additional pathways for metabolic pathways and carbon metabolism were also compromised in Mic60‐deficient brains. These six pathways showed similar dynamic patterns, throughout the four time points in Mic60 +/− cerebella. Haploinsufficiency of Mic60 gradually increased its impact on these six pathways from immature neurons (P7), mature neurons (2m and 10m) to aging neurons (>12m) that associates with the onset of neurological disorders in Mic60 +/− mice (Figure 2F). Notably, out of 58 DEPs involved in HD, PD, OXPHOS and AD pathways, 31 (53.4%) DEPs shared by all these four pathways are members of complex I, II, III, IV and complex V, which are essential for maintaining mitochondrial stability (Figure 2G). Thus, haploinsufficiency of Mic60 altered the expression levels of protein components of mitochondrial OXPHOS complexes in neurons that may cause defective mitochondrial respiratory chain integrity, and the dynamic changes of DEPs and associated pathways reveal early molecular events leading to the genesis of ME.
3.4. Haploinsufficiency of Mic60 alters mitochondrial function in the murine brain
To explore the mechanism of neuronal disorders in Mic60 +/− mice, we analyzed haploinsufficiency of Mic60 affected mitochondrial functions as it is essential for maintaining mitochondrial membrane architecture. However, we found that there was no difference in mtDNA copy number between wild‐type and Mic60 +/− mice (Figure 3A). Because the principal function of mitochondria is ATP synthesis through OXPHOS and brain cells have a high energy demand, we detected significantly impaired OXPHOS function (Figure 3B,C) and ATP generation in Mic60 +/− brain (Figure 3D), indicating basal mitochondrial oxygen consumption and ATP production levels getting worse while Mic60 haploinsufficiency. In addition, the Mic60 +/− brain exhibited a reduction in mitochondrial membrane potential (Figure 3E), suggesting a defective mitochondrial functions in the Mic60 +/− brain.
FIGURE 3.

Haploinsufficiency of Mic60 altered mitochondrial and metabolic function (A) mtDNA copy numbers in mice at 2m and 10m (n = 6). (B) Mitochondrial O2 consumption in cerebellar neuron under basal conditions, following the addition of 10 μL of M + P (0.8 M malic and 2 M pyruvic acid) and 5 μL of ADP (20 mM). (C) Respiratory control ratio (RCR) measured by mitochondrial state 3 (R3)/state 4 (R4) (n = 9). (D) Haploinsufficiency of Mic60 led to the decrease of ATP production in mice brains (n = 11). (E) Mitochondrial membrane potential measured by fluorescence intensity in mouse cerebella neuron (n = 6). *p < 0.05; **p < 0.01; ***p < 0.001. (Non‐parametric Mann–Whitney t‐test for A, C–E). (F) Brain microPET image after 18F‐FDG intake (dot circle). (G) Quantification of 18F‐FDG intake (nCi/cc) in brain normalized by the intake in the liver. (H) Representative 3‐day measurement of O2 consumption was performed at different time points for the reproducibility (left panel) (n = 4). Whole body metabolic assays for O2 consumption (VO2), CO2 production (VCO2), and RER (VCO2/VO2) in Mic60 +/+ and Mic60 +/− mice of different age were summarized in right panel. Blood tests were performed for measurement of lactate (LA) (I), glucose (GLUC) (J), lactate dehydrogenase (LDH) and creatine phosphate kinase (CPK) (K) in Mic60 +/+ and Mic60 +/− mice at 2 and 10m (n = 9). White bar, Mic60 +/+; black bar, Mic60 +/−; *p < 0.05; **p < 0.01; ***p < 0.001. (Non‐parametric Mann–Whitney t‐test for B, D–F. Repeated measures two‐way ANOVA with Tukey's HSD test for C). (L) Electron microscopic examination of mitochondrial density and distribution in the muscle of Mic60 +/+ and Mic60 +/− mice. The scale bar represents 1 μm. An enlarged view of mitochondria structure was included.
ROS are products of a normal cellular metabolism and well‐known biomarkers of mitochondrial metabolism [34, 35]. To monitor the consequence of compromised mitochondrial functions in the Mic60 +/− brain, we analyzed ROS level in brain tissues. Compared to that in the wild‐type mice, enhanced level of ROS was evidenced in Mic60‐deficient cerebellar neurons (Figure S3a,b). Consequently, Mic60 +/− cerebellar neurons exhibited high immunoactivity of 8‐oxo‐2′‐deoxyguanosine (8‐OHdG) and nitrotyrosine (Figure S3c), which are the major products of DNA and protein oxidation, respectively, implying an active endogenous oxidative stress in the Mic60 +/− brain.
To test whether Mic60 +/− mice are sensitive to exogenous DNA damage, postnatal day 7 (P7) mice were subjected to X‐ray irradiation. Upon DNA damage, early DNA damage response markers such as phosphorylated 53BP1 and SMC1 foci formation [36] were markedly increased in external granule cell layer (EGL) of proliferating Mic60 +/− cerebella compared to those in wild‐type cerebella (Figure S3d, upper and middle panels). In addition, Mic60 +/− cerebellar neurons exhibited an increased cell apoptosis after DNA damage (Figure S3d, lower panel). Together, these data imply that Mic60‐deficient neurons are more sensitive to DNA damage.
3.5. Mic60‐deficiency causes metabolic disturbance in murine brain
Accumulating evidence has suggested a strong correlation between metabolic changes and neurodegeneration [37, 38]. As metabolic pathway was significantly affected in Mic60‐deficient brain based on LC–MS/MS analysis, we next analyzed metabolic changes in heterozygotic Mic60 mice. As neurons are sensitive to energy supply and glucose is the major energy source to the adult brain under physiological conditions, we first monitored the glucose metabolism in the brains of paired wild‐type and Mic60 +/− mice through 18F‐fluorodeoxyglucose (18FDG) microPET scanning. A significant higher level of 18F‐FDG uptake was observed in the brain of Mic60 +/− mice (Figure 3F,G), suggesting an elevated glucose transport in the neurons. This likely reflects an increased anaerobic glycolysis as compensation to disturbed energy metabolism in Mic60 +/− mice. In addition, age‐matched wild‐type and Mic60 +/− mice without (2m and 10m) and with apparent neurological phenotypes (>12m, NDs) were subjected for Columbus metabolic assays. Notably, Mic60 +/− mice consumed significantly higher amount of O2, and produced more CO2, with higher respiratory exchange ratio (RER, VCO2/VO2) than that in wild‐type littermates of 2m and 10m old (Figures 3H and S4), indicating a compensatory response of Mic60 +/− mice. In contrast, these parameters in Mic60 +/− mice with phenotype (>12m) were dramatically reduced compared to that in age‐matched wild‐type controls (Figure 3H), implying a decompensatory process. Consequently, those Mic60 +/− mice with phenotype revealed higher levels of serum lactate (Figure 3I), glucose (Figure 3J), lactate dehydrogenase (LDH), and creatine phosphate kinase (CPK) (Figure 3K). Furthermore, electron microscopic examination of muscle from Mic60 +/− mice showed an increased density of mitochondria with relatively normal mitochondrial structure (Figure 3L). These results were in line with the DEPs analysis of involving metabolic pathways and carbon metabolism, and oxidative phosphorylation in Mic60 +/− cerebella (Figure 2F), and suggest an elevated anaerobic glycolysis to compensate a disturbance of energy metabolism in Mic60 +/− mice, resembling human ME.
3.6. Antioxidant rescues Mic60 deficiency‐induced mitochondria dysfunction
Because oxidative stress can be a cause of energy metabolic disorder, we speculate that reduction in ROS levels may be a therapeutics strategy for ME. N‐acetylcysteine (NAC) is an antioxidant nutrition for preventing many diseases including neural disorders [39], which is a potential medication for ME. The peak of ROS in NAC treated Mic60 +/− cerebellar mitochondria was ~50 AU., reduced to that in wild‐type mice, compared to ~200 AU. in untreated mice (Figure 4A). Haploinsufficiency of Mic60 increased ROS level in murine cerebella, and NAC administration declined ROS level significantly in Mic60 +/− mice (Figure 4B). Coincidently, NAC‐treated mitochondria from the Mic60 +/− cerebellar neurons exhibited an elevated O2 consumption and mitochondrial membrane potential (Figure 4C–E). Compared to vacuolation and partial loss of mitochondrial cristae in untreated Mic60 +/− cerebellar neurons, we do not observe abnormal mitochondria ultrastructure after NAC treatment (Figure 4F).
FIGURE 4.

Antioxidant treatment largely rescued the defective mitochondrial function. (A) The ROS level in isolated cerebellar mitochondria was measured with DCF in the presence or absence of antioxidant NAC. (B) Quantification of the ROS level in mice at P7 with or without NAC treatment (n = 6). (C) Mitochondrial O2 consumption in cerebellar neuron from 10m‐old mice treated with NAC. (D) Quantitative assessment of respiratory control ratio (RCR) by R3/R4 (n = 9). (E) Mitochondrial membrane potential was measured in 10m‐old cerebella with or without NAC treatment (n = 6). (F) Electron microscopic view of mitochondria in cerebellar neuron from 12m‐old cerebella with or without NAC treatment. N, nucleus; the scale bar represents 500 nm. White bar, Mic60 +/+ ; black bar, Mic60 +/− ; *p < 0.05; **p < 0.01; ***p < 0.001; N.S., non‐significant. Repeated measures two‐way ANOVA with Tukey's HSD test for B, D, E.
3.7. Behavior dysfunction is restored by NAC in Mic60 haploinsufficiency mice
To compare long‐term effect of NAC against ME, we supplied NAC for 1 year. In addition, administration of NAC led to a decrease in the levels of serum glucose, lactate, LDH and CPK in Mic60 +/− mice (Figure 5A,B). These were likely associated with an elevated glutathione peroxidase activity (Figure 5C). Whole body metabolic assay revealed that administration of NAC decreased O2 consumption, CO2 production, and RER in Mic60 +/− mice (for example, VO2 at 2m was reduced from 4354 ± 40 to 3270 ± 33 mL/kg/h, Figure 3H, Figure 5E–G). However, NAC‐treated Mic60 +/− mice still had relatively higher metabolic activity when compared to the wild‐type mice (Figure 5E–G). After NAC administration, Mic60 +/− mice showed similar time crossing balance beams and missteps increased at 1 year old by balance beam test compared to their littermate control, revealing improved motor balance and coordination (Figure 5H,I). To determine if antioxidant rescued Mic60 haploinsufficiency induced impairments by upregulation Mic60 level directly, we compared Mic60 expression among NAC treated and control groups. The Mic60 protein increased distinctly in the cerebella of Mic60 +/− mice after NAC treatment, to the normal level in Mic60 +/+ groups (Figure 5J,K), demonstrating antioxidant restored Mic60 haploinsufficiency induced dysfunction by upregulation Mic60 level. These results implicate that antioxidant NAC could largely reverse those metabolic alterations and neuronal dysfunction in Mic60 +/− mice.
FIGURE 5.
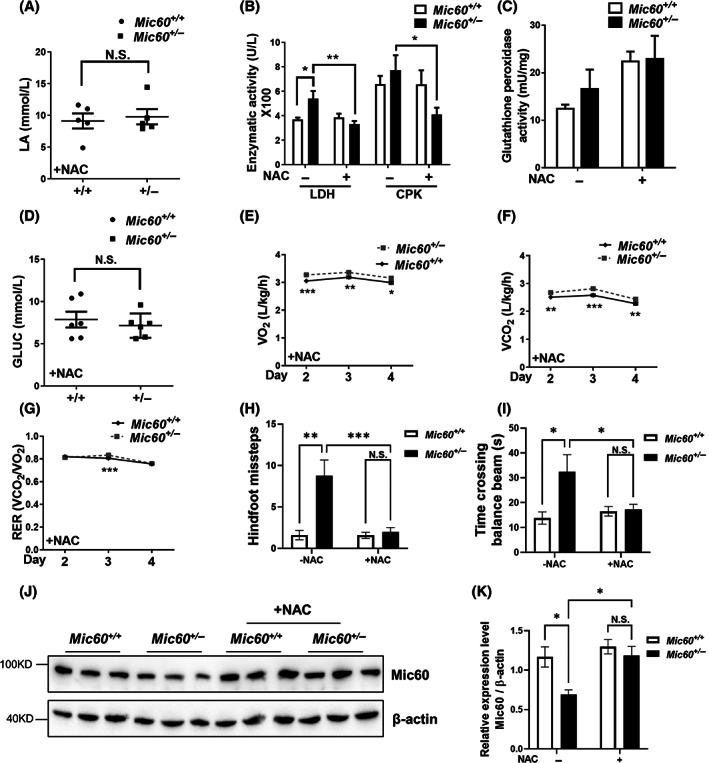
Antioxidant treatment largely rescued the metabolic disturbance and behavior dysfunction. Serum tests for lactate (A), glucose (D), lactate dehydrogenase (LDH), and creatine phosphate kinase (CPK) (B) in Mic60 +/+ and Mic60 +/− mice of 10m‐old with NAC treatment (n = 6). (C) Glutathione peroxidase activity in mice after treated with NAC for 4 weeks (n = 5). Whole body metabolic assays for O2 consumption (E), CO2 production (F), and RER (G) in Mic60 +/+ and Mic60 +/− mice with NAC treatment (n = 4). (H, I) Balance beam tests of wild type and Mic60 +/− mice with NAC treatment. Time durations (s) to cross the beam (h) and frequencies of hindfeet missteps (I) were recorded for mice of 1 year. (n = 10–14). Representative immunoblot images (J) and quantification (K) of Mic60 protein level in the cerebella of Mic60 +/− and Mic60 +/+ mice with/without NAC treatment. β‐Actin were used as internal control. (n = 3). White bar, Mic60 +/+ ; black bar, Mic60 +/− ; *p < 0.05; **p < 0.01; ***p < 0.001; N.S., non‐significant. (Non‐parametric Mann–Whitney t‐test for A, D. Repeated measures two‐way ANOVA with Tukey's HSD test for B, C, E–I).
3.8. ME is associated with decreased MIC60 in ME patients
According to above results, we found that majority phenotypes of Mic60 +/− mice were consistent with the symptom of human ME suggest that haploinsufficiency of Mic60 might act as a potential cause of the disease. Although majority of ME resulted from mutations of mtDNA [40], the pathogenesis of a subset of ME (sME) without mtDNA mutation remains unknown. Because mutations of nuclear genes encoding mitochondria OXPHOS complexes play an important role in mitochondria disorders [41], and Mic60 serves as a key component of the MICOS, we therefore tested whether MIC60 is involved in the sME. We thus selected eight patients of sME without mtDNA mutation to investigate the possible role of MIC60 (Table S4). These patients with sME were diagnosed based on mosaic ragged red fibers (RRF), ragged blue fibers (RBF), mitochondria proliferation, and crystalloid inclusions in muscle biopsies, in addition to typical neurological and neuroimaging changes (Table S4, Figure 6A).
FIGURE 6.

Down‐expression of MIC60 in human ME in the absence of mtDNA mutation. (A) Representative histological analysis of mitochondrial encephalomyopathies without mtDNA mutation. Biopsies was subjected for hematoxylin–eosin (H&E), the modified Gomori trichrome (GMT) for ragged‐red fibers (RRF), succinate dehydrogenase (SDH), and Electron micrograph (EM) for ragged‐blue fibers. (B) Representative immunofluorescence staining of MIC60, mitochondrial complex V and inner membrane protein TFAM. (C) Western blotting of MIC60 protein from representative patients (P337, P330, P309, and P303). (D) Quantification of protein expression of MIC60. **p < 0.01. (Non‐parametric Mann–Whitney t‐test). N, control; P, ME patients without mtDNA mutation; M, ME patients with mtDNA mutations. n = 7 for N, n = 8 for p, and n = 4 for M.
We then performed immunostaining analysis for MIC60 from muscle biopsies of the sME patients and observed a mosaic or uniform reduction of MIC60 (Figure 6B). In addition, MIC60 colocalized with OXPHOS complex V and mitochondrial transcription factor A (TFAM), and a significant decrease of complex V and TFAM were evidenced (Figure 6B). The reduction of MIC60 protein was further analyzed by Western blotting (Figure 6C,D) in the sME patients. We also included four ME patients with mtDNA mutations (M) as control, and no conclusive information obtained because of varied level of MIC60 (Figure 6C,D). These results imply that MIC60 may involve in the pathogenesis of sME.
4. DISCUSSION
Given the importance of Mic60 in regulating mitochondrial function and mitochondrial dysfunction contributes to several neural diseases, we generated Mic60‐deficient mice to identify whether Mic60 contributes to the pathogenesis of neurodegeneration. We found that haploinsufficiency of Mic60 in mice caused neurological abnormalities with defective mitochondrial structure and function, as well as metabolic disorders, similar to ME patients [1]. Consistently, pathological alterations of sME patients suggested dysfunction of MIC60. Administration of NAC, which enhances mitochondria function, restored neuronal and behavior function. These finding illustrated Mic60 haploinsufficiency caused mitochondria dysfunction, which could be major etiology and therapeutics for ME.
Through a dynamic DEPs analysis, we discovered that in addition to OXPHOS, haploinsufficiency of Mic60 mainly affected proteins involved in functional pathways of PD, AD, and HD, implying that they may share similar molecular mechanism with sME. Functional study of Mic60 may also help us to understand other neurodegenerative disease as well. Notably, 31 DEPs shared in all the four pathways were components of mitochondrial complexes I–V (Figure 2G), implying that altered mitochondrial OXPHOS complexes may play a causal role in the sME. In addition, decreased mitochondrial membrane potential, ATP production (not because of the reduction of ATPase activity, data not shown), and accumulation of ROS in Mic60 +/− cerebellar neurons (Figure 3) revealed a defective mitochondrial integrity [42]. Although how Mic60‐deficiency affects expression of mitochondrial OXPHOS remains to be answered, this study provides a potential molecular basis for compromised mitochondrial integrity in inducing a subset of neurodegenerative disorders.
Mitochondria play a vital role in neuronal metabolism, in which OXPHOS is the main source of ATP [1]. Consistent with the KEGG pathway analysis of DEPs (Figure 2), haploinsufficiency of Mic60 in mice led to metabolic disorders with abnormal O2 consumption, glucose metabolism, and lactic acidosis, suggesting the importance of Mic60 in the maintenance of cellular metabolic activity to compensate high energy demand in vivo. This response in Mic60 +/− mice, however, was compromised during aging, leading to neurological abnormalities reminiscent of neurodegenerative disorders.
We reasoned that haploinsufficiency of Mic60 may induce leakage of electron transport across the inner membrane leading to accumulation of ROS, and thereby tested the role of antioxidant NAC in Mic60 +/− mice. We found that NAC treatment largely restored the changes of mitochondrial membrane potential, and the level of O2 consumption following ROS reduction in Mic60 +/− mice. It is likely that altered mitochondrial OXPHOS complexes may be an early response to Mic60 deficiency. Subsequently, defective OXPHOS and ATP synthesis, accumulation of ROS led to neurodegeneration [1, 43]. In line with this notion, an increased expression of MIC60 has been observed in human cardiac myopathy patients [44], and overexpression of Mic60 in mice led to cardiac hypertrophy in response to hypertrophic stimuli that associated with a decreased cardiac OXPHOS activity and increased ROS production [45]. Thus, a balanced amount of Mic60 is crucial for the maintenance of mitochondrial integrity and in suppressing ME.
As majority of phenotypes of Mic60 +/− mice were fit with the symptom of human ME, we therefore selected muscle biopsies from eight patients of sME without mtDNA mutation and seven normal patients with other diseases which will not affect mitochondrial function. Notably, dramatic decreased expression of MIC60 protein was observed in the sME patients coupled with alterations of OXPHOS complex V and mitochondrial TFAM, indicating MIC60 correlated to ME. Unfortunately, because of the small sample size of sME patients, and lacks ME animal model, detailed role of MIC60 in sME needs to be further investigated. In addition, we did not find mutation in Mic60 exons from eight sME patients (data not shown), indicating sME maybe not a hereditary disease.
In summary, the present study suggests a role of MIC60 in the pathogenesis of ME, and haploinsufficiency Mic60 induced ME in murine. Importantly, defective mitochondrial function and metabolic alterations in heterozygote Mic60 mice can be largely rescued by administration of NAC, implying a potential application of NAC in the treatment of defective mitochondrial‐associated neurodegenerative disorders.
AUTHOR CONTRIBUTIONS
De‐Pei Liu and Wei‐Min Tong initiated the project. Tingting Dong performed most of the experiments. Zai‐Qiang Zhang and Xiuru Zhang performed clinical study. Li‐Hong Sun, Rui‐Feng Yang, Hou‐Zao Chen, and De‐Pei Liu generated the Mic60 knockout mice. Li‐Hong Sun and Lin Lin performed human samples analysis. An Lv, Chunying Liu, and Qing Li performed behavior study. Tingting Dong and Zhaohui Zhu performed small animal image analysis. Weilong Zhang and Lin Yang performed bioinformatics analysis. Tingting Dong, Li‐Hong Sun, Yamei Niu, and Hou‐Zao Chen performed data analysis. Tingting Dong, Yamei Niu, and Wei‐Min Tong wrote the manuscript.
FUNDING INFORMATION
Wei‐Min Tong was supported by National Key R&D Program of China (2019FYA080703), the National Natural Science Foundation of China (31471343), and CAMS Initiative for Innovative Medicine (2016‐I2M‐2‐001). De‐Pei Liu was supported by National Key R&D Program of China (2021YFA0804900). Yamei Niu was supported by CAMS Initiative for Innovative Medicine (2021‐I2M‐1‐020). Tingting Dong was supported by the National Natural Science Foundation of China (82201275), the Interdisciplinary Program of Shanghai Jiao Tong University (YG2022QN064), and Cross disciplinary Research Fund of Shanghai Ninth People's Hospital, Shanghai Jiao Tong university School of Medicine (JYJC202104).
CONFLICT OF INTEREST STATEMENT
The authors declare no conflicts of interest.
Supporting information
Data S1. Extended experimental procedures.
Figure S1. (Related to Figure 1). Generation and behavior tests of heterozygotic Mic60 mice. (a) Map of wild‐type and Geo trap inserted Mic60 locus into the third intron. Probes and primers used for genotyping analysis are depicted. (b) Map of the wild‐type Mic60 transcripts and Mic60‐Geo fusion protein after Geo trap insertion between exons 3 and 4 of the Mic60 gene. Primers and transcripts are depicted. (c) Western blot analysis of tissue lysates obtained from wild‐type and Mic60 +/− mice using antibody specific for Mic60, β‐actin was used as an internal control. (d) Southern blot analysis of E7.5 Mic60 −/− , Mic60 +/− and wild‐type embryos. Digestion of embryonic DNA with Bgl II and EcoR I generates a fragment of 5.1 kb in wild‐type and a novel 2.1‐kb knockout fragment in Mic60 +/− and Mic60 −/− embryos. (e) Morphology of wild‐type and Mic60 −/− embryos at E7.5 and E9.5. E7.5 embryos are enclosed by a yolk sac. Mic60 −/− embryos were stained with X‐gal in the presence of the Geo (lac Z/Neo fusion protein) insertion in the Mic60 allele. Note that the Mic60 −/− embryos are smaller than wild‐type embryos. E9.5 Mic60 −/− embryos showed no clear shape. (f) TUNEL assays were used to identify apoptotic nuclei in transversely sectioned E9.5 embryos. The scale bars represent 200 μm. (g) Footprints of hind paws (blue) and fore paws (red) were applied for gait analysis in Mic60 +/+ and Mic60 +/− mice. (H) Morris water maze test showing the tracks of swimming of Mic60 +/+ and Mic60 +/− mice at age of 12 month.
Figure S2. (Related to Figure 2). Proteome‐wide identification of differentially expressed proteins (DEPs) in mouse cerebella between wild type and Mic60 +/− mice with LC–MS/MS. (a) Overview of the LC–MS/MS analysis are included in Table S1. (b) Principal components analysis (PCA) using the 716 expressed proteins data. (Detailed information was included in Table S1). (c). Numbers of proteins up‐ or downregulated at each time point between Mic60 +/+ and Mic60 +/− cerebella.
Figure S3. (Related to Figure 3). (a) Comparison of ROS levels as measured by fluorescence intensity in Mic60‐deficient cerebella. The levels of ROS in mice at 3m, 6m, 9m, 12m, 18m, and 24m were analyzed by DHE staining in mouse cerebella. In total, three independent experiments were repeated. (b) Fluorescence in cerebellum (a) were quantified and compared between Mic60 +/+ (white bar) and Mic60 +/− (black bar) for expression level of ROS. (c) Representative images showing endogenous oxidative damage in cerebellar DNA by 8‐OHdG staining and protein by nitrotyrosine staining using mice at 14m (original magnification ×40). (d) Representative immunofluorescence for 53BP1, SMC1, and caspase 3 to analyze exogenous DNA damage response in mouse cerebella (p7) (original magnification ×40).
Figure S4. (Related to Figure 3). Reproducibility of whole‐body metabolic analysis for CO2 production and RER in Mic60 +/+ and Mic60 +/− mice.
Tables S1–S3. Protein lists obtained from LC–MS/MS analysis of wild‐type and Mic60 +/− mice cerebella. (Related to Figures 4 and S3). See separate file.
Table S4. Clinical, muscle histopathological and molecular genetics findings of 12 adult patients. See separate file.
ACKNOWLEDGMENTS
We thank Mrs. H. M. Zhao, W. Hao, and Dr. H. X. Cui for their excellent technical assistance in the maintenance of the animal colonies, Dr. H. Sun for the LC–MS/MS data analysis, Tianjin University of Sport for mitochondrial analysis. We also thank Drs. L. Li, T. Tang, and Z. Zheng for critical reading of the manuscript and valuable comments, and Dr. Q. Chen for Tim23 antibody.
Dong T, Zhang Z‐Q, Sun L‐H, Zhang W, Zhu Z, Lin L, et al. Mic60 is essential to maintain mitochondrial integrity and to prevent encephalomyopathy. Brain Pathology. 2023;33(4):e13157. 10.1111/bpa.13157
Tingting Dong and Zai‐Qiang Zhang contributed equally to this study.
Contributor Information
De‐Pei Liu, Email: liudp@pumc.edu.cn.
Wei‐Min Tong, Email: wmtong@ibms.pumc.edu.cn.
DATA AVAILABILITY STATEMENT
Data sharing is not applicable to this article as no new data were created or analyzed in this study.
REFERENCES
- 1. DiMauro S, Schon EA. Mitochondrial disorders in the nervous system. Annu Rev Neurosci. 2008;31:91–123. [DOI] [PubMed] [Google Scholar]
- 2. Nunomura A, Moreira PI, Castellani RJ, Lee HG, Zhu X, Smith MA, et al. Oxidative damage to RNA in aging and neurodegenerative disorders. Neurotox Res. 2012;22(3):231–48. [DOI] [PubMed] [Google Scholar]
- 3. Burchell VS, Gandhi S, Deas E, Wood NW, Abramov AY, Plun‐Favreau H. Targeting mitochondrial dysfunction in neurodegenerative disease: part I. Expert Opin Ther Targets. 2010;14(4):369–85. [DOI] [PubMed] [Google Scholar]
- 4. Burchell VS, Gandhi S, Deas E, Wood NW, Abramov AY, Plun‐Favreau H. Targeting mitochondrial dysfunction in neurodegenerative disease: part II. Expert Opin Ther Targets. 2010;14(5):497–511. [DOI] [PubMed] [Google Scholar]
- 5.McFarland R, Taylor RW, Turnbull DM. The neurology of mitochondrial DNA disease. Lancet Neurol. 2002;1(6):343–51. [DOI] [PubMed] [Google Scholar]
- 6. Schapira AH. Mitochondrial diseases. Lancet. 2012;379(9828):1825–34. [DOI] [PubMed] [Google Scholar]
- 7. Tuppen HA, Blakely EL, Turnbull DM, Taylor RW. Mitochondrial DNA mutations and human disease. Biochim Biophys Acta. 2010;1797(2):113–28. [DOI] [PubMed] [Google Scholar]
- 8. Chinnery PF. Searching for nuclear‐mitochondrial genes. Trends Genet. 2003;19(2):60–2. [DOI] [PubMed] [Google Scholar]
- 9. Tateo I, Tohoru I, Yukie M, Fumio H, Kazuhiko K, Nobuo T. A novel human gene that is preferentially transcribed in heart muscle. Gene. 1994;144(2):301–6. [DOI] [PubMed] [Google Scholar]
- 10. Gieffers C, Korioth F, Heimann P, Ungermann C, Frey J. Mitofilin is a transmembrane protein of the inner mitochondrial membrane expressed as two isoforms. Exp Cell Res. 1997;232(2):395–9. [DOI] [PubMed] [Google Scholar]
- 11. Myung J, Gulesserian T, Fountoulakis M, Lubec G. Deranged hypothetical proteins Rik protein, nit protein 2 and mitochondrial inner membrane protein, Mitofilin, in fetal down syndrome brain. Cell Mol Biol. 2003;49(5):739. [PubMed] [Google Scholar]
- 12. Van Laar VS, Dukes AA, Cascio M, Hastings TG. Proteomic analysis of rat brain mitochondria following exposure to dopamine quinone: implications for Parkinson disease. Neurobiol Dis. 2008;29(3):477–89. [DOI] [PMC free article] [PubMed] [Google Scholar]
- 13. Feng Y, Madungwe NB, Bopassa JC. Mitochondrial inner membrane protein, Mic60/Mitofilin in mammalian organ protection. J Cell Physiol. 2019;234(3):3383–93. [DOI] [PMC free article] [PubMed] [Google Scholar]
- 14. Guarani V, McNeill EM, Paulo JA, Huttlin EL, Frohlich F, Gygi SP, et al. QIL1 is a novel mitochondrial protein required for MICOS complex stability and cristae morphology. Elife. 2015;4:e06265. [DOI] [PMC free article] [PubMed] [Google Scholar]
- 15. Pfanner N, van der Laan M, Amati P, Capaldi RA, Caudy AA, Chacinska A, et al. Uniform nomenclature for the mitochondrial contact site and cristae organizing system. J Cell Biol. 2014;204(7):1083–6. [DOI] [PMC free article] [PubMed] [Google Scholar]
- 16. Zerbes RM, van der Klei IJ, Veenhuis M, Pfanner N, van der Laan M, Bohnert M. Mitofilin complexes: conserved organizers of mitochondrial membrane architecture. Biol Chem. 2012;393(11):1247–61. [DOI] [PubMed] [Google Scholar]
- 17. Darshi M, Mendiola VL, Mackey MR, Murphy AN, Koller A, Perkins GA, et al. ChChd3, an inner mitochondrial membrane protein, is essential for maintaining crista integrity and mitochondrial function. J Biol Chem. 2011;286(4):2918–32. [DOI] [PMC free article] [PubMed] [Google Scholar]
- 18. John GB, Shang Y, Li L, Renken C, Mannella CA, Selker JM, et al. The mitochondrial inner membrane protein Mitofilin controls cristae morphology. Mol Biol Cell. 2005;16(3):1543–54. [DOI] [PMC free article] [PubMed] [Google Scholar]
- 19. Ott C, Ross K, Straub S, Thiede B, Gotz M, Goosmann C, et al. Sam50 functions in mitochondrial intermembrane space bridging and biogenesis of respiratory complexes. Mol Cell Biol. 2012;32(6):1173–88. [DOI] [PMC free article] [PubMed] [Google Scholar]
- 20. von der Malsburg K, Müller JM, Bohnert M, Oeljeklaus S, Kwiatkowska P, Becker T, et al. Dual role of Mitofilin in mitochondrial membrane organization and protein biogenesis. Dev Cell. 2011;21(4):694–707. [DOI] [PubMed] [Google Scholar]
- 21. Xie J, Marusich MF, Souda P, Whitelegge J, Capaldi RA. The mitochondrial inner membrane protein Mitofilin exists as a complex with SAM50, metaxins 1 and 2, coiled‐coil‐helix coiled‐coil‐helix domain‐containing protein 3 and 6 and DnaJC11. FEBS Lett. 2007;581(18):3545–9. [DOI] [PubMed] [Google Scholar]
- 22. Yang RF, Zhao GW, Liang ST, Zhang Y, Sun LH, Chen HZ, et al. Mitofilin regulates cytochrome c release during apoptosis by controlling mitochondrial cristae remodeling. Biochem Biophys Res Commun. 2012;428(1):93–8. [DOI] [PubMed] [Google Scholar]
- 23. Park YU, Jeong J, Lee H, Mun JY, Kim JH, Lee JS, et al. Disrupted‐in‐schizophrenia 1 (DISC1) plays essential roles in mitochondria in collaboration with Mitofilin. Proc Natl Acad Sci U S A. 2010;107(41):17785–90. [DOI] [PMC free article] [PubMed] [Google Scholar]
- 24. Rossi MN, Carbone M, Mostocotto C, Mancone C, Tripodi M, Maione R, et al. Mitochondrial localization of PARP‐1 requires interaction with Mitofilin and is involved in the maintenance of mitochondrial DNA integrity. J Biol Chem. 2009;284(46):31616–24. [DOI] [PMC free article] [PubMed] [Google Scholar]
- 25. Tahbaz N, Subedi S, Weinfeld M. Role of polynucleotide kinase/phosphatase in mitochondrial DNA repair. Nucleic Acids Res. 2012;40(8):3484–95. [DOI] [PMC free article] [PubMed] [Google Scholar]
- 26. Weihofen A, Thomas KJ, Ostaszewski BL, Cookson MR, Selkoe DJ. Pink1 forms a multiprotein complex with Miro and Milton, linking Pink1 function to mitochondrial trafficking. Biochemistry. 2009;48(9):2045–52. [DOI] [PMC free article] [PubMed] [Google Scholar]
- 27. Akabane S, Uno M, Tani N, Shimazaki S, Ebara N, Kato H, et al. PKA regulates PINK1 stability and parkin recruitment to damaged mitochondria through phosphorylation of MIC60. Mol Cell. 2016;62(3):371–84. [DOI] [PubMed] [Google Scholar]
- 28. Tsai PI, Lin CH, Hsieh CH, Papakyrikos AM, Kim MJ, Napolioni V, et al. PINK1 phosphorylates MIC60/Mitofilin to control structural plasticity of mitochondrial crista junctions. Mol Cell. 2018;69(5):744–56 e6. [DOI] [PubMed] [Google Scholar]
- 29. Zielonka J, Kalyanaraman B. Hydroethidine‐ and MitoSOX‐derived red fluorescence is not a reliable indicator of intracellular superoxide formation: another inconvenient truth. Free Radic Biol Med. 2010;48(8):983–1001. [DOI] [PMC free article] [PubMed] [Google Scholar]
- 30. Wang H, Joseph JA. Quantifying cellular oxidative stress by dichlorofluorescein assay using microplate reader. Free Radic Biol Med. 1999;27(5–6):612–6. [DOI] [PubMed] [Google Scholar]
- 31. Wu J, Mao X, Cai T, Luo J, Wei L. KOBAS server: a web‐based platform for automated annotation and pathway identification. Nucleic Acids Res. 2006;34:W720–Web Server issue, W724. [DOI] [PMC free article] [PubMed] [Google Scholar]
- 32. Xie C, Mao X, Huang J, Ding Y, Wu J, Dong S, et al. KOBAS 2.0: a web server for annotation and identification of enriched pathways and diseases. Nucleic Acids Res. 2011;39(Web Server issue):W316–22. [DOI] [PMC free article] [PubMed] [Google Scholar]
- 33. Gnaiger E. Bioenergetics at low oxygen: dependence of respiration and phosphorylation on oxygen and adenosine diphosphate supply. Respir Physiol. 2001;128(3):277–97. [DOI] [PubMed] [Google Scholar]
- 34. Ott M, Gogvadze V, Orrenius S, Zhivotovsky B. Mitochondria, oxidative stress and cell death. Apoptosis. 2007;12(5):913–22. [DOI] [PubMed] [Google Scholar]
- 35. Scherz‐Shouval R, Elazar Z. ROS, mitochondria and the regulation of autophagy. Trends Cell Biol. 2007;17(9):422–7. [DOI] [PubMed] [Google Scholar]
- 36. Lukas J, Lukas C, Bartek J. More than just a focus: the chromatin response to DNA damage and its role in genome integrity maintenance. Nat Cell Biol. 2011;13(10):1161–9. [DOI] [PubMed] [Google Scholar]
- 37. Blandini F, Braunewell KH, Manahan‐Vaughan D, Orzi F, Sarti P. Neurodegeneration and energy metabolism: from chemistry to clinics. Cell Death Differ. 2004;11(4):479–84. [DOI] [PubMed] [Google Scholar]
- 38. Procaccini C, Santopaolo M, Faicchia D, Colamatteo A, Formisano L, de Candia P, et al. Role of metabolism in neurodegenerative disorders. Metabolism. 2016;65(9):1376–90. [DOI] [PubMed] [Google Scholar]
- 39. Liu J, Cao L, Chen J, Song S, Lee IH, Quijano C, et al. Bmi1 regulates mitochondrial function and the DNA damage response pathway. Nature. 2009;459(7245):387–92. [DOI] [PMC free article] [PubMed] [Google Scholar]
- 40. Zhang ZQ, Niu ST, Liang XH, Jian F, Wang Y. Vascular involvement in the pathogenesis of mitochondrial encephalomyopathies. Neurol Res. 2010;32(4):403–8. [DOI] [PubMed] [Google Scholar]
- 41. Zeviani M, Spinazzola A, Carelli V. Nuclear genes in mitochondrial disorders. Curr Opin Genet Dev. 2003;13(3):262–70. [DOI] [PubMed] [Google Scholar]
- 42. Schon EA, Przedborski S. Mitochondria: the next (neurode)generation. Neuron. 2011;70(6):1033–53. [DOI] [PMC free article] [PubMed] [Google Scholar]
- 43. Figueira TR, Barros MH, Camargo AA, Castilho RF, Ferreira JC, Kowaltowski AJ, et al. Mitochondria as a source of reactive oxygen and nitrogen species: from molecular mechanisms to human health. Antioxid Redox Signal. 2013;18(16):2029–74. [DOI] [PubMed] [Google Scholar]
- 44. Marin‐Garcia J, Goldenthal MJ, Moe GW. Mitochondrial pathology in cardiac failure. Cardiovasc Ther Res. 2001;49(1):17–26. [DOI] [PubMed] [Google Scholar]
- 45. Zhang Y, Xu J, Luo YX, An XZ, Zhang R, Liu G, et al. Overexpression of Mitofilin in the mouse heart promotes cardiac hypertrophy in response to hypertrophic stimuli. Antioxid Redox Signal. 2014;21:1693–707. [DOI] [PubMed] [Google Scholar]
Associated Data
This section collects any data citations, data availability statements, or supplementary materials included in this article.
Supplementary Materials
Data S1. Extended experimental procedures.
Figure S1. (Related to Figure 1). Generation and behavior tests of heterozygotic Mic60 mice. (a) Map of wild‐type and Geo trap inserted Mic60 locus into the third intron. Probes and primers used for genotyping analysis are depicted. (b) Map of the wild‐type Mic60 transcripts and Mic60‐Geo fusion protein after Geo trap insertion between exons 3 and 4 of the Mic60 gene. Primers and transcripts are depicted. (c) Western blot analysis of tissue lysates obtained from wild‐type and Mic60 +/− mice using antibody specific for Mic60, β‐actin was used as an internal control. (d) Southern blot analysis of E7.5 Mic60 −/− , Mic60 +/− and wild‐type embryos. Digestion of embryonic DNA with Bgl II and EcoR I generates a fragment of 5.1 kb in wild‐type and a novel 2.1‐kb knockout fragment in Mic60 +/− and Mic60 −/− embryos. (e) Morphology of wild‐type and Mic60 −/− embryos at E7.5 and E9.5. E7.5 embryos are enclosed by a yolk sac. Mic60 −/− embryos were stained with X‐gal in the presence of the Geo (lac Z/Neo fusion protein) insertion in the Mic60 allele. Note that the Mic60 −/− embryos are smaller than wild‐type embryos. E9.5 Mic60 −/− embryos showed no clear shape. (f) TUNEL assays were used to identify apoptotic nuclei in transversely sectioned E9.5 embryos. The scale bars represent 200 μm. (g) Footprints of hind paws (blue) and fore paws (red) were applied for gait analysis in Mic60 +/+ and Mic60 +/− mice. (H) Morris water maze test showing the tracks of swimming of Mic60 +/+ and Mic60 +/− mice at age of 12 month.
Figure S2. (Related to Figure 2). Proteome‐wide identification of differentially expressed proteins (DEPs) in mouse cerebella between wild type and Mic60 +/− mice with LC–MS/MS. (a) Overview of the LC–MS/MS analysis are included in Table S1. (b) Principal components analysis (PCA) using the 716 expressed proteins data. (Detailed information was included in Table S1). (c). Numbers of proteins up‐ or downregulated at each time point between Mic60 +/+ and Mic60 +/− cerebella.
Figure S3. (Related to Figure 3). (a) Comparison of ROS levels as measured by fluorescence intensity in Mic60‐deficient cerebella. The levels of ROS in mice at 3m, 6m, 9m, 12m, 18m, and 24m were analyzed by DHE staining in mouse cerebella. In total, three independent experiments were repeated. (b) Fluorescence in cerebellum (a) were quantified and compared between Mic60 +/+ (white bar) and Mic60 +/− (black bar) for expression level of ROS. (c) Representative images showing endogenous oxidative damage in cerebellar DNA by 8‐OHdG staining and protein by nitrotyrosine staining using mice at 14m (original magnification ×40). (d) Representative immunofluorescence for 53BP1, SMC1, and caspase 3 to analyze exogenous DNA damage response in mouse cerebella (p7) (original magnification ×40).
Figure S4. (Related to Figure 3). Reproducibility of whole‐body metabolic analysis for CO2 production and RER in Mic60 +/+ and Mic60 +/− mice.
Tables S1–S3. Protein lists obtained from LC–MS/MS analysis of wild‐type and Mic60 +/− mice cerebella. (Related to Figures 4 and S3). See separate file.
Table S4. Clinical, muscle histopathological and molecular genetics findings of 12 adult patients. See separate file.
Data Availability Statement
Data sharing is not applicable to this article as no new data were created or analyzed in this study.