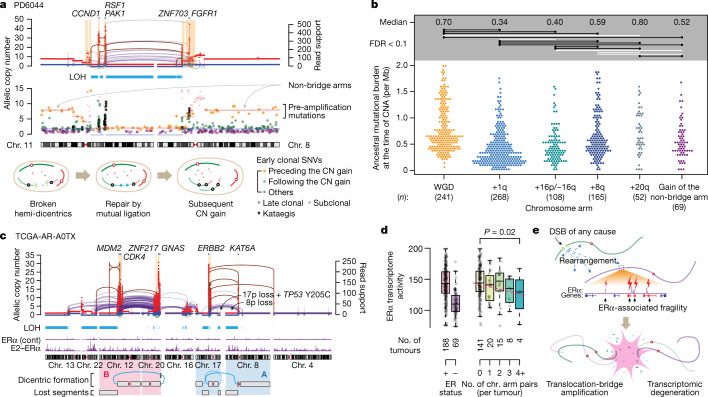
Fig. 4. Timing and transcriptional effect of TB amplification.
a, Top, a case with TB amplification showing both non-bridge arms amplified to the same copy-number level. Middle, SNVs were plotted based on their location and copy number. Their colour codes indicate the classification based on timing. Bottom, schematic of the evolution after the bridge breakage in this case. b, Timing of frequent copy-number gains in 780 breast cancers, based on the estimated tumour mutation burden (per diploid genome) at the timing of copy-number gains. Two-sided Wilcoxon test. Raw P values from top to bottom: 8.2 × 10⁻²⁷, 4.9 × 10⁻¹⁴, 0.0026, 0.78, 6.6 × 10⁻⁶, 0.052, 1.3 × 10⁻¹¹, 6.5 × 10⁻⁸, 0.00070, 1.1 × 10⁻⁵, 1.1 × 10⁻⁵, 0.050, 0.15, 0.053 and 0.0043. The comparisons with FDR <0.1 are annotated as black horizontal lines. White lines indicate non-significant comparisons. CNA, copy number alteration. c, A case with two rounds of TB amplification. The A (involving chromosomes 17, 8, and 4) and B (12, 20, and others) rounds of TB amplifications form two discrete clusters of complex genomic rearrangements without exchanging translocations to each other. d, The activity of ERα-medicated transcriptome from RNA sequencing. Box plots indicate median (middle line), first and third quartiles (edges) and 1.5× the interquartile range (whiskers). Statistical significance was assessed by linear regression. e, A schematic illustration of the consequence of ERα-associated fragility.

