

Abstract
Soil salinity impairs plant growth reducing crop productivity. Toxic accumulation of sodium ions is counteracted by the Salt Overly Sensitive (SOS) pathway for Na+ extrusion, comprising the Na+ transporter SOS1, the kinase SOS2, and SOS3 as one of several Calcineurin‐B‐like (CBL) Ca2 + sensors. Here, we report that the receptor‐like kinase GSO1/SGN3 activates SOS2, independently of SOS3 binding, by physical interaction and phosphorylation at Thr16. Loss of GSO1 function renders plants salt sensitive and GSO1 is both sufficient and required for activating the SOS2‐SOS1 module in yeast and in planta. Salt stress causes the accumulation of GSO1 in two specific and spatially defined areas of the root tip: in the endodermis section undergoing Casparian strip (CS) formation, where it reinforces the CIF‐GSO1‐SGN1 axis for CS barrier formation; and in the meristem, where it creates the GSO1‐SOS2‐SOS1 axis for Na+ detoxification. Thus, GSO1 simultaneously prevents Na+ both from diffusing into the vasculature, and from poisoning unprotected stem cells in the meristem. By protecting the meristem, receptor‐like kinase‐conferred activation of the SOS2‐SOS1 module allows root growth to be maintained in adverse environments.
Keywords: Arabidopsis, meristem, receptor‐like kinase, salt stress, SOS pathway
Subject Categories: Plant Biology
This report identifies a receptor‐kinase which activates a sodium ion extrusion pathway in roots growing in high salt concentrations.

Introduction
Soil salinity adversely affects plant growth and development. As a consequence of salt stress exposure, excess accumulation of Na+ ions in the cytosol becomes toxic by impairing various essential cellular activities, including for example photosynthesis and potassium homeostasis. Upholding a suitable cellular Na+ homeostasis requires adequately coordinated adjustments of Na+ uptake, sequestration, and extrusion (Yang & Guo, 2018). Moreover, to avoid toxic accumulation of Na+ at the organ and organism scale, Na+ is extruded from roots and other organs and root‐to‐shoot translocation of Na+ is minimized (Köster et al, 2019). These Na+ tolerance mechanisms need to be coordinated and integrated with developmental adaptation reactions, like for example, the adjustments of root growth or flowering time. However, components and processes that convey development‐detoxification coordination and the spatio‐temporal organization of Na+ detoxification in complex tissues and organs remain only fragmentary understood. Moreover, how inter‐cellular and trans‐organ Na+ transport between root and shoot are principally regulated and are adjusted to fluctuating Na+ concentrations in the rhizosphere awaits elucidation.
In Arabidopsis, Na+ may cross the plasma membrane via various channels and transporters (Raddatz et al, 2020). The High‐affinity K+ Transporters (HKT) function in fact as either Na+‐K+ symporters or Na+ uniporters. Arabidopsis HKT1;1 operates to retrieve Na+ from the transpiration stream (Sunarpi et al, 2005). Other transport proteins potentially contributing to Na+ entry are calcium‐permeable Non‐Selective Cation Channels (NSCCs), Cyclic Nucleotide Gated Channels (CNGCs), and Glutamate‐Like Receptors (GLR) (Hua et al, 2003; Tester & Davenport, 2003; Tapken & Hollmann, 2008).
Plants have evolved various mechanisms for extruding Na+ out of cells and organs to maintain their Na+ homeostasis during salt stress. The Salt Overly Sensitive (SOS) pathway is a conserved and important regulatory mechanism for Na+ exclusion from the cytosol and for alleviating long‐distance transport of toxic Na+ from the root to the shoot tissues (Shi et al, 2002; OlÍas et al, 2009; EI Mahi et al, 2019). Salt stress triggers immediate oligo‐cellular Ca2+ signals in a dose‐dependent manner, which subsequently transform and propagate as trans‐cellular wave‐like signals (Knight et al, 1997; Choi et al, 2014; Köster et al, 2019; Steinhorst et al, 2022). These Ca2+ signals are sensed and decoded by the Ca2+ sensors SOS3/CBL4, CBL10/SCaBP8, and CBL8 (Ishitani et al, 2000; Kim et al, 2007; Quan et al, 2007; Steinhorst et al, 2022). These three CBL‐type Ca2+ sensors interact with and activate the serine/threonine protein kinase SOS2/CIPK24, which in turn phosphorylates and activates SOS1, a Na+/H+ exchanger that transports excess cytosolic sodium out of the cells (Halfter, 2000; Qiu et al, 2002; Kolukisaoglu et al, 2004; Kim et al, 2007; Quan et al, 2007; Quintero et al, 2011; Steinhorst et al, 2022). SOS1 has been reported to control xylem‐mediated long‐distance transport of Na+ (Shi et al, 2002), while HKT1‐like proteins are involved in unloading Na+ from the transpiration stream in the xylem and loading Na+ into the phloem of leaves (Berthomieu et al, 2003; Sunarpi et al, 2005; Horie et al, 2009). To minimize accumulation of Na+ in shoots during salt stress, the control of net Na+ loading into the xylem is as important as Na+/H+ exchanger‐mediated Na+ exclusion from roots and sequestration in root vacuoles (Ismail & Horie, 2017).
On the organ scale, radial fluxes of Na+ across the root that precede xylem‐loading and root‐to‐shoot Na+ transfer are influenced through formation of a diffusion barrier formed by specific lignin depositions building the endodermal Casparian strip (CS) in Arabidopsis (Barberon, 2017). This important facet of plant salt tolerance has been designated as transpiration‐dependent salt tolerance (TDST) through which withholding of apoplastic Na+ ions from entering the stele minimizes Na+ loading into the xylem and consequently prevents shoot Na+ accumulation (Jiang et al, 2012; Dinneny, 2015; Köster et al, 2019; Wang et al, 2022). Accordingly, loss‐of‐function mutants of the NADPH oxidase (NOX) RBOHF (Respiratory burst oxidase homolog F), which are impaired in reactive oxygen species (ROS) formation at the endodermis resulting in lack of CS formation, display a transpiration‐dependent salt sensitivity (Jiang et al, 2012). Precise timing and localization of CS formation is subject to complex control through manifold regulatory components including CASP (Casparian strip domain protein) and LOTR (Lord of the Ring) proteins and—like suberization as alternative cellular impregnation—is subject to modulation by environmental cues (Roppolo et al, 2011; Jiang et al, 2012; Barberon et al, 2016; Kalmbach et al, 2017; Wang et al, 2022). In line with the general and important role of receptor‐like kinases (RLKs) in sensing and transmitting extracellular environmental cues for regulating intracellular processes to govern plant defense, growth, and environmental cue‐induced developmental plasticity, the RLK FER (Feronia) confers sensing of salinity‐induced cell wall defects to elicit cell‐specific Ca2+ transients that maintain cell wall integrity during salt stress (Zipfel, 2008; Feng et al, 2018; Liang & Zhou, 2018). Also, CS Na+ barrier differentiation is controlled by a receptor kinase complex. A peptide‐RLK‐RLCK signaling module formed by extracellular CIF (Casparian strip integrity factor) binding to the plasma membrane RLK GSO1/SGN3 (GASSHO1/SCHENGEN3) results in RLCK PBL15/SGN1 (PBS1‐like 15/SCHENGEN1) activation for regulating CS formation and maintaining CS integrity (Pfister et al, 2014; Qi et al, 2014; Alassimone et al, 2016; Doblas et al, 2017; Nakayama et al, 2017; Okuda et al, 2020). Remarkably, the CIF1/2‐GSO1/SGN3‐PBL15/SGN1 module also activates the NOXs RBOHD and RBOHF for precision‐control of endodermal lignification and manifestation of TDST (Jiang et al, 2012; Han et al, 2019; Fujita et al, 2020). Recently, a detailed characterization of a lks4 (low‐K + ‐sensitive 4) mutant resulted in the surprising discovery that the same peptide‐RLK‐RLCK‐NOX module (here expanded by RBOHC) forms a bifurcating low‐K+ signaling axis that simultaneously confers HAK5 K+ uptake transporter induction and accelerated CS maturation to synchronize developmental differentiation with maintaining K+ homeostasis (Wang et al, 2021). Principally, GSO1 represents a multifunctional receptor‐like kinase. Originally, it has been identified (together with GSO2) as crucial determinant of embryonal epidermal differentiation and as critically controlling root epidermal cell fate and root apical meristem activity and size (Tsuwamoto et al, 2008; Racolta et al, 2014). More recently, peptide‐RLK modules involving GSO1 have been reported as conferring a two‐way endosperm‐embryo dialog, as promoting seedling cuticle formation, and as regulating cuticle integrity (Doll et al, 2020; De Giorgi et al, 2021; Zhang et al, 2022). However, a potential contribution of RLKs (besides FER) to plant salt tolerance has so far not been successfully addressed.
In this study, we identified an Arabidopsis loss‐of‐function mutant in the LRR‐RLK GSO1 as being hypersensitive to NaCl stress exposure. We discovered that GSO1 promotes cellular Na+ extrusion through SOS1 under salt stress conditions by phosphorylating and activating the kinase SOS2. GSO1‐dependent activation of SOS2 can occur independent of SOS3 Ca2+ sensor binding to this kinase suggesting a Ca2+‐independent but peptide signaling‐dependent activation input into the SOS pathway. Salt stress enhances expression of GSO1 preferentially in endodermal cells of the differentiation zone (DZ) and in the meristematic zone (MZ). Moreover, phosphorylation of Thr16 in SOS2 by GSO1 is essential to confer salt resilience of root growth and for preventing excessive accumulation of Na+ in xylem sap and leaf tissues. Collectively, our findings suggest that cell group‐specific GSO1‐directed activation of the SOS2‐SOS1 module interconnects developmental differentiation/proliferation with cellular detoxification to facilitate endodermal salt exclusion and meristem stem cell protection for optimized salt stress resilience.
Results
Loss of GSO1 function renders plants sensitive to salt stress
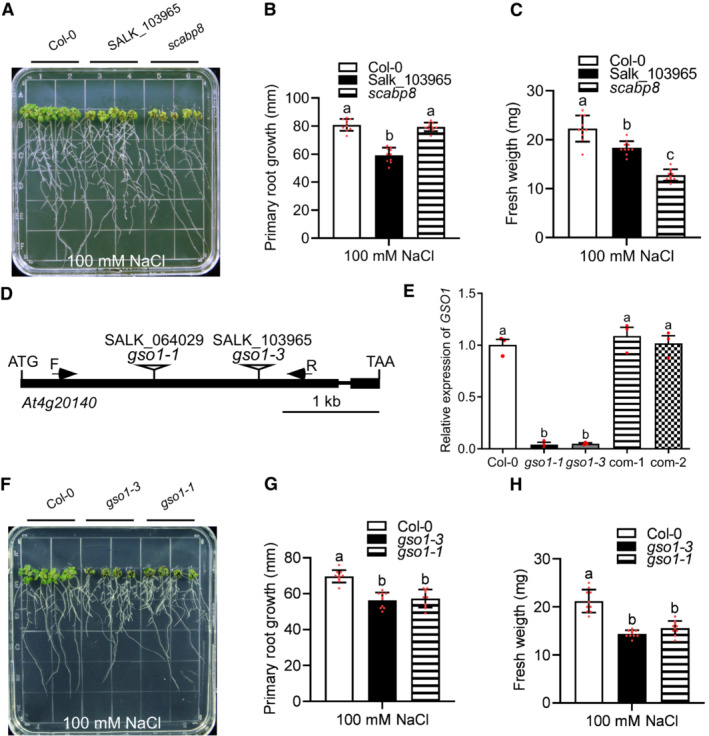
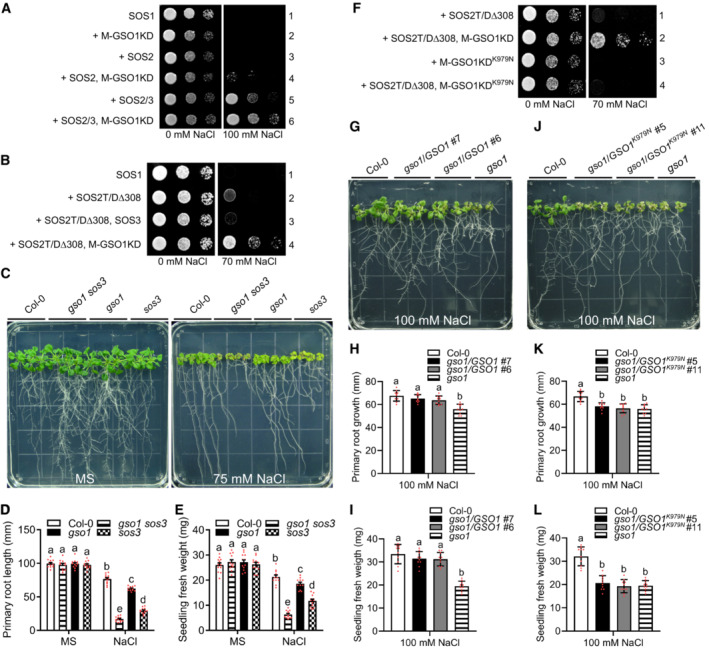
To identify RLKs potentially contributing to salt stress responses, we screened a collection of Arabidopsis mutants harboring T‐DNA insertions in RLK genes by scoring root elongation and/or leaf expansion in the presence of 100 mM NaCl. This approach identified one mutant line, SALK_103965, as displaying NaCl sensitive phenotypes (Fig EV1A–C). The mutant contained a T‐DNA insertion in the first exon of At4g20140, which encodes an LRR‐RLK protein that has been previously described as GSO1/SGN3 (Tsuwamoto et al, 2008; Pfister et al, 2014; Racolta et al, 2014). Hence, the new mutant allele was denoted gso1‐3 (Fig EV1D). We subsequently comparatively studied the gso1‐1 mutant allele (SALK_064029) and gso1‐3 on medium containing 100 mM NaCl and observed similar reduction of primary root growth and of seedling fresh weight of both alleles (Figs 1A–C and EV1F–H). qRT‐PCR analyses revealed no detectable GSO1 transcripts in gso1‐1 and gso1‐3 (Fig EV1E). To further confirm that these salt sensitive phenotypes were indeed associated with the loss of GSO1 function, a 5,718‐bp genomic DNA fragment spanning from 1,750 bp upstream of the GSO1 translation start codon to 143 bp downstream of the stop codon was expressed in gso1‐3 (Fig EV1E). Expression of GSO1 in gso1‐3 fully rescued salt tolerance to wild type levels in two independent T3 complementation lines (Fig 1A–C). These results establish that the NaCl sensitivity of gso1‐3 is due to loss of GSO1 function and suggest that GSO1 positively regulates salt tolerance in Arabidopsis.
Figure EV1. The SALK_103965 line harbors the T‐DNA insertion in GSO1 rendering these plants hypersensitive to salt stress.
-
A–CPhenotypes of indicated plant lines. Seedlings were grown on 1/2 MS medium for 6 days and then transferred to 1/2 MS medium with 100 mM NaCl for 7 days. Primary root length (B) and seedling fresh weight (C) of seedlings depicted in (A) were measured at day 7 after transfer (mean ± SEM, n = 10, P < 0.05, two‐way ANOVA).
-
DGene structure of At4g20140 (GSO1) (closed box: exon; line: intron; triangle, T‐DNA insertion site for indicated SALK lines).
-
EqRT‐PCR analyses of GSO1 expression in WT (Col‐0), two gso1 mutants and two independent complemented lines (com‐1, com‐2). UBQ10 was used as reference.
-
F–HPhenotypes of WT (Col‐0) and gso1 mutants. Seedlings were grown on 1/2 MS medium for 6 days and then transferred to 1/2 MS medium supplemented with 100 mM NaCl for 10 days. Primary root length (G) and seedling fresh weight (H) of seedlings depicted in (F) were measured at day 10 after transfer (mean ± SEM, n = 10, P < 0.05, one‐way ANOVA).
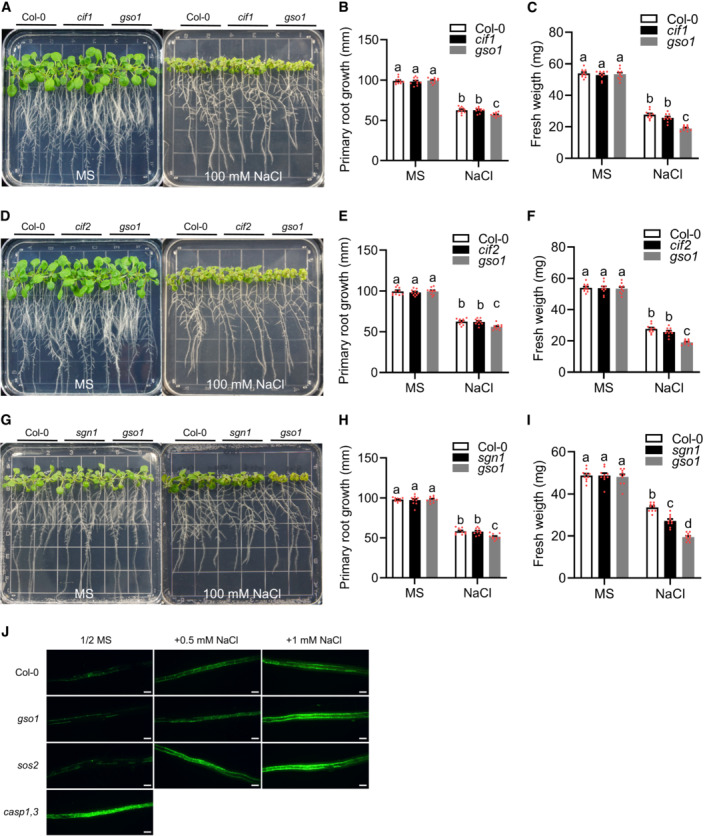
Figure 1. Arabidopsis gso1 mutants are hypersensitive to salt stress.
-
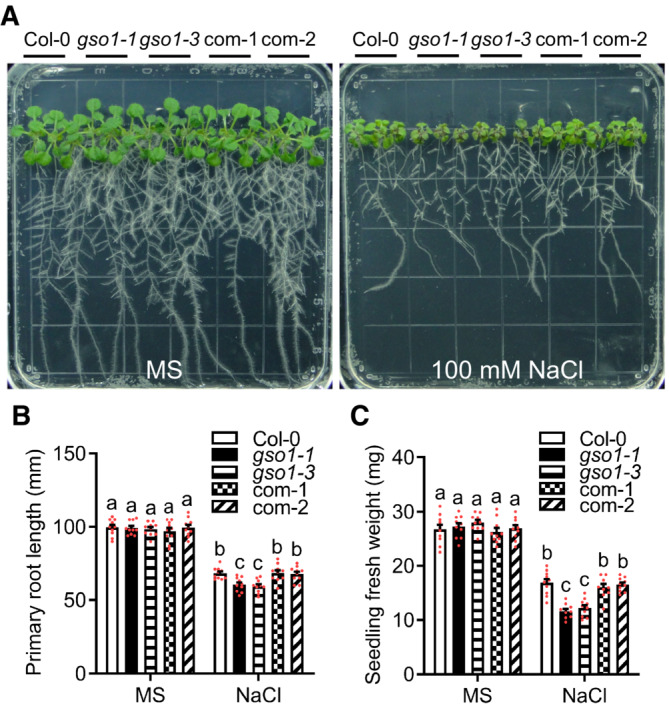
APhenotypes of WT (Col‐0), two gso1 mutant alleles (gso1‐1, gso1‐3) and two independent complementation lines (com‐1, com‐2). Seedlings were grown on 1/2 MS for 6 days and then transferred to 1/2 MS medium supplemented with or without 100 mM NaCl for 10 days.
-
B, CPrimary root length and seedling fresh weight of seedlings depicted in (A) were measured at day 10 after transfer (mean ± SEM, n = 10, P < 0.05, two‐way ANOVA).
Source data are available online for this figure.
GSO1 belongs to subfamily XI of RLKs, in which it forms a clade with its closely related (74% amino acid identity) homologous kinase GSO2 (Tsuwamoto et al, 2008). GSO1 and GSO2 have been reported to jointly function in embryo development and general root development (Tsuwamoto et al, 2008; Racolta et al, 2014). Therefore, two T‐DNA mutant lines harboring insertions in the GSO2 gene were acquired from the ABRC and tested for NaCl sensitivity. Both mutants, gso2‐1 (SALK_130637) and gso2‐2 (SALK_143123), in which the transcription of GSO2 was reduced to undetectable levels, exhibited a similar NaCl tolerance as wild type (Appendix Fig S1A–G). These results indicate that GSO1, but not GSO2, plays a major role in the salt response of Arabidopsis.
The RLK GSO1 interacts with the CIPK SOS2
To identify the downstream targets of GSO1, we generated plants expressing Pro35S:GSO1‐3Flag in gso1‐3. GSO1‐3Flag fusion protein was immunoprecipitated from plant extracts with anti‐Flag antibody‐conjugated agarose, and then putative interacting proteins were identified by mass spectrometry. The SOS2/CIPK24 protein kinase acting in the SOS pathway for salt tolerance was identified as potential GSO1‐interacting protein (Table EV1). This was the only CIPK protein identified in the GSO1 interactome.
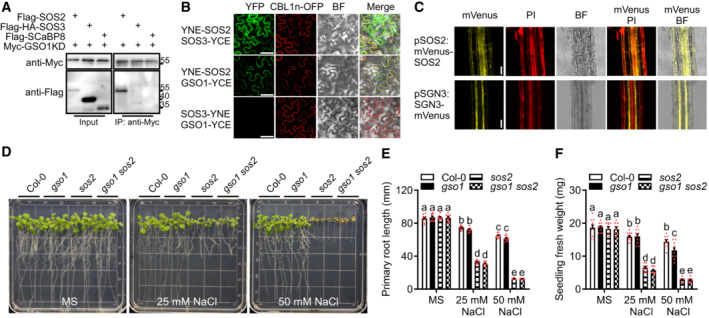
To further study the potential interaction between GSO1 and SOS2, we co‐transformed the intracellular kinase domain of GSO1 (Pro35S:6Myc‐GSO1KD, amino acids 900–1,249) with Pro35S:3Flag‐SOS2, Pro35S:3Flag‐3HA‐SOS3 or Pro35S:3Flag‐SCaBP8 constructs into Arabidopsis protoplasts. GSO1KD was immunoprecipitated with anti‐C‐Myc antibody‐conjugated agarose, and interacting proteins were detected using an anti‐flag antibody. This assay revealed that GSO1KD interacted with SOS2 but not with SOS3 or CBL10/SCaBP8 (Fig 2A). We further tested these interactions by performing bimolecular fluorescence complementation (BiFC) assays in Nicotiana benthamiana. YFP signals were observed at the plasma membrane when full‐length GSO1‐YCE was co‐expressed with YNE‐SOS2, while no YFP signal was detected upon co‐expression of GSO1‐YCE with SOS3‐YNE (Fig 2B). As a positive control, SOS2 and SOS3 interacted at the plasma membrane and in the cytosol.
Figure 2. GSO1 interacts with SOS2.
-
ACo‐IP of GSO1 and SOS2 using Arabidopsis protoplasts transiently expressing Myc‐GSO1KD (GSO1 kinase domain) and Flag‐SOS2, Flag‐HA‐SOS3 or Flag‐SCaBP8. Protein extracts were immunoprecipitated with anti‐Myc antibody and immunoblotted with anti‐Myc antibody or anti‐Flag antibody.
-
BBiFC analyses involving GSO1, SOS2, SOS3 in N. benthamiana. Scale bars: 50 μm. BiFC analyses of YNE‐SOS2 with SOS3‐YCE or GSO1‐YCE in N. benthamiana leaves. SOS3‐YNE co‐expressed with GSO1‐YCE as negative control. CBL1n‐OFP was co‐expressed as plasma membrane maker. Scale bars: 50 μm (BF: brightfield).
-
CHigh resolution localization analyses of SOS2 and GSO1 expressed under their respective native promoter at 1.5 mm from the quiescent center. Propidium iodide (PI) was used to stain the cell wall. Scale bars: 100 μm (BF: brightfield).
-
DPhenotypes of WT (Col‐0), gso1‐3, sos2‐2 and gso1‐3 sos2‐2. Seedlings were grown on 1/2 MS medium for 6 days and then transferred to 1/2 MS supplemented with or without extra NaCl for 10 days.
-
E, FPrimary root length and fresh weight of seedlings depicted in (D) were measured at day 7 after transfer (mean ± SEM, n = 10, P < 0.05, two‐way ANOVA).
Source data are available online for this figure.
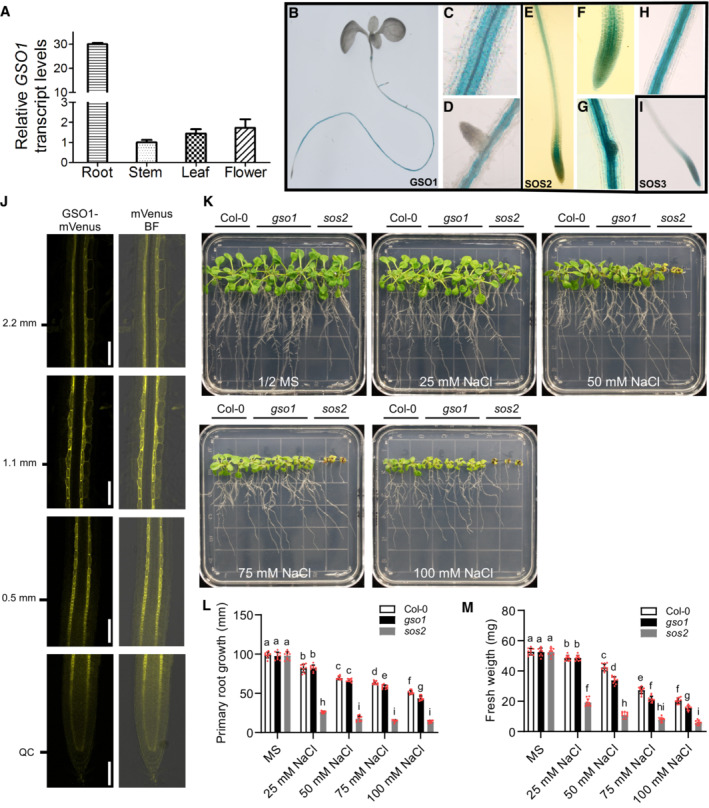
To verify that GSO1, SOS2, and SOS3 are indeed present in the same cells/tissues in planta, we studied their expression pattern. SOS2 mRNA has been reported to be expressed in both, shoot and root tissues, whereas SOS3 is mainly expressed in roots (Liu et al, 2000; Quan et al, 2007). While SOS3 expression was not enhanced by salt stress, the transcript accumulation of SOS2 was increased in seedlings and roots upon salt exposure (Liu et al, 2000; Quan et al, 2007). Real‐time RT‐PCR analysis revealed high levels of GSO1 expression in roots but much lower transcript accumulation in leaves, stems and flowers (Fig EV2A). We further corroborated the expression pattern of these genes by comparative promotor‐GUS fusion expression analyses. To this end, the promoter region of GSO1 (1.8 kb upstream from translational start site) was fused to the β‐glucuronidase (GUS) reporter gene. The resulting construct, ProGSO1:GUS, was transferred into wild‐type Arabidopsis plants. Three independent transgenic lines were analyzed, and they all displayed the same tissue‐specific pattern of GSO1 expression. As shown in Fig EV2B–D, the GUS expression driven by the GSO1 promoter was detected in the root and was particularly strong in the stele and endodermis, but also clearly discernable in cortex and epidermis. This expression pattern in roots resembled the GUS signal pattern observed in plants expressing SOS2 promoter reporter constructs (Fig EV2E–H). SOS3 was only expressed in roots, and here expression was predominantly detected in all cell layers from the meristem up to the early differentiation zone, a pattern that is consistent with a previous report (Fig EV2I) (Quan et al, 2007). These results suggest that all three genes display an overlapping expression pattern.
Figure EV2. GSO1 expresses in specific cell files of the root and contributes to salt stress tolerance.
-
AqRT‐PCR analyses of GSO1 expression. Total RNA was extracted from roots, stems, leaves, and flowers. Actin2 was used as reference.
-
B–DGUS activity under the promoter of GSO1 indicated by blue color.
-
E–HpSOS2‐driven GUS activity.
-
IpSOS3‐driven GUS activity.
-
JLocalization analyses of GSO1‐mVenus in the root. ClearSee treatment was used to improve the detection. Scale bars: 100 μm.
-
K–MPhenotypes of WT (Col‐0), gso1‐3 and sos2‐2. Seedlings were grown on 1/2 MS medium for 6 days and then transferred to 1/2 MS medium supplemented with or without the indicated concentrations of NaCl for 10 days. Primary root length (L) and seedling fresh weight (M) were measured at day 10 after transfer (mean ± SEM, n = 10, P < 0.05, two‐way ANOVA).
We were, however, particularly interested in determining the protein expression pattern of these genes, which had not been determined for SOS2, previously. Here, we focused on SOS2 and GSO1 since they are in the center of this study. To this end, we generated transgenic plant lines expressing SOS2 under control of its own promotor (1,569 bp upstream of the ATG; Quan et al, 2007) and fused to mVenus (pSOS2:mVenus‐SOS2). High resolution confocal microscopic analyses revealed a readily detectable ubiquitous expression of SOS2 in all cell layers of the root (Fig 2C). We also re‐examined the expression pattern of published pSGN3:SGN3‐mVenus (Doblas et al, 2017; Wang et al, 2021). Microscopic inspection indicated a generally lower level of GSO1 accumulation as compared to SOS2 (Fig 2C). GSO1 protein accumulation was most abundant in the endodermis, but also clearly detectable in cortex and epidermis. This multi‐cell‐layer expression of GSO1 became more obvious after ClearSee treatment of the roots (Fig EV2J), which further corroborated the expression pattern of GSO1 and thereby established that the expression pattern of SOS2 and of GSO1 also overlap on the protein level. Collectively, the results of these complementary analyses establish that the RLK GSO1 physically interacts with the CIPK SOS2.
To further investigate the potential genetic interaction between GSO1 and SOS2, gso1‐3 sos2‐2 double mutants were generated, and their salt sensitivity was compared to that of individual mutants. In these assays, gso1‐3 displayed discernable shoot expansion phenotypes compared to wild type beginning from NaCl concentrations of 50 mM, though less severe than of sos2‐2 (Fig EV2K–M). On 100 mM NaCl medium, the shoot growth inhibition of gso1‐3 was more pronounced. Considering the extreme NaCl hypersensitivity of sos2‐2, we studied the phenotypes of gso1‐3 sos2‐2 on media containing 25 and 50 mM NaCl (Fig 2D–F). While gso1‐3 sos2‐2 did not exhibit discernable growth differences compared to wild type on media without NaCl supplementation, gso1‐3 sos2‐2 and sos2‐2 displayed a similar reduction of root and shoot growth on media containing 25 or 50 mM NaCl (Fig 2D and E). These results indicate that combined loss of SOS2 and GSO1 function does not cause enhanced salt sensitivity compared to sos2‐2 suggesting that GSO1 likely represents an upstream signal input for SOS2.
GSO1 kinase activity enhances SOS1 function independently of SOS3 and is essential for conferring completive salt tolerance in plants
Having established that GSO1 is a positive effector of salt tolerance in Arabidopsis and that GSO1 interacts with SOS2, we next used a SOS pathway reconstitution system in the yeast S. cerevisiae, to further delineate the role of GSO1 in regulating the activity of the SOS1 Na+/H+ antiporter (Quintero et al, 2011, 2002). We used the yeast strain JP837 lacking all major yeast Na+ transport systems and expressing a genomic insertion of Arabidopsis SOS1 cDNA (Quintero et al, 2002). To avoid potential mis‐sorting of full‐length GSO1 by the LRR domain while efficiently locating GSO1 at yeast membranes, we fused the cytosolic kinase domain of GSO1 (GSO1KD) to the N‐myristoylation motif (M) of SOS3 (MGCSVSK) to create M‐GSO1KD (Ishitani et al, 2000; Villalta et al, 2021). We confirmed that addition of this myristoylation motif did not affect the ability of GSO1 to interact with SOS2 (Appendix Fig S2A and B). The observed growth pattern of yeast expressing various combinations of SOS1, SOS2, and SOS3 on salt stress imposing media were consistent with previous findings (Fig 3A; Appendix Fig S2C) (Quintero et al, 2002). Transformation of SOS2 alone did not confer yeast growth on media with 100 mM NaCl indicating neglectable activation of SOS1. In contrast, co‐transformation SOS2 and SOS3 dramatically increased the Na+ efflux activity of SOS1 as revealed by effective yeast growth on media supplemented with 100 mM NaCl. Co‐expression of SOS2 and M‐GSO1KD increased salt tolerance to a higher level than expression of SOS2 alone. Concurrent expression of SOS2 and SOS3 with M‐GSO1KD further increased the salt tolerance of the yeast strain compared to yeast expressing SOS2 and SOS3 (Fig 3A). These results indicate that GSO1 can enhance the activity of the plant SOS pathway in yeast.
Figure 3. GSO1 kinase activity is essential for plant salt tolerance and activates SOS2 independent of SOS3.
-
AYeast strain JP837 cells transformed with empty vectors (control) or the indicated combinations of Arabidopsis genes were grown on AP medium supplemented with or without 100 mM NaCl for 3 days at 28°C (M: myristoylation motif, KD: kinase domain).
-
BYeast strain JP837 cells transformed with the indicated combinations of genes were grown on AP medium supplemented with or without 75 mM NaCl for 4 days at 28°C (SOS2T/DΔ308: constitutively active form SOS2, M: myristoylation motif, KD: kinase domain).
-
CPhenotypes of WT (Col‐0), gso1‐3, sos3 and gso1‐3 sos3 grown on 1/2 MS medium for 6 days and then transferred to 1/2 MS medium supplemented with or without 75 mM NaCl for 10 days.
-
D, EPrimary root length and fresh weight of seedlings depicted in (C) were measured at day 10 after transfer (mean ± SEM, n = 12, P < 0.05, two‐way ANOVA).
-
FYeast strain JP837 cells expressing SOS2T/DΔ308 were transformed with M‐GSO1KD or M‐GSO1KDK979N and grown on AP medium as in (B).
-
G–LPhenotypes, primary root length and seedling fresh weight of indicated plant lines grown on 1/2 MS medium for 6 days and then transferred to 1/2 MS medium supplemented with 100 mM NaCl for 7 days (mean ± SEM, n = 10, P < 0.05, one‐way ANOVA).
Source data are available online for this figure.
To test whether SOS3 is essential for the functional interaction of GSO1 and SOS2 and for activation of the SOS2‐SOS1 module in yeast, we expressed the SOS2T/DΔ308 (SOS2T168DΔ308) protein, which is a SOS3‐independent and hyperactive form of SOS2 that lacks the C‐terminal auto‐inhibitory domain (Guo et al, 2001, 2004). Although the expression of SOS2T/DΔ308 alone enhanced SOS1 activity, the co‐expression of M‐GSO1KD significantly increased the salt tolerance conveyed by SOS2T/DΔ308‐SOS1, and SOS3 had no effect on the output (Fig 3B; Appendix Fig S2D). These results suggest that interaction of SOS3 with SOS2 is not required for activation of SOS2 by GSO1 and for conferring SOS2 activity towards the Na+/H+ exchanger SOS1.
We therefore sought to further investigate the potential SOS3‐independence of GSO1‐mediated SOS2 activation by a genetic approach in planta. To this end, gso1‐3 sos3 double mutants were generated and their salt tolerance was determined in assays combining WT, gso1‐3, sos3, and gso1‐3 sos3 (Fig 3C–E). No differences in root growth and fresh weight were discernable between any of these plant lines in the absence of salt stress. However, when exposed to 75 mM NaCl, gso1‐3 sos3 displayed a clearly more severe salt sensitivity than gso1‐3 and sos3 as indicated by reduction of both, fresh weight, and root growth (Fig 3C–E). This genetic additivity of salt sensitivity is in stark contrast to the observed non‐additivity of salt sensitivity in gso1‐3 sos2‐2 (Fig 2D–F). Collectively, the results of these yeast and in planta analyses support the conclusion that GSO1 can exert its function in regulating SOS2/CIPK24 for conferring salt tolerance independently of the Ca2+ sensor SOS3/CBL4. This conclusion does of course not exclude that GSO1 enhances the activity of already assembled SOS3‐SOS2 complexes as it is suggested by superior salt tolerance of yeasts co‐expressing GSO1, SOS2, and SOS3. This further enhancement of SOS2 activity by GSO1 may result from released SOS2 self‐inhibition upon SOS3 binding.
To address the role of GSO1 kinase activity for the activation of the SOS2‐SOS1 module, yeast cells co‐expressing SOS1 and the hyperactive and SOS3‐independent kinase SOS2T/DΔ308 were transformed with M‐GSO1KD or M‐GSO1KDK979N (a kinase‐dead version of GSO1) (Fig 3F; Appendix Fig S2B and E). Compared to M‐GSO1KD, the dead kinase M‐GSO1KDK979N could not enhance SOS2T/DΔ308‐SOS1 module activity (Fig 3F; Appendix Fig S2F). Since the intracellular kinase domains of GSO1 and GSO2 are rather well conserved, we also tested a yeast‐adapted GSO2 (M‐GSO2KD) version in this assay system. In contrast to M‐GSO1KD, the equivalent construct M‐GSO2KD did not activate the SOS2T/DΔ308‐SOS1 module, further corroborating the specificity of GSO1 function towards SOS2 (Appendix Fig S2G). Together, these data suggest the specific and necessary requirement of GSO1 kinase activity for conferring SOS2 activation.
We next sought to address the necessity of GSO1 kinase activity for plant salt tolerance directly in transgenic plants. To this end, we either overexpressed WT GSO1 or GSO1K979N in gso1‐3 and assayed root growth and fresh weight as indicators of salt tolerance (Fig 3G–L). While overexpression of WT GSO1 rescued root growth and fresh weight to wild type values, overexpression of GSO1K979N did not result in restored salt tolerance. These results indicate that also in planta kinase activity of GSO1 is crucial for SOS2 activation and consequently for conferring the GSO1‐dependent contribution to plant salt tolerance.
GSO1 phosphorylates and activates SOS2
We next investigated if GSO1 directly phosphorylates SOS2 and how this impacts on SOS2 activity. In vitro phosphorylation assays revealed that GSO1KD efficiently phosphorylated SOS2, whereas the kinase‐dead version GSO1KDK979N did not (Fig 4A). Conversely, GSO1 could not be phosphorylated by SOS2. Moreover, when we first incubated either GSO1KD or GSO1KDK979N together with SOS2 in the kinase reaction for 30 min to allow for SOS2 phosphorylation and then added SOS1C300 as substrate, we observed strongly enhanced phosphorylation of SOS2 and SOS1C300 by GSO1KD compared to the degree of phosphorylation in reactions containing GSO1KDK979N (Appendix Fig S3A). Notably, GSO1KD did not phosphorylate SOS1C300 directly (Appendix Fig S3B). These results establish that GSO1 directly phosphorylates SOS2 in vitro and suggest that this results in enhanced SOS1 substrate phosphorylation through SOS2.
Figure 4. GSO1 phosphorylates SOS2 at Thr16.
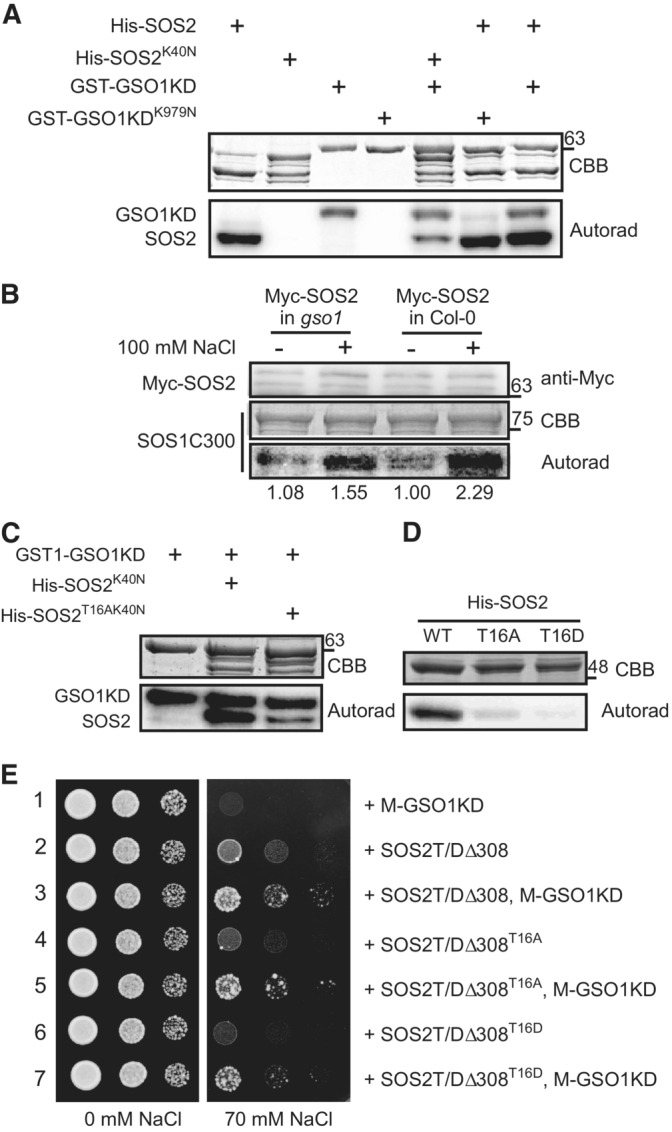
- Coomassie Brilliant Blue stain (CBB) and autoradiograph of in vitro kinase assay combining the indicated combinations of SOS2/SOS2K40N and GSO1KD/GSO1KDK979N.
- Immunoblot using anti‐Myc antibody and CBB and autoradiograph from kinase assays combining Myc‐SOS2 with SOS1C300 as substrate. Ten‐day‐old seedlings stably expressing Pro35S:6Myc‐SOS2 in Col‐0 or gso1‐3 were treated with or without 100 mM NaCl for 12 h, and Myc‐SOS2 protein immunoprecipitated with anti‐C‐Myc antibody‐conjugated agarose from roots was used in the assays. Signal strength of the phosphorylation bands has been calculated relative to the left lane.
- CBB and autoradiograph of in vitro kinase assays combining GSO1KD (kinase domain) with SOS2K40N or SOS2T16AK40N.
- CBB and autoradiograph of in vitro kinase assays using SOS2 p‐site variants addressing autophosphorylation activity.
- Yeast strain JP837 cells expressing SOS1 plus the indicated combinations of genes were grown on AP medium supplemented with or without 70 mM NaCl for 4 days at 28°C (SOS2T/DΔ308: constitutively active form SOS2, M: myristoylation motif, KD: kinase domain).
Source data are available online for this figure.
In plants, the activity of the SOS2 kinase is upregulated by salt stress (Lin et al, 2009; Zhou et al, 2014). To address the potential role of GSO1 for salt stress‐induced activity enhancement of SOS2 in planta, we assayed the kinase activity of SOS2 in gso1‐3 and WT before and after a salinity treatment. To this end, wild‐type and gso1‐3 plants were transformed with a Pro35S:6Myc‐SOS2 construct (Quan et al, 2007). Noteworthy, GSO1 is strongly expressed in roots but only marginally expressed in shoots, suggesting that GSO1 mainly functions in roots (Fig EV2A). Hence, Myc‐SOS2 was immunoprecipitated from root protein extracts from homozygous T3 plants. Subsequently, Myc‐SOS2 was incubated with a C‐terminal fragment of SOS1 that includes the SOS2 phosphorylation site as kinase substrate. SOS2 kinase activity was induced by salt stress in root extracts of wild type and the gso1‐3 mutant, albeit a weaker SOS2 activity was evident in gso1‐3 mutant compared to wild type (Fig 4B). To address whether the kinase activity of GSO1 also responds to salt stress, GSO1‐3Flag transgenic plants were treated with or without NaCl for 12 h, and GSO1‐3Flag was immunoprecipitated and incubated with MBP as generic substrate. This experiment revealed enhanced phosphorylation of MBP through GSO1 as consequence of salt stress exposure (Appendix Fig S3C). Together, these results indicate that GSO1 phosphorylates and activates SOS2 in planta and also suggest that salt stress enforces GSO1 activity.
To determine the target phosphorylation site(s) of GSO1 within SOS2, we purified recombinant full‐length SOS2 after phosphorylation by GST‐GSO1KD. Phosphorylation of Thr16 was identified by mass spectrometry (Appendix Fig S3D). Moreover, the peptide containing pThr16 was much more abundant than any other phosphorylated peptide (Table EV2). To further confirm this phosphorylation site, we mutated SOS2T16 to alanine (SOS2T16A) or to aspartate (SOS2T16D). In addition, the SOS2T16A mutation was combined with the dead‐kinase K40N mutation (SOS2K40N) to abrogate in vitro autophosphorylation of SOS2. SOS2T16A/K40N mutations significantly reduced but did not completely suppress the phosphorylation of SOS2 by GSO1 (Fig 4C). These results indicate that Thr16 of SOS2 represents the major phosphorylation site addressed by GSO1, although additional minor GSO1 target sites may exist in SOS2 at least in vitro. We next tested whether and how the phosphorylation status of Thr16 affects SOS2 activity. Both SOS2T16A and SOS2T16D mutations significantly reduced SOS2 kinase auto‐phosphorylation and trans‐phosphorylation (Fig 4D; Appendix Fig S3E). We suspect that the SOS2T16D version could not successfully mimic the phosphorylation status of SOS2. To further investigate the effect of Thr16 phosphorylation on SOS2 kinase activity, the yeast strain JP837 expressing SOS1 was transformed with SOS2T/DΔ308, SOS2T/DΔ308T16A and SOS2T/DΔ308T16D. Both SOS2T/DΔ308T16A and SOS2T/DΔ308T16D displayed reduced activity towards SOS1 compared to SOS2T/DΔ308, consistent with their reduced kinase auto‐phosphorylation activity in vitro (Fig 4E; Appendix Fig S3F). Co‐expression of M‐GSO1KD with SOS2T/DΔ308T16A or SOS2T/DΔ308T16D in JP837 resulted in enhanced yeast growth under salt stress conditions compared to yeast expressing SOS2T/DΔ308 alone (Fig 4E). This activation in yeast might be a consequence of other GSO1 phosphorylation site(s) in SOS2 or may result from enhanced plasma‐membrane recruitment through the interaction with M‐GSO1KD. Nevertheless, these results establish, that the phosphorylation status of Thr16, which is determined by GSO1, modulates the activity of SOS2.
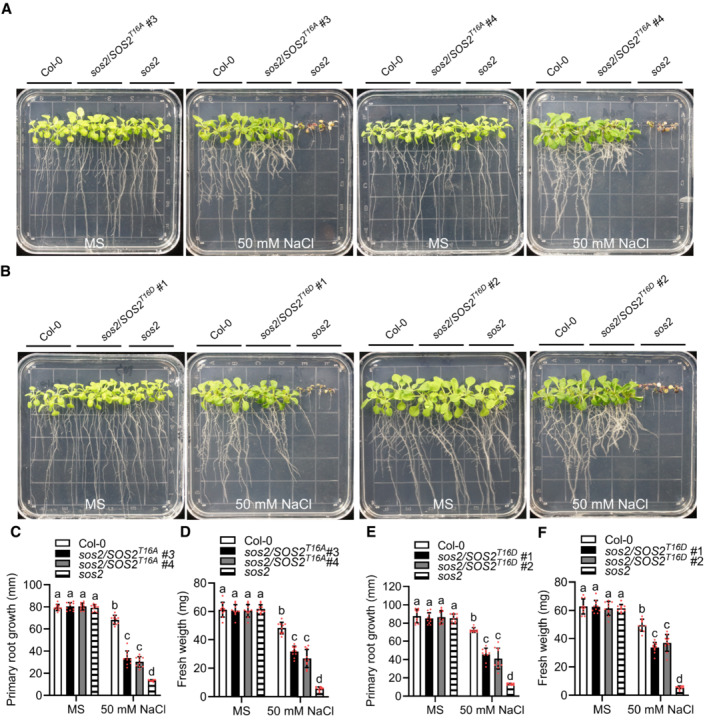
We then generated plants overexpressing Pro35S:6Myc‐SOS2 T16A or Pro35S:6Myc‐SOS2 T16D in sos2‐2 and assayed them for their salt sensitivity. Consistent with the results of the in vitro kinase assay, both, the T16A and the T16D versions of SOS2 only partially complemented the salt sensitivity of sos2‐2 (Fig EV3A–F). Considering that the T16D version likely does not represent an effective phospho‐mimicking substitution, the results of these in planta experiments conceivably support the notion that GSO1‐mediated phosphorylation of SOS2 at Thr16 brings about activation of this kinase.
Figure EV3. Analysis of salt sensitivity of SOS2 T16 p‐site mutants in planta .
-
A–FPhenotypes of Col‐0, sos2‐2, SOS2T16A #3 and SOS2T16A #4 (A), SOS2T16D #1 and SOS2T16D #2 (B). Seedlings were grown on 1/2 MS medium for 6 days and then transferred to 1/2 MS medium with or without 50 mM NaCl for 10 days. Primary root length (C and E) and seedling fresh weight (D and F) of seedlings at day 10 after transfer (mean ± SEM, n = 10, P < 0.05, two‐way ANOVA).
A dual function of GSO1 in salt‐induced Casparian strip development and SOS pathway activation
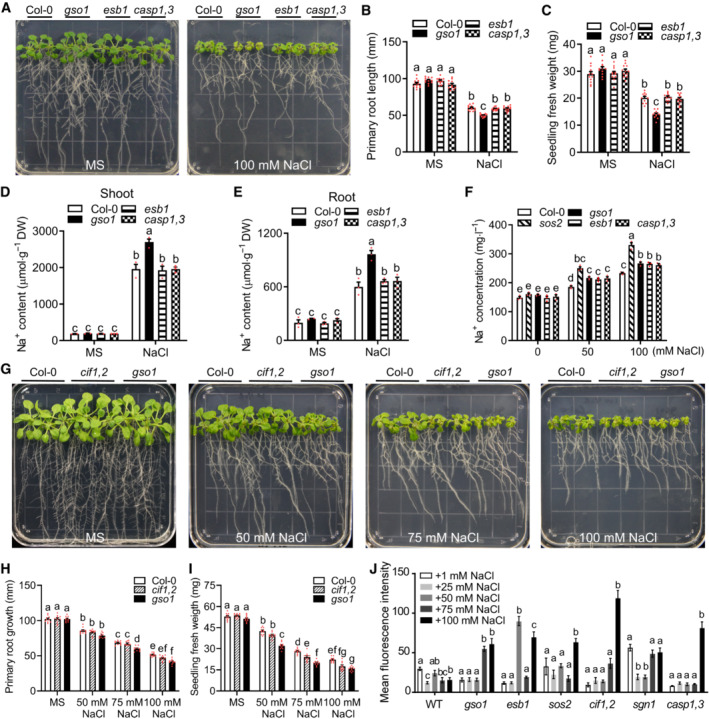
The Casparian strip (CS) is a crucial determinant of transpiration‐dependent salt tolerance (TDST), in that it reduces/prevents the transpiration stream‐driven apoplastic flux of Na+ ions from the root ground tissue into the vasculature to prevent transport of these toxic ions into the shoot (Dinneny, 2015; Köster et al, 2019). Accordingly, mutants of genes like RBOHF and ESBL, which are, like gso1‐3, impaired in CS‐formation, display salt‐sensitive phenotypes especially under conditions of high transpiration (Jiang et al, 2012; Wang et al, 2022). The SOS pathway (SOS3‐SOS2‐SOS1) does not contribute to TDST (Jiang et al, 2012). In order to differentiate if the salt sensitivity of gso1‐3 results from its impact on TDST or on the SOS pathway or on both, we comparatively studied the salt sensitivity of gso1‐3 and of esb1, and casp1 casp3, which share with gso1‐3 the phenotype of incomplete (interrupted) formation of the CS under conditions of low transpiration (Roppolo et al, 2011; Hosmani et al, 2013; Barberon, 2017). These assays revealed no differences in salt tolerance as determined by fresh weight and root growth between WT, esb1, and casp1 caps3 (Fig 5A–C). We moreover determined the Na+ content of WT, gso1‐3, esb1, and casp1 casp3 seedlings. On ½ MS medium, all four analyzed genotypes displayed similar Na+ accumulation in root and shoot tissues (Fig 5D and E). On media supplemented with 100 mM NaCl, only gso1‐3 accumulated significantly more Na+ in both, shoots and roots, compared to WT, esb1, and casp1 casp3, with the latter three genotypes showing similar Na+ content (Fig 5D and E). To investigate how interrupted CS formation may affect ion transport from root to shoot, we compared the Na+ content in the xylem sap of WT, gso1‐3, esb1, and casp1 casp3 in soil and included sos2‐2 as control (Fig 5F). Without additional Na+ supply, all four lines exhibited similar concentrations of xylem Na+. As consequence of NaCl treatment, sos2‐2 displayed by far the highest level of Na+ concentration, a finding in line with the crucial role of Na+ extrusion for plant salt tolerance. Compared to WT, also gso1‐3 and casp1 casp3 displayed enhanced xylem sap Na+ accumulation and this increase was identical in both mutants (Fig 5F). These results confirm that both, gso1‐3 and casp1 casp3 are similarly impaired in protecting the xylem from Na+ accumulation as consequence of their defective CS. However, considering that only gso1‐3 but not casp1 casp3 displays reduced shoot and root growth under salt stress, these results collectively suggest that the salt‐sensitive phenotype of gso1‐3 observed in our assays is not primarily a consequence of impaired CS formation.
Figure 5. GSO1 dually functions in Casparian strip development and salt stress tolerance/SOS pathway activation.
-
APhenotypes of WT (Col‐0), gso1‐3, esb1, and casp1 casp3. Seedlings were grown on 1/2 MS for 6 days and then transferred to 1/2 MS medium with or without 100 mM NaCl for 10 days.
-
B, CPrimary root length and seedling fresh weight of seedlings depicted in (A) were measured at day 10 after transfer (mean ± SEM, n = 12, two‐way ANOVA, P < 0.05).
-
D, ENa+ content in roots and shoots of the indicated genotypes. Seedlings were grown on 1/2 MS medium for 6 days and then transferred to 1/2 MS medium with or without 100 mM NaCl for 8 days (DW: dry weight, mean ± SEM, n = 3, P < 0.05, two‐way ANOVA).
-
FNa+ content of xylem sap of indicated genotypes. Seedlings were grown in soil for 2 weeks and then treated with 1/2 MS medium or 1/2 MS medium supplemented with NaCl for 1 day (mean ± SEM, n = 3, P < 0.05, two‐way ANOVA).
-
GPhenotypes of WT (Col‐0), cif1 cif2, and gso1‐3. Seedlings were grown on 1/2 MS medium for 6 days and then transferred to 1/2 MS medium supplemented with or without 100 mM NaCl for 10 days.
-
H, IPrimary root length and seedling fresh weight of seedlings depicted in (A) were measured at day 10 after transfer (mean ± SEM, n = 10, P < 0.05, two‐way ANOVA).
-
JQuantification of Fluorol Yellow fluorescence intensity indicating amounts of suberin accumulation in maximum projections of z‐stacks in the first mm of the continuously suberized endodermis in the indicated genotypes. Seedlings were grown on 1/2 MS for 5 days and then treated with the indicated NaCl concentrations for 2 days (mean ± SEM, n = 3–5, P < 0.05, one‐way ANOVA and post hoc Tukey Kramer test, different letters indicate significant difference).
Source data are available online for this figure.
The RLK GSO1/SGN3 is activated by its peptide ligands CIF1 and CIF2 to drive spatially defined lignin deposition via phosphorylation‐mediated activation of RBOHF and RBOHD through the RLCK SGN1/LKS4 (Fujita et al, 2020; Wang et al, 2021). To further dissect the role of GSO1 in TDST and in SOS pathway‐dependent salt tolerance (SDST), we also comparatively studied the phenotypes of WT and of cif1, cif2, cif1 cif2, gso1‐3, and sgn1 over a range of NaCl concentrations. Both, cif1 and cif2 were indistinguishable from WT in all studied parameters further confirming their joint function in the Schengen pathway (Figs 5G–I and EV4A–I). Remarkably, this approach allowed us to further differentiate the individual contributions of the investigated regulatory components to both facets of salt tolerance. With regard to root growth, which reflects meristem activity, only gso1‐3 but not any of the other mutants displayed a reduction (compared to WT) beginning from 75 mM NaCl that was further exacerbated at 100 mM NaCl (Figs 5G–I and EV4A, B, D, E, G and H). With regard to shoot fresh weight, all three mutants were to some extend stronger affected by salt stress than WT. However, for gso1‐3, fresh weight reduction became discernible at 50 mM NaCl and became further pronounced with increasing NaCl concentrations. In contrast, cif1 cif2 and sgn1 displayed fresh weight reduction only at concentrations of 75 mM NaCl or higher (Figs 5G–I and EV4A, C, D, F, G and I). On media containing 100 mM NaCl, the fresh weight reduction of gso1‐3 was more substantial than that of cif1 cif2 and sgn1. We suggest that the most parsimonious interpretation of these observations is that CIF1/CIF2, GSO1, and SGN1 all function in TDST and that this becomes apparent by the reduced fresh weight of the respective mutants as consequence of salt stress exposure. In addition, only GSO1 has an additional function in salt tolerance as it is evidenced by the stronger fresh weight phenotype of gso1‐3 and, most importantly, by its exclusive salt stress‐induced root growth reduction that is not shared by cif1 cif2 and by sgn1. We propose that this additional function of GSO1 in salt tolerance is the activation of the SOS2‐SOS1 module.
Figure EV4. GSO1 functions in endodermis development and salt tolerance.
-
A–IPhenotypes of WT (Col‐0), gso1‐3, cif1 (A), cif2 (D), and sgn1 (G). Seedings were grown on 1/2 MS medium for 6 days and then transferred to 1/2 MS medium supplemented with or without 100 mM NaCl for 10 days. Primary root length (B, E and H) and seedling fresh weight (C, F, and I) of seedlings depicted in (A) at day 10 after transfer (mean ± SEM, n = 10, P < 0.05, two‐way ANOVA).
-
JFluorol yellow staining of suberin in roots. WT (Col‐0), gso1‐3, sos2‐2 and casp1 casp3 were grown on 1/2 MS medium with or without NaCl for 5 days and the suberin amount in the DZ was analyzed. Scale bars: 50 μm.
Besides lignification, also suberization of the endodermis has been implicated as mechanism protecting plants from salt stress (Van Zelm et al, 2020). Recently, already micromolar concentrations of NaCl have been shown to trigger accelerated formation of continuous suberization suggesting that also in natural non‐saline soils plants exhibit some level of induced suberization (Barberon et al, 2016). While some CS mutants including esb1 and casp1 casp3 exhibit compensatory over‐suberization already in normal growth conditions, this feature is not shared by cif1 cif2, sgn1, and gso1‐3 mutants (Barberon, 2017). Soils are generally considered as saline, if they contain at least 40 mM NaCl (Marschner, 1995; Manishankar et al, 2018). To resolve if this lack of compensatory suberization may contribute to the observed salt sensitivity of gso1‐3, we analyzed the suberization of an informative suite of mutants in response to saline conditions.
To this end, we first compared the extent of suberin deposition in the section of already fully developed continuous suberization (around 20 mm from the root tip) of WT, gso1‐3, sos2‐2, and casp1 casp3 at very low NaCl concentrations (1/2 MS, 0.5 mM and 1 mM NaCl) by using a Fluorol‐Yellow088 (FY088) staining protocol. As expected, casp1 casp3 already displayed enhanced suberization in the absence of additional NaCl in the media, while WT, sos2‐2, and gso1‐3 displayed similarly low extent of suberization (Fig EV4J). Application of 0.5 mM or 1 mM NaCl efficiently induced suberin deposition to a similar extent in WT, sos2‐2, and gso1‐3. We next performed a more comprehensive quantitative suberin accumulation analysis at the root zone where continuous suberization begins (15 mm from the root tip). These assays included WT, gso1‐3, esb1, sos2‐2, cif1 cif2, sgn1/lks4 and casp1 casp3 at saline concentrations of 25, 50, 75, and 100 mM NaCl (Fig 5J; Appendix Fig S4). In control conditions, all lines displayed a rather similar level of suberin accumulation in their continuously suberized differentiation zone. In WT, this suberin accumulation did not change over the range of tested NaCl concentrations. In sharp contrast, beginning from 75 mM NaCl, we observed a strong increase in FY088 fluorescence indicative for enhanced suberin accumulation in cif1 cif2, gso1‐3, and sgn1. A similar suberin accumulation response was observed in casp1 casp3 challenged with 100 mM NaCl. These results suggest that impairment of CS formation and/or interruption of the Schengen signaling pathway in cif1 cif2, gso1‐3, sgn1 and casp1 casp3 specifically triggers an enhanced suberin deposition on the already continuously suberized endodermis in response to salt stress that likely represents a protective mechanism that is not triggered in WT at this stress intensity.
We next studied the zonation response of suberization—meaning in which distance from the root tip patchy or continuous suberization manifests in WT and in these mutants. Specifically, we investigated if a salinity stress (as imposed by 75 and 100 mM NaCl) triggers a further acceleration of formation of continuous suberization on top of the acceleration that is already triggered by 1 mM NaCl. As expected, the already fully expanded continuous suberization zone was not further modulated in casp1 casp3 and no zone of patchy suberization was observed (Appendix Fig S5). In contrast, we identified a further accelerated formation of continuous suberin in WT at 75 and 100 mM NaCl that resulted in the absence of a patchy suberization zone (Appendix Fig S5). Also, in cif1 cif2, gso1‐3, and sgn1, we observed expansion of continuous suberin deposition towards the root tip that became most pronounced at 100 mM NaCl while at 75 mM NaCl the zonation pattern of suberin deposition remained largely unchanged compared to the pattern observed at 1 mM NaCl (Appendix Fig S5). Collectively, these findings reveal that physiologically relevant salinity stress further accelerates the maturation of the suberization shield on the endodermis in WT and imply that the Schengen pathway constituted by CIF1/CIF2‐GSO1‐SGN1 fulfills a crucial function in implementing this response. However, since cif1 cif2, gso1‐3, and sgn1 display rather similar impairment of this zonation response that does not correlate with the different degree of salt sensitivity of these mutants, these data also argue against a role of differential suberization as cause for the observed salt sensitivity of gso1‐3. In summary, the combined outcome of our phenotypical and histochemical investigations identifies a crucial role of GSO1 as activator of the SOS pathway and thereby define GSO1 as dual functioning kinase that contributes to accelerated endodermis modification and Na+ detoxification in conditions of excess NaCl exposure.
Specific salt‐induced accumulation of GSO1 in the differentiation zone and in the meristem brings about the two‐faceted function of GSO1 in salt tolerance
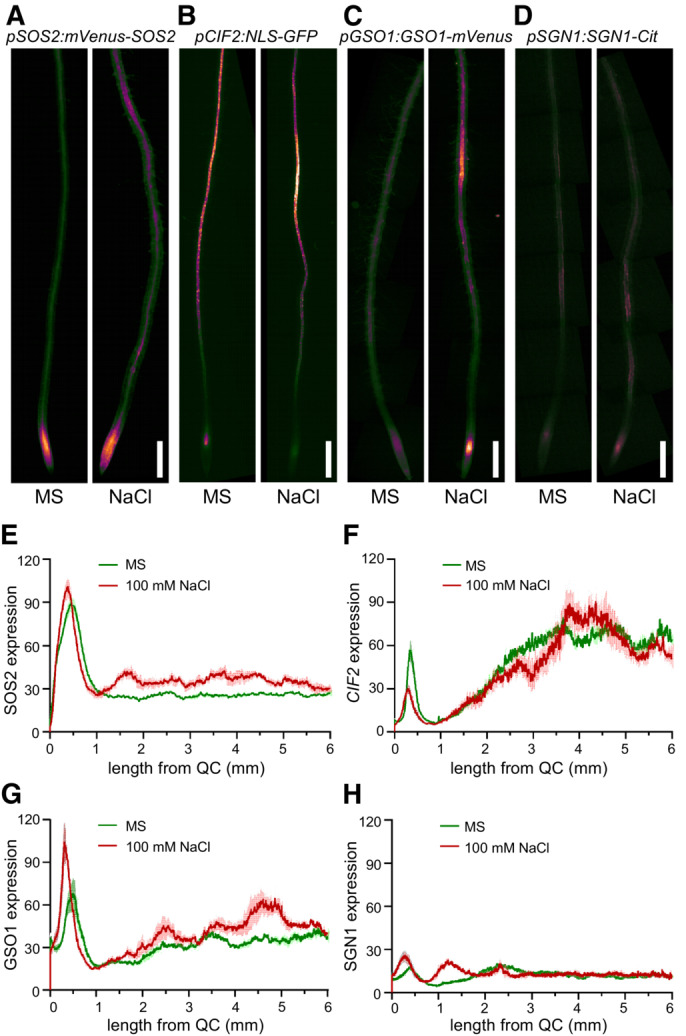
Having established, that GSO1 crucially functions in both, accelerated CS formation and enhanced Na+ extrusion, we sought to determine the underlying mechanism. We were therefore particularly interested in determining if the protein expression pattern of components of the Schengen pathway (CIF1/CIF2‐GSO1‐SGN1) as well as that of SOS2 is modulated in response to salt stress. Since we did not succeed in creating pCIF2:CIF2‐GFP suitable for microscopic analysis, we included the transcriptional reporter pCIF2:NLS‐GFP in these studies (Doblas et al, 2017). To this end, we investigated the protein accumulation pattern of plants that were exposed to 100 mM NaCl for 24 h (Fig 6A–D). In addition to a general microscopic inspection of the apical 6 mm of the root encompassing the meristematic zone (MZ) and the elongation zone (EZ), and reaching into the fully lignified and suberized regions of the differentiation zone (DZ), we also performed a longitudinal line‐scan of fluorescence intensity of this root section to obtain quantitative values (Fig 6E–H). Salt stress application increased the amount of SOS2 protein ubiquitously in both, the meristem and also evenly over the analyzed apical 6 mm region of the root, a finding that aligns with the previously reported enhanced transcript accumulation of SOS2 in response to salt stress (Liu et al, 2000; Quan et al, 2007) (Fig 6A and E). CIF1 expression could not be quantitated due to its very low expression. For pCIF2:GFP‐NLS, we determined that salt stress caused an approximately 50% reduction of expression in the MZ and a significant up‐regulation restricted to a region around 4 mm from the QC, where usually the transition from patchy to continuous suberization is observed (Fig 6B and F). Astonishingly, the same treatment caused a dramatic alteration of GSO1 accumulation and distribution (Fig 6C and G). In the meristem, which prior to salt stress exhibited an especially low GSO1 expression, we observed most prominent upregulation of GSO1 by at least 100% upon salt stress exposure. Moreover, salt stress triggered very significantly enhanced GSO1 accumulation (by almost 100%) in the same longitudinally restricted subregion of the DZ as CIF2 (Fig 6B, C, F and G). In the case of SGN1, we observed in the absence of salt stress a two‐maxima expression profile with the first maximum in the MZ and the second around 2.4 mm from the QC in the section of the DZ where CS formation occurs (Fig 6D and H). Salt stress transformed this 2‐maxima into a 3‐maxima expression profile. The first maximum remained in the MZ and increased its intensity by around 50%, a clearly lesser extent than GSO1. The second maximum occurred around 1.3 mm (compared to 2.4 mm at non‐stressed conditions) and the third maximum occurred at 2.4 mm. We can currently not distinguish if the second non‐stressed maximum is shifted towards the QC upon salt stress or if the third salt stress‐induced maximum represents a reduced status of the non‐stressed second maximum. Collectively, these surprising discoveries reveal that CIF2 RNA accumulation as well as GSO1 and SGN1 protein accumulation are responsive to salt stress. Moreover, these experiments establish that these changes in longitudinal accumulation profile occur in spatially highly defined regions of the root. In the case of GSO1, salt stress enhances GSO1 function in the MZ and in the later DZ through raising the amount of this kinase.
Figure 6. Salt stress enhances the expression SOS2 and GSO1 in specific zones of the root.
-
A–DProtein accumulation (A, C, D) or gene expression (B) of SOS2, CIF2, GSO1, and SGN1 displayed as false color fluorescence intensity. Seedlings from the indicated plant lines were grown on 1/2 MS for 4–5 days and then transferred to 1/2 MS with or without 100 mM NaCl for 1 day. Scale bars: 200 μm.
-
E–HLongitudinal quantification of protein accumulation or gene expression depicted in (A–D) represented as 8‐bit fluorescence intensity (Mean ± SEM, n = 4–5).
Source data are available online for this figure.
Discussion
Effective salt stress signaling and adaptation is of most crucial importance for plants and involves modulation of salt extrusion, transport, and sequestration. Nevertheless, at least equally important is an optimal coordination and adjustment of these responses with ongoing developmental programs and physiological as well as metabolic processes. The SOS2/CIPK24 kinase plays a central role in the SOS pathway for salt tolerance and is conserved throughout higher plants, including crops and halophytes (Yang & Guo, 2018). A first important insight emanating from our study is the increasingly apparent role of the kinase SOS2 as central regulatory hub at which various facets of developmental control and hormonal governance converge (Fig EV5). In this study, we report that the RLK GSO1 activates the SOS pathway by yet an additional mechanism that appears to be linked to developmental differentiation of the root and regulation of root growth.
Figure EV5. SOS2 integrates salt stress signaling with development.
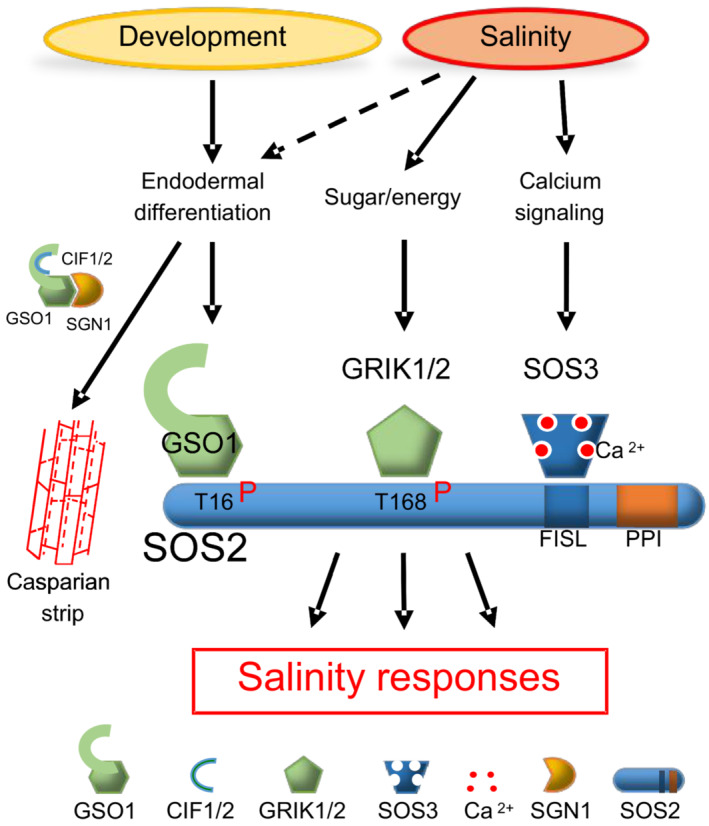
Molecular model of SOS2 as a regulatory hub in salt stress signaling (FISL: Phe‐Ile‐Ser‐Leu motif, PPI: protein phosphatase interaction motif).
The GSO1/SGN3 receptor kinase phosphorylates SOS2 at residue Thr16, resulting in activation of SOS2 in planta and in enhanced activity of the SOS pathway in a yeast‐reconstitution system. Of note is that the threonine residue equivalent to Thr16 of SOS2 is conserved in nine out the 26 CIPKs present in the A. thaliana genome (Appendix Fig S6). These nine CIPKs all belong to the same intron‐containing clade of the CIPK family, suggesting evolutionary conservation of this phosphorylatable residue in this CIPK clade and inferring that an extended subset of CIPKs might be target to regulation by GSO1 and/or other RLKs (Kolukisaoglu et al, 2004; Weinl & Kudla, 2009). In yeast, co‐expression of GSO1 and SOS2 alone was principally sufficient for SOS1 activation suggesting that Thr16 phosphorylation principally can activate the SOS2 kinase without an essential requirement of SOS3. We speculate that Thr16 may be important for the catalytic conformation of SOS2 or affect the ability of SOS2 to bind downstream targets. This conclusion is further supported by our plant mutant analyses that revealed additivity of salt sensitivity in gso1‐3 sos3 but in contrast a similar degree of salt sensitivity of gso1‐3 sos2‐2 compared to sos2‐2. However, we also observed that in yeast co‐expression of GSO1 in addition to SOS3‐SOS2 further enhanced salt tolerance. This is likely a consequence of the plasma membrane targeting function, which SOS3 executes on SOS2 and in this case brings a higher percentage of the cellular SOS2 pool into the proximity of the plasma membrane‐anchored M‐GSO1KD resulting in more efficient SOS2 phosphorylation by GSO1. In conclusion, we suggest that although GSO1‐mediated Thr16 phosphorylation principally represents an SOS3‐independent mechanism of SOS2 kinase activation, in planta GSO1 exerts its activating role on plasma membrane‐anchored SOS3‐SOS2 complexes.
Barajas‐Lopez et al (2018) demonstrated that phosphorylation of Thr168 by GRIK1 is important for SOS2 function. Because the grik1‐2 grik2‐1 double mutant is less sensitive to salt than the sos2‐2 mutant, these authors suggested the likely existence of parallel mechanism(s) enabling the SOS2‐dependent salt resistance, for example, another upstream kinase(s) contributing to the full activation of SOS2. The GSO1‐mediated phosphorylation reported here provides an alternative pathway leading to the activation of SOS2. Collectively, our findings reported here and in previous studies on SOS2 regulation through phosphorylation and binding of other proteins support a model, in which GSO1, GRIK1/2, and SOS3 (and 14‐3‐3 proteins as well as GI) represent separate but not mutually exclusive upstream inputs relaying environmental and developmental cues that lead to the fine‐tuning of SOS2 kinase activity (Manishankar et al, 2018; Yang & Guo, 2018; Fig EV5).
The apoplastic flux of beneficial and toxic ions through the root organ is influenced by modification of cell surfaces through deposition of hydrophobic lignin and suberin (Geldner, 2013; Barberon, 2017). A prominent role in determining trans‐organ apoplastic fluxes is carried out by the post‐meristematic CS. The CS creates an efficient—Na+‐protecting—extracellular diffusion barrier at the endodermis (separating the vasculature from the ground tissue) beginning from its full maturation in the early DZ thereby protecting the root interior from here towards the hypocotyl. Accordingly, proper CS formation has been discussed as major determinant of transpiration‐dependent salt tolerance (TDST) (Jiang et al, 2012; Dinneny, 2015; Köster et al, 2019). However, so far only very few mutants of components that are essential for proper CS formation have been indeed shown to exhibit reduced TDST. This is the case for the ROS‐producing NADPH oxidase (NOX) RBOHF and the suberization‐affecting dirigent protein ESBL, leaving it uncertain, if ROS itself or suberization or lignification or all these mechanisms together are major determinants of TDST (Köster et al, 2019; Wang et al, 2022). CS formation and integrity surveillance is brought about through a peptide‐RLK‐RLCK‐NOX axis forming the Schengen pathway that constitutes of the peptides CIF1/CIF2, the RLK GSO1/SGN3, the RLCK SGN1 and the NOX RBOHF and RBOHD (Jiang et al, 2012; Pfister et al, 2014; Doblas et al, 2017; Nakayama et al, 2017; Fujita et al, 2020). It is becoming increasingly evident that this developmental signaling axis is not only interwoven with but also directly involved in governing ion uptake and transport, for which its role in K+ nutrition serves as a blueprint (Wang et al, 2021). In this case, the Schengen pathway not only conveys accelerated CS formation in response to insufficient K+ supply in the rhizosphere but also directly upregulates the amount of the high affinity K+ uptake transporter HAK5 for restoring K+ homeostasis. With this study, we add a fundamentally new aspect to the functional repertoire of Schengen pathway components. The results of our plant line characterization support the notion that CIF1/2, GSO1, and SGN1/LKS4 all function in TDST in that all respective mutants display reduced shoot growth upon salt stress exposure and because gso1‐3 and casp1 casp3 display similarly salt stress‐enhanced accumulation of Na+ in the xylem sap. Importantly, salt stress also results in a specific upregulation of CIF1/2‐GSO1‐SGN1 in the section of the DZ, in which the maturation of the CS takes place, a finding that is in line with reinforced activity of the CIF1/2‐GSO1‐SGN1 axis to promote accelerated CS formation in response to salt stress exposure. These findings reveal that the Schengen pathway itself is subject to upregulation through salt stress, providing a mechanism for accelerated CS formation in response to salt stress exposure. Moreover, our findings define CIF1/2, GSO1, and SGN1 as essential components of plant TDST. However, the phenotypes of gso1‐3 contrast that of cif1 cif2 and sgn1 (and of the other CS‐related mutants investigated in this study like esb1, casp1 casp3) in that the salt stress‐induced reduction of shoot growth in gso1‐3 becomes prominent already at lower NaCl concentrations than that of cif1 cif2 and sgn1 and is more severe. Moreover, gso1‐3 is the only CS‐related mutant exhibiting a substantial reduction of root growth upon salt stress exposure. How can these differences in salt sensitivity of gso1 compared to cif1 cif2 and sgn1 be explained, especially considering the here identified activation of the SOS2‐SOS1 Na+ extrusion module by GSO1?
Continuous cell division and differentiation initiation in and around the meristem is a distinctive and essential hallmark of root growth and development. Meristematic stem cells and young differentiating root cells are especially vulnerable to fluctuations in rhizospheric ion content since they—in contrast to other cells of the root—do not contain an expanded vacuole for effective ion sequestration/buffering and because cells of these tissues are not protected by the Casparian strip and/or suberization. Strikingly, we here discovered a most salient upregulation of GSO1 in exactly these cells as consequence of salt stress exposure. In contrast, we observed a downregulation of CIF2 and a rather minor upregulation of SGN1 in the meristem. This distinguishes the salt‐triggered expression dynamics of CIF2, SGN1 and GSO1 in the meristem from their expression behavior in the zone of CS formation where all three are upregulated in response to salt exposure. Together with our finding that GSO1 directly activates the SOS2‐SOS1 module that is also expressed in these cells, this discovery implies that salt stress triggers enhanced Na+ detoxification through the GSO1‐SOS2‐SOS1 axis especially in the meristem. This aligns well with the phenotypes of gso1‐3, which displays considerable root growth reduction on media containing elevated NaCl concentrations and, moreover, the most pronounced Na+ accumulation in roots and shoots of all studied CS‐related mutants. Since sos2‐2 mutants still display a more severe root growth phenotype than gso1‐3 these data suggest that specifically in the meristem and surrounding cell layers, in addition to the ubiquitously functioning SOS3‐SOS2‐SOS1 axis for basal salt tolerance, the GSO1‐SOS2‐SOS1 axis creates a means further supporting Na+ detoxification. Notably, we obtained no evidence that CIF1/2 or SGN1 contribute to this meristem‐specific Na+ detoxification mechanism. Considering that GSO1 as a typical RLK can be expected to require activation through binding of extracellular peptides, this observation demands to postulate the existence and function of currently unknown peptides functioning as “salt‐induced factors” (SIFs) that may be constituted by other currently not characterized members of the CIF peptide family (Okuda et al, 2020). On the other hand, the fact that receptor‐like kinases directly phosphorylate target proteins without intermediate co‐receptor kinases as observed here for GSO1 and SOS2 is not unprecedented. It has for example been reported that the RLK FER directly phosphorylates AHA1/AHA2 and EBP1 or that the RLK DORN1 directly phosphorylates the NOX RBOHD (Haruta et al, 2014; Chen et al, 2017; Li et al, 2018). In summary, we here report a mechanism for enhanced cellular Na+ detoxification that relies on spatially highly defined and stress‐induced upregulation of the receptor‐like kinase GSO1 to implement a coordinated bifurcating salt adaptation response of accelerated CS maturation and enhanced meristem stem cell detoxification.
Collectively, adding the discoveries of this work to the existing body of evidence on salt stress signaling allows to propose an advanced model of plant salt tolerance on the cellular and organ scale (Fig 7). Rising rhizospheric NaCl concentrations above a certain threshold level trigger local and systemic Ca2+ signals that throughout the root activate the SOS pathway formed by Ca2+ sensor‐kinase‐Na+/H+ exchanger modules. In these modules, alternative combinations of the Ca2+ sensors SOS3/CBL4, CBL10/SCaBP8, and CBL8 combine with the kinase SOS2 and the transporter SOS1. Concomitantly, salt stress triggers prominent upregulation and accumulation of GSO1 specifically at the section of the endodermis undergoing CS maturation, and in the meristem (Fig 7A). In the CS maturation zone, simultaneous upregulation of CIF2 peptide and SGN1 allows for accelerated endodermis differentiation conferring vasculature impregnation (Fig 7B). Precisely locally confined upregulation of GSO1 in the meristem specifically facilitates cellular Na+ detoxification via a GSO1‐SOS2‐SOS1 axis that likely responds to currently unknown SIF peptides, which bring about receptor activation of GSO1 (Fig 7B). Collectively, these mechanisms synchronize root developmental differentiation and Na+ detoxification for maintaining cellular and organismic ion homeostasis to ensure plant survival in saline environments.
Figure 7. Model of salt tolerance signaling and adaptation.
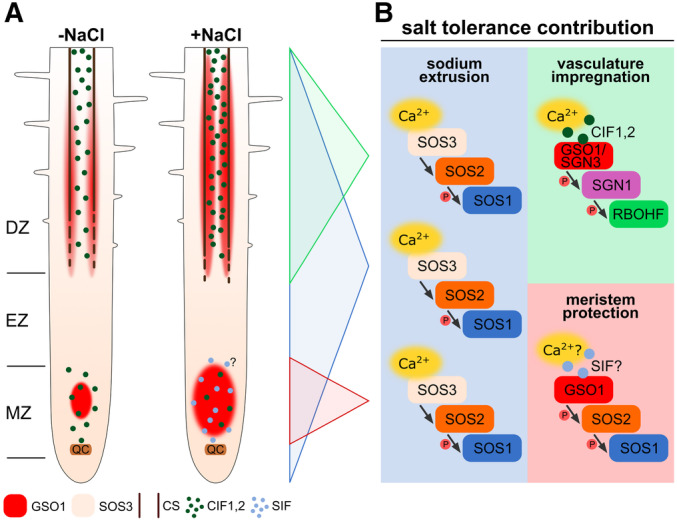
- Organ‐scale model. Interrupted lines indicate CS formation, continuous lines indicate a closed functional CS. Protein accumulation of GSO1 and SOS3 is represented by color intensity (QC: quiescent center, MZ: meristematic zone, EZ: elongation zone, DZ: differentiation zone, SIF: Salt‐Induced Factor).
- Molecular model.
Materials and Methods
Details of all plant lines and constructs used in this study are summarized in Table EV3.
Plant materials
Arabidopsis thaliana Col‐0 was used as wild type. A list of mutant alleles obtained from ABRC and screened for salt sensitivity is provided as Table EV4. Homozygous gso1‐1 and gso1‐3 mutants (SALK_064029 and SALK_103965) and gso2‐1 and gso2‐2 mutants (SALK_130637 and SALK_143123) were obtained from ABRC. sos2‐2 and sos3 mutants are in the gl1/gl1 Col‐0 genetic background, and the scabp8 mutant is a SALK line (SALK_056042) in (Quan et al, 2007). The gl1 mutation did not affect the salt tolerance phenotype. gso1‐3 (SALK_103965) was crossed with sos2‐2 and sos3 to generate double mutants. sos2‐2, esb1, casp1‐1 casp3‐1, cif1 cif2 and lks4 mutants were previously described (Liu et al, 2000; Roppolo et al, 2011; Pfister et al, 2014; Nakayama et al, 2017; Wang et al, 2021).
For gso1‐3 complementation, a 5,718‐bp genomic DNA fragment containing 1,750 bp upstream of the translation start site and 143 bp downstream of the stop codon of GSO1 was cloned into the KpnI and SalI sites of pCAMBIA1300. The plasmid p1300‐ProGSO1:GSO1 was introduced into Agrobacterium tumefaciens GV3101 by electroporation and transformed into gso1‐3 using the flower dip method. T3 generation plants expressing Pro35S:GSO1‐3Flag and Pro35S:6Myc‐SOS2 in Col‐0 or in gso1‐3 were used in phenotype analyses and biochemical studies. 1,569 bp upstream sequence before the translation start site of SOS2 were fused with the CDS sequence of mVenus and the CDS of SOS2 and were cloned into the pGPTV‐II vector to create pSOS2:mVenus‐SOS2 plants in sos2‐2. The lines pSGN3:SGN3‐mVenus, pCIF2:NLS‐GFP and pSGN1:SGN1‐Cit were previously described (Alassimone et al, 2016; Doblas et al, 2017). Primers used in this study are listed in Appendix Table S1.
Analyses of plant salt tolerance
Seeds of wild‐type Arabidopsis, transgenic plants, and mutants were sterilized in a solution containing 20% sodium hypochlorite and 0.1% Triton X‐100 for 10 min, washed five times with sterile water, and sown on half Murashige and Skoog (1/2 MS) medium with 0.3 or 0.5% Phytagel agar (Sigma‐Aldrich). The background concentration of Na+ in 0.3% phytagel was determined to be 0.345 mM. Plates were kept at 4°C for 2 days, and then seeds were germinated vertically under constant illumination at 23°C. Six‐day‐old seedlings were transferred onto 1/2 MS medium with supplemented salt as described. After the indicated times of growth, seedlings were photographed and primary root length and fresh weight were measured and quantified.
Mass spectrometric analysis
Ten‐day‐old Pro35S:GSO1‐3Flag/gso1‐3 plants grown on 1/2 MS medium were ground to fine powder in liquid nitrogen and incubated in IP buffer (10 mM Tris–HCl, 150 mM NaCl, 2 mM EDTA, 0.5% Nonidet P‐40, pH 7.6, 1% protease inhibitor cocktail) for 30 min at 4°C. After centrifugation at 12,000 × g for 30 min, the supernatant was immunoprecipitated with anti‐Flag‐conjugated agarose (Sigma‐Aldrich). Peptides of potentially interacting proteins were detected by liquid chromatography–tandem mass spectrometry (LC–MS/MS).
To identify potential phosphorylation site(s) in SOS2 targeted by GSO1, proteins were first recombinantly expressed in E. coli BL21, and then. Thirty microgram of His‐SOS2K40N and 20 μg of GST‐GSO1KD retained on beads were incubated in 30 μl of kinase buffer (20 mM Tris–HCl, 5 mM MgCl2, 1 mM DTT, pH 8.0, 10 μM ATP) at 30°C for at least 30 min. His‐SOS2K40N was collected together with supernatant after centrifugation and digested with trypsin at 37°C overnight. The phosphopeptides of SOS2 were enriched using TiO2‐tips (Thermo Scientific) according to the manufacturer's protocol and analyzed by nano LC–MS analysis.
Coimmunoprecipitation assays
For experiments using mesophyll protoplasts, the coding sequences of SOS2, SOS3/CBL4, CBL10/SCaBP8 and truncated versions of GSO1 were translationally fused downstream of C‐Myc or Flag tags and cloned into pCAMBIA1307. Plasmids were purified by CsCl gradient centrifugation and transformed into Arabidopsis mesophyll protoplasts (Sheen, 2001). After overnight incubation at 23°C, protoplasts were harvested and lysed with IP buffer (10 mM Tris–HCl, pH 7.6, 150 mM NaCl, 2 mM EDTA, 0.5% (v/v) Nonidet P‐40, and protease inhibitor (Roche)). Samples were centrifuged at 4°C to remove cellular debris. The supernatant was incubated with 10 μl of anti‐C‐Myc agarose conjugate (Sigma‐Aldrich) for 2 h at 4°C with gentle mixing. After incubation, the agarose was washed five times with IP buffer. The coimmunoprecipitation products were detected via immunoblot analysis. Both anti‐Myc (SCBIO) and anti‐Flag (Sigma‐Aldrich) antibodies were used at 1:5,000 dilutions, and chemiluminescence signals were detected with a chemiluminescence system (GE Healthcare).
For transgenic plants, 10‐day‐old seedlings were ground in liquid nitrogen and lysed with IP buffer. The sample was centrifuged at 16,000 × g for 15 min at 4°C. Twenty microliters of anti‐C‐Myc agarose conjugate (Sigma‐Aldrich) were incubated with the extract supernatant for at least 2 h at 4°C. After washing five times with IP buffer, the products were analyzed by immunoblot analysis. The proteins were probed with anti‐Flag and anti‐Myc antibodies and chemiluminescence signals were detected.
Bimolecular fluorescence complementation (BiFC)
All BiFC vectors used in this work were described previously (Waadt et al, 2008). The SOS2 cDNA was cloned via BamHI/SalI into pSPYNE(R)173. GSO1 and SOS3 were cloned via SalI/KpnI into pSPYNE173 and pSPYCE(M), respectively. For transient expression, Agrobacterium tumefaciens GV3101 carrying the BiFC constructs and the p19 strain were used together for infiltration of N. benthamiana leaves. The Agrobacterium strains at an OD600 of 0.5 and the p19 strain at an OD600 of 0.3 were incubated for at least 3 h and infiltrated. CBL1n‐OFP was co‐expressed as plasma membrane marker (Batistič et al, 2008). For microscopic analyses, leaf discs were cut 3 days after infiltration. The YFP fluorescence was assayed under a Zeiss LSM 880 confocal microscope.
Confocal microscopy
Seedlings were grown on 1/2 MS medium for 5 days before imaging. Confocal images were done with Leica SP8 microscope. Excitation and detection windows were set as follows: mVenus 514 nm, 515–545 nm; PI 514 nm, 600–660 nm. PI staining was performed as described in previous report (Hosmani et al, 2013). Seedlings were incubated in 10 μg/ml PI (Propidium iodide) for 10 min, rinsed with water once and washed for 10 min in water with gentle agitation and placed into a drop of water on the slide for confocal microscopy. ClearSee treatment was performed as described previously (Ursache et al, 2018). Seedlings were fixed in 4% (v/v) paraformaldehyde PBS solution (pH 6.9) for 1 h, washed twice for 1 min in 1 × PBS, cleared in Clearsee overnight and placed into a drop of ClearSee on the slide for confocal microscopy.
Yeast methods
Saccharomyces cerevisiae AXT3K strain (Δena1::HIS3::ena4, Δnha1::LEU2, Δnhx1::KanMX4) has been described previously (Quintero et al, 2002). The strain JP837 is a derivative of AXT3K, in which a PGK1:SOS1:CYC1 expression cassette was inserted at the 3′ untranslated region of CYC1 gene, and the A. thaliana SOS1 protein constitutively expresses in JP837 cells. Wild‐type SOS2, activated forms SOS2T/DΔ308 and the SOS2 mutants (SOS2T/DΔ308 T16A and SOS2T/DΔ308 T16D ) were cloned into the BamHI‐SalI sites of pRS416‐GPD. The SOS3 cDNA was cloned into the EcoRI‐XbaI sites of pRS414‐GPD. M‐GSO1KD, the inactive form M‐GSO1KD K979N and M‐GSO2KD were cloned into the BamHI‐SalI sites of pRS415‐GPD. Transformation of yeast was performed using a standard lithium‐polyethylene glycol method. Yeast cells were grown at 28°C in synthetic dextrose (SD) media supplemented with the appropriate requirements for transformants selection. Sodium tolerance tests were performed in alkali cation‐free medium AP supplemented with 1 mM KCl and with NaCl as indicated for each experiment (Quintero et al, 2002). For growth tests, overnight cultures were brought to 1 OD600 and then 4 μl drops of decimal dilution were spotted onto plates with solid AP media. Plates were incubated at 28°C for 3–4 days.
Kinase assays
All constructs for in vitro kinase assays were transformed into and purified from Escherichia coli strain BL21 according to the manufacturer's protocol (primers in Appendix Table S2). Recombinant GSO1KD and GSO1KDK979N proteins were purified with Glutathione Sepharose (MCLAB). Polyhistidine‐tagged SOS2 and SOS2 mutated forms were purified with Ni sepharose (MCLAB). SOS1 C‐terminus was purified with Amylose Resin (NEB). Myc‐tagged SOS2 was immunoprecipitated with anti‐C‐Myc antibody–conjugated agarose. Equal amounts of SOS2 were incubated with MBP‐tagged SOS1C300 in in vitro kinase assays.
In vitro kinase assays were performed as described previously (Lin et al, 2009). Proteins were incubated with 1 μCi (γ‐32P) ATP and 10 × kinase buffer (20 mM Tris–HCl, pH 8.0, 5 mM MgCl2, 10 μM ATP, and 1 mM DTT) at 30°C for at least 30 min. Reactions were terminated by addition of SDS loading buffer at 95°C for 5 min. Proteins were separated by SDS‐PAGE and stained with Coomassie Brilliant Blue R 250. The gels were exposed to a phosphor screen (Amersham Biosciences), and signals were captured by a Typhoon 9410 phosphor imager (Amersham Biosciences) and quantified by ImageQuant 5.0 software.
Promoter GUS analysis
ProGSO1:GUS, ProSOS2:GUS and ProSOS3:GUS plant lines were described in previous works (Quan et al, 2007; Wu et al, 2016). Histochemical GUS analyses were performed as described previously (Jefferson et al, 1987). Samples were incubated at 37°C in GUS staining buffer (3 mM X‐Gluc, 100 mM phosphate buffer, pH 7.0, 0.1% Triton X‐100 and 8 mM 2‐mercaptoethanol) and then placed in 75% ethanol to remove chlorophyll. Photographs of GUS‐stained tissues were taken using a stereo microscope or microscope.
Na+ content measurement
The measurement of the Na+ content has been described previously (Zhang et al, 2018). Seeds were germinated vertically on 1/2 MS medium under constant illumination at 23°C for 6 days. Seedlings were transferred to 1/2 MS medium supplemented with or without NaCl as indicated. A pool containing more than 50 individual plants represented one biological replicate. Shoots and roots were harvested separately and oven‐dried at 80°C for at least 24 h. Then the samples were treated in a muffle furnace at 575°C for 6 h and dissolved in 0.1 M HCl. Na+ contents were measured using the 4100‐MP AES system (Agilent).
Collection of xylem sap
Xylem sap collection procedures has been described previously (Jiang et al, 2012). Seeds were germinated on 1/2 MS medium at 23°C for 10 days and then transferred to soil for 3 weeks. The plants were treated with 1/2 MS with or without NaCl. To collect samples of xylem sap, rosette leaves and inflorescence stems were excised at the top of the hypocotyl. Xylem sap was collected using glass capillaries for up to 6 h and pooled from approximately 20 individual plants. 10% (v/v) concentrated HNO3 was added to the Xylem sap, and incubated for at least 12 h. Then the samples were diluted with water for ion content measurement.
Suberin lamellae analysis
The staining procedures has been described previously (Lux et al, 2005) Five‐day‐old seedlings were stained with 0.01% (w/v) Fluorol Yellow 088 in lactic acid at 70°C for 30 min and washed with water. Then the seedlings were post‐stained with 0.01% (w/v) aniline blue for 30 min and washed with water. Fluorol Yellow fluorescence was observed with a standard GFP filter under wide‐field microscope (OLYMPUS BX51‐DP72).
Suberin zonation and accumulation analyses
Seeds were sterilized, washed, and sown on 1/2 MS medium. Plates were kept at 4°C for 2 days, then seeds were germinated vertically in long‐day conditions at 23°C. Five‐day‐old seedlings were transferred to 1/2 MS medium to which salts were added as described. After 2 days, seedlings were stained with a 0.01% (w/v) solution of Fluorol Yellow 088 in lactic acid at 70°C for 30 min and washed with water. The seedlings were then counterstained with 0.01% (w/v) aniline blue for 30 min and washed with water. 488 nm excitation and 500–550 nm emission window were used for the detection of Fluorol Yellow fluorescence using a Leica SP8 confocal microscope. Fluorol Yellow signal intensities were determined using ImageJ software (gray scale) in a 50 μm wide and 1 mm long ROI and subsequent maximum projections of z‐stacks, covering the first millimeter of the continuous suberization zone in the endodermis. Statistical analyses were performed using GraphPad Prism.
Quantification of reporter gene expression
Quantification of gene expression was performed as described previously (Wang et al, 2021). Seedlings were grown on 1/2 MS media for 4–5 days and then transferred to 1/2 MS medium supplemented with or without 100 mM NaCl for 1 day. Fluorescence intensity indicative for gene expression was observed using a Zeiss AXIO Observer microscope. Fluorescence strength was depicted by false color representation. The signal intensity was analyzed using image J (gray scale) longitudinally along the root. Statistical analyses were performed within GraphPad Prism.
RT‐PCR and quantitative real‐time PCR analysis
For RT‐PCR analyses, yeast total RNA was extracted using an E.Z.N.A. Yeast RNA Kit (Omega Bio‐Tek). Total RNA was treated with RNase‐free DNase I (TaKaRa) to remove genomic DNA. Five microgram of RNA were used for reverse transcription with M‐MLV reverse transcriptase (Promega) according to the manufacturer's instructions. The resulting cDNA was used for RT‐PCR analysis with specific primers. Ethidium bromide staining was used to detect PCR products.
Total RNA was extracted with Trizol reagent (Invitrogen) from 10‐day‐old seedlings or roots, and treated with a PrimeScript RT reagent Kit (Takara). The diluted resulting cDNA solution was used for RT‐PCR or qRT‐PCR analyses. The qRT‐PCR was done using an ABI‐7500 Fast standard protocol.
Split‐luciferase complementation (split‐LUC) assay
All vectors used in this assay were described previously (Chen et al, 2008). SOS2 was fused to the N‐terminus domains of luciferase (pCAMBIA‐35S‐nLuc vector). GSO1KD, M‐GSO1KD and GSO1KDK979N were fused to the C‐terminus domains of luciferase (pCAMBIA‐35S‐cLuc vector). The recombinant plasmids were transformed into A. tumefaciens GV3101. Different GV3101 cultures were suspended in the infiltration buffer (10 mM MES, 10 mM MgCl2, 200 mM acetosyringone, pH 5.6) and then co‐infiltrated into N. benthamiana leaves, respectively. After 3 days, 1 mM D‐luciferin was sprayed onto the leaves in the dark for 5 min. The luminescence signal was captured with a Berthold Night Shade LB 985 system.
Author contributions
Changxi Chen: Conceptualization; data curation; formal analysis; validation; investigation; visualization; methodology; writing – original draft; writing – review and editing. Gefeng He: Data curation; formal analysis; validation; investigation; visualization; project administration; writing – review and editing. Jianfang Li: Validation; investigation. Javier Perez‐Hormaeche: Formal analysis; investigation. Tobias Becker: Formal analysis; validation; investigation; visualization; methodology. Manqing Luo: Validation; investigation. Lukas Wallrad: Validation; investigation; visualization; methodology; writing – original draft; project administration; writing – review and editing. Junping Gao: Resources; project administration. Jia Li: Conceptualization; resources. José M Pardo: Resources; funding acquisition; methodology; writing – original draft; project administration. Jörg Kudla: Conceptualization; resources; supervision; funding acquisition; validation; visualization; methodology; writing – original draft; project administration; writing – review and editing. Yan Guo: Conceptualization; resources; supervision; funding acquisition; validation; visualization; methodology; writing – original draft; project administration; writing – review and editing. Open Access funding enabled and organized by Projekt DEAL.
Disclosure and competing interests statement
The authors declare that they have no conflict of interest.
Supporting information
Appendix
Expanded View Figures PDF
Table EV1
Table EV2
Table EV3
Table EV4
PDF+
Source Data for Figure 1
Source Data for Figure 2
Source Data for Figure 3
Source Data for Figure 4
Source Data for Figure 5
Source Data for Figure 6
Acknowledgements
We thank Prof. Niko Geldner for providing the plant lines pCIF2:NLS‐GFP, pSGN3:SGN3‐mVenus and pSGN1‐SGN1‐Cit and Prof. Caifu Jiang for the A. thaliana esb1 and casp1‐1 casp3‐1 seeds. This work was supported by the National Key R&D Program of China (2022YFA1303400) to YG and a joint grant from the National Natural Science Foundation of China and the Deutsche Forschungsgemeinschaft to JK and YG (410758888). Moreover, YG was supported by additional grants from the NSFC (31921001). JMP acknowledges support by the grant RTI2018‐094027‐B‐100 from Agencia Estatal de Investigacíon (AEI‐MCIU, Spain), co‐financed by the European Regional Development Fund. GH was supported by a fellowship of the China Scholarship Council (CSC, No. 201806350012). Open Access funding enabled and organized by Projekt DEAL.
The EMBO Journal (2023) 42: e113004
Contributor Information
Jörg Kudla, Email: jkudla@uni-muenster.de.
Yan Guo, Email: guoyan@cau.edu.cn.
Data availability
This study includes no data deposited in external repositories.
References
- Alassimone J, Fujita S, Doblas VG, Van Dop M, Barberon M, Kalmbach L, Vermeer JEM, Rojas‐Murcia N, Santuari L, Hardtke CS et al (2016) Polarly localized kinase SGN1 is required for Casparian strip integrity and positioning. Nat Plants 2: 1–10 [DOI] [PubMed] [Google Scholar]
- Barajas‐Lopez JD, Moreno JR, Gamez‐Arjona FM, Pardo JM, Punkkinen M, Zhu JK, Quintero FJ, Fujii H (2018) Upstream kinases of plant SnRKs are involved in salt stress tolerance. Plant J 93: 107–118 [DOI] [PMC free article] [PubMed] [Google Scholar]
- Barberon M (2017) The endodermis as a checkpoint for nutrients. New Phytol 213: 1604–1610 [DOI] [PubMed] [Google Scholar]
- Barberon M, Vermeer JEM, De Bellis D, Wang P, Naseer S, Andersen TG, Humbel BM, Nawrath C, Takano J, Salt DE et al (2016) Adaptation of root function by nutrient‐induced plasticity of endodermal differentiation. Cell 164: 447–459 [DOI] [PubMed] [Google Scholar]
- Batistič O, Sorek N, Schültke S, Yalovsky S, Kudla J (2008) Dual fatty acyl modification determines the localization and plasma membrane targeting of CBL/CIPK Ca2+ signaling complexes in Arabidopsis. Plant Cell 20: 1346–1362 [DOI] [PMC free article] [PubMed] [Google Scholar]
- Berthomieu P, Conéjéro G, Nublat A, Brackenbury WJ, Lambert C, Savio C, Uozumi N, Oiki S, Yamada K, Cellier F et al (2003) Functional analysis of AtHKT1 in Arabidopsis shows that Na+ recirculation by the phloem is crucial for salt tolerance. EMBO J 22: 2004–2014 [DOI] [PMC free article] [PubMed] [Google Scholar]
- Chen H, Zou Y, Shang Y, Lin H, Wang Y, Cai R, Tang X, Zhou JM (2008) Firefly luciferase complementation imaging assay for protein‐protein interactions in plants. Plant Physiol 146: 368–376 [DOI] [PMC free article] [PubMed] [Google Scholar]
- Chen D, Cao Y, Li H, Kim D, Ahsan N, Thelen J, Stacey G (2017) Extracellular ATP elicits DORN1‐mediated RBOHD phosphorylation to regulate stomatal aperture. Nat Commun 8: 1–13 [DOI] [PMC free article] [PubMed] [Google Scholar]
- Choi WG, Toyota M, Kim SH, Hilleary R, Gilroy S (2014) Salt stress‐induced Ca2+ waves are associated with rapid, long‐distance root‐to‐shoot signaling in plants. Proc Natl Acad Sci USA 111: 6497–6502 [DOI] [PMC free article] [PubMed] [Google Scholar]
- De Giorgi J, Fuchs C, Iwasaki M, Kim W, Piskurewicz U, Gully K, Utz‐Pugin A, Mène‐Saffrané L, Waridel P, Nawrath C et al (2021) The Arabidopsis mature endosperm promotes seedling cuticle formation via release of sulfated peptides. Dev Cell 56: 3066–3081 [DOI] [PubMed] [Google Scholar]
- Dinneny JR (2015) Traversing organizational scales in plant salt‐stress responses. Curr Opin Plant Biol 23: 70–75 [DOI] [PubMed] [Google Scholar]
- Doblas VG, Smakowska‐Luzan E, Fujita S, Alassimone J, Barberon M, Madalinski M, Belkhadir Y, Geldner N (2017) Root diffusion barrier control by a vasculature‐derived peptide binding to the SGN3 receptor. Science 355: 280–284 [DOI] [PubMed] [Google Scholar]
- Doll NM, Royek S, Fujita S, Okuda S, Chamot S, Stintzi A, Widiez T, Hothorn M, Schaller A, Geldner N et al (2020) A two‐way molecular dialogue between embryo and endosperm is required for seed development. Science 367: 431–435 [DOI] [PubMed] [Google Scholar]
- EI Mahi H, Hormaeche JP, De LA, Villalta I, Espartero J, Arjona FG, Fernández JL, Bundó M, Mendoza I, Mieulet D et al (2019) A critical role of sodium flux via the plasma membrane Na+/H+ exchanger SOS1 in the salt tolerance of rice. Plant Physiol 180: 1046–1065 [DOI] [PMC free article] [PubMed] [Google Scholar]
- Feng W, Kita D, Peaucelle A, Cartwright HN, Doan V, Duan Q, Liu MC, Maman J, Steinhorst L, Schmitz‐Thom I et al (2018) The FERONIA receptor kinase maintains cell‐wall integrity during salt stress through Ca2+ signaling. Curr Biol 28: 666–675 [DOI] [PMC free article] [PubMed] [Google Scholar]
- Fujita S, De Bellis D, Edel KH, Köster P, Andersen TG, Schmid‐Siegert E, Dénervaud Tendon V, Pfister A, Marhavý P, Ursache R et al (2020) SCHENGEN receptor module drives localized ROS production and lignification in plant roots. EMBO J 39: e103894 [DOI] [PMC free article] [PubMed] [Google Scholar]
- Geldner N (2013) The endodermis. Annu Rev Plant Biol 64: 531–558 [DOI] [PubMed] [Google Scholar]
- Guo Y, Halfter U, Ishitani M, Zhu JK (2001) Molecular characterization of functional domains in the protein kinase SOS2 that is required for plant salt tolerance. Plant Cell 13: 1383–1399 [DOI] [PMC free article] [PubMed] [Google Scholar]
- Guo Y, Qiu QS, Quintero FJ, Pardo JM, Ohta M, Zhang C, Schumaker KS, Zhu JK (2004) Transgenic evaluation of activated mutant alleles of SOS2 reveals a critical requirement for its kinase activity and C‐terminal regulatory domain for salt tolerance in Arabidopsis thaliana . Plant Cell 16: 435–449 [DOI] [PMC free article] [PubMed] [Google Scholar]
- Halfter U (2000) The Arabidopsis SOS2 protein kinase physically interacts with and is activated by the calcium‐binding protein SOS3. Proc Natl Acad Sci USA 97: 3735–3740 [DOI] [PMC free article] [PubMed] [Google Scholar]
- Han JP, Köster P, Drerup MM, Scholz M, Li S, Edel KH, Hashimoto K, Kuchitsu K, Hippler M, Kudla J (2019) Fine‐tuning of RBOHF activity is achieved by differential phosphorylation and Ca2+ binding. New Phytol 221: 1935–1949 [DOI] [PubMed] [Google Scholar]
- Haruta M, Sabat G, Stecker K, Minkoff BB, Sussman MR (2014) A peptide hormone and its receptor protein kinase regulate plant cell expansion. Science 343: 408–411 [DOI] [PMC free article] [PubMed] [Google Scholar]
- Horie T, Hauser F, Schroeder JI (2009) HKT transporter‐mediated salinity resistance mechanisms in Arabidopsis and monocot crop plants. Trends Plant Sci 14: 660–668 [DOI] [PMC free article] [PubMed] [Google Scholar]
- Hosmani PS, Kamiya T, Danku J, Naseer S, Geldner N, Guerinot ML, Salt DE (2013) Dirigent domain‐containing protein is part of the machinery required for formation of the lignin‐based Casparian strip in the root. Proc Natl Acad Sci USA 110: 14498–14503 [DOI] [PMC free article] [PubMed] [Google Scholar]
- Hua BG, Mercier RW, Leng Q, Berkowitz GA (2003) Plants do it differently. A new basis for potassium/sodium selectivity in the pore of an ion channel. Plant Physiol 132: 1353–1361 [DOI] [PMC free article] [PubMed] [Google Scholar]
- Ishitani M, Liu J, Halfter U, Kim CS, Shi W, Zhu JK (2000) SOS3 function in plant salt tolerance requires N‐myristoylation and calcium binding. Plant Cell 12: 1667–1677 [DOI] [PMC free article] [PubMed] [Google Scholar]
- Ismail AM, Horie T (2017) Genomics, physiology, and molecular breeding approaches for improving salt tolerance. Annu Rev Plant Biol 68: 405–434 [DOI] [PubMed] [Google Scholar]
- Jefferson RA, Kavanagh TA, Bevan MW (1987) GUS fusions: beta‐glucuronidase as a sensitive and versatile gene fusion marker in higher plants. EMBO J 6: 3901–3907 [DOI] [PMC free article] [PubMed] [Google Scholar]
- Jiang C, Belfield EJ, Mithani A, Visscher A, Ragoussis J, Mott R, Smith JAC, Harberd NP (2012) ROS‐mediated vascular homeostatic control of root‐to‐shoot soil Na delivery in Arabidopsis. EMBO J 31: 4359–4370 [DOI] [PMC free article] [PubMed] [Google Scholar]
- Kalmbach L, Hématy K, De Bellis D, Barberon M, Fujita S, Ursache R, Daraspe J, Geldner N (2017) Transient cell‐specific EXO70A1 activity in the CASP domain and Casparian strip localization. Nat Plants 3: 1–9 [DOI] [PubMed] [Google Scholar]
- Kim BG, Waadt R, Cheong YH, Pandey GK, Dominguez‐Solis JR, Schültke S, Lee SC, Kudla J, Luan S (2007) The calcium sensor CBL10 mediates salt tolerance by regulating ion homeostasis in Arabidopsis. Plant J 52: 473–484 [DOI] [PubMed] [Google Scholar]
- Knight H, Trewavas AJ, Knight MR (1997) Calcium signalling in Arabidopsis thaliana responding to drought and salinity. Plant J 12: 1067–1078 [DOI] [PubMed] [Google Scholar]
- Kolukisaoglu Ü, Weinl S, Blazevic D, Batistic O, Kudla J (2004) Calcium sensors and their interacting protein kinases: genomics of the Arabidopsis and rice CBL‐CIPK signaling networks. Plant Physiol 134: 43–58 [DOI] [PMC free article] [PubMed] [Google Scholar]
- Köster P, Wallrad L, Edel KH, Faisal M, Alatar AA, Kudla J (2019) The battle of two ions: Ca2+ signalling against Na+ stress. Plant Biol 21: 39–48 [DOI] [PubMed] [Google Scholar]
- Li C, Liu X, Qiang X, Li X, Li X, Zhu S, Wang L, Wang Y, Liao H, Luan S et al (2018) EBP1 nuclear accumulation negatively feeds back on FERONIA‐mediated RALF1 signaling. PLoS Biol 16: e2006340 [DOI] [PMC free article] [PubMed] [Google Scholar]
- Liang X, Zhou JM (2018) Receptor‐like cytoplasmic kinases: central players in plant receptor kinase‐mediated signaling. Annu Rev Plant Biol 69: 267–299 [DOI] [PubMed] [Google Scholar]
- Lin H, Yang Y, Quan R, Mendoza I, Wu Y, Du W, Zhao S, Schumaker KS, Pardo JM, Guo Y (2009) Phosphorylation of SOS3‐like calcium binding protein8 by SOS2 protein kinase stabilizes their protein complex and regulates salt tolerance in Arabidopsis. Plant Cell 21: 1607–1619 [DOI] [PMC free article] [PubMed] [Google Scholar]
- Liu J, Ishitani M, Halfter U, Kim CS, Zhu JK (2000) The Arabidopsis thaliana SOS2 gene encodes a protein kinase that is required for salt tolerance. Proc Natl Acad Sci USA 97: 3730–3734 [DOI] [PMC free article] [PubMed] [Google Scholar]
- Lux A, Morita S, Abe J, Ito K (2005) An improved method for clearing and staining free‐hand sections and whole‐mount samples. Ann Bot 96: 989–996 [DOI] [PMC free article] [PubMed] [Google Scholar]
- Manishankar P, Wang N, Köster P, Alatar AA, Kudla J (2018) Calcium signaling during salt stress and in the regulation of ion homeostasis. J Exp Bot 69: 4215–4226 [DOI] [PubMed] [Google Scholar]
- Marschner H (1995) Mineral nutrition of higher plants, 2nd edn. London: Academic Press; [Google Scholar]
- Nakayama T, Shinohara H, Tanaka M, Baba K, Ogawa‐Ohnishi M, Matsubayashi Y (2017) A peptide hormone required for Casparian strip diffusion barrier formation in Arabidopsis roots. Science 355: 284–286 [DOI] [PubMed] [Google Scholar]
- Okuda S, Fujita S, Moretti A, Hohmann U, Doblas VG, Ma Y, Pfister A, Brandt B, Geldner N, Hothorn M (2020) Molecular mechanism for the recognition of sequencedivergent CIF peptides by the plant receptor kinases GSO1/SGN3 and GSO2. Proc Natl Acad Sci USA 117: 2693–2703 [DOI] [PMC free article] [PubMed] [Google Scholar]
- OlÍas R, Eljakaoui Z, Li J, De Morales PA, MarÍn‐Manzano MC, Pardo JM, Belver A (2009) The plasma membrane Na+/H+ antiporter SOS1 is essential for salt tolerance in tomato and affects the partitioning of Na+ between plant organs. Plant Cell Environ 32: 904–916 [DOI] [PubMed] [Google Scholar]
- Pfister A, Barberon M, Alassimone J, Kalmbach L, Lee Y, Vermeer JEM, Yamazaki M, Li G, Maurel C, Takano J et al (2014) A receptor‐like kinase mutant with absent endodermal diffusion barrier displays selective nutrient homeostasis defects. Elife 3: e03115 [DOI] [PMC free article] [PubMed] [Google Scholar]
- Qi D, Dubiella U, Kim SH, Isaiah Sloss D, Dowen RH, Dixon JE, Innes RW (2014) Recognition of the protein kinase AVRPPHB SUSCEPTIBLE1 by the disease resistance protein RESISTANCE TO PSEUDOMONAS SYRINGAE5 is dependent on S‐acylation and an exposed loop in AVRPPHB SUSCEPTIBLE. Plant Physiol 164: 340–351 [DOI] [PMC free article] [PubMed] [Google Scholar]
- Qiu QS, Guo Y, Dietrich MA, Schumaker KS, Zhu JK (2002) Regulation of SOS1, a plasma membrane Na+/H+ exchanger in Arabidopsis thaliana, by SOS2 and SOS3. Proc Natl Acad Sci USA 99: 8436–8441 [DOI] [PMC free article] [PubMed] [Google Scholar]
- Quan R, Lin H, Mendoza I, Zhang Y, Cao W, Yang Y, Shang M, Chen S, Pardo JM, Guo Y (2007) SCABP8/CBL10, a putative calcium sensor, interacts with the protein kinase SOS2 to protect Arabidopsis shoots from salt stress. Plant Cell 19: 1415–1431 [DOI] [PMC free article] [PubMed] [Google Scholar]
- Quintero FJ, Ohta M, Shi H, Zhu JK, Pardo JM (2002) Reconstitution in yeast of the Arabidopsis SOS signaling pathway for Na+ homeostasis. Proc Natl Acad Sci USA 99: 9061–9066 [DOI] [PMC free article] [PubMed] [Google Scholar]
- Quintero FJ, Martinez‐Atienza J, Villalta I, Jiang X, Kim WY, Ali Z, Fujii H, Mendoza I, Yun DJ, Zhu JK et al (2011) Activation of the plasma membrane Na/H antiporter salt‐overly‐sensitive 1 (SOS1) by phosphorylation of an auto‐inhibitory C‐terminal domain. Proc Natl Acad Sci USA 108: 2611–2616 [DOI] [PMC free article] [PubMed] [Google Scholar]
- Racolta A, Bryan AC, Tax FE (2014) The receptor‐like kinases GSO1 and GSO2 together regulate root growth in Arabidopsis through control of cell division and cell fate specification. Dev Dyn 243: 257–278 [DOI] [PubMed] [Google Scholar]
- Raddatz N, Morales de los Ríos L, Lindahl M, Quintero FJ, Pardo JM (2020) Coordinated transport of nitrate, potassium, and sodium. Front Plant Sci 11: 1–18 [DOI] [PMC free article] [PubMed] [Google Scholar]
- Roppolo D, De Rybel B, Tendon VD, Pfister A, Alassimone J, Vermeer JEM, Yamazaki M, Stierhof YD, Beeckman T, Geldner N (2011) A novel protein family mediates Casparian strip formation in the endodermis. Nature 473: 381–384 [DOI] [PubMed] [Google Scholar]
- Sheen J (2001) Signal transduction in maize and Arabidopsis mesophyll protoplasts. Plant Physiol 127: 1466–1475 [PMC free article] [PubMed] [Google Scholar]
- Shi H, Quintero FJ, Pardo JM, Zhu JK (2002) The putative plasma membrane Na+/H+ antiporter SOS1 controls long‐distance Na+ transport in plants. Plant Cell 14: 465–477 [DOI] [PMC free article] [PubMed] [Google Scholar]
- Steinhorst L, He G, Moore LK, Schültke S, Schmitz‐Thom I, Cao Y, Hashimoto K, Andrés Z, Piepenburg K, Ragel P et al (2022) A Ca2+‐sensor switch for tolerance to elevated salt stress in Arabidopsis. Dev Cell 57: 2081–2094 [DOI] [PubMed] [Google Scholar]
- Sunarpi, Horie T, Motoda J, Kubo M, Yang H, Yoda K, Horie R, Chan WY, Leung HY, Hattori K et al (2005) Enhanced salt tolerance mediated by AtHKT1 transporter‐induced Na+ unloading from xylem vessels to xylem parenchyma cells. Plant J 44: 928–938 [DOI] [PubMed] [Google Scholar]
- Tapken D, Hollmann M (2008) Arabidopsis thaliana glutamate receptor ion channel function demonstrated by ion pore transplantation. J Mol Biol 383: 36–48 [DOI] [PubMed] [Google Scholar]
- Tester M, Davenport R (2003) Na+ tolerance and Na+ transport in higher plants. Ann Bot 91: 503–527 [DOI] [PMC free article] [PubMed] [Google Scholar]
- Tsuwamoto R, Fukuoka H, Takahata Y (2008) GASSHO1 and GASSHO2 encoding a putative leucine‐rich repeat transmembrane‐type receptor kinase are essential for the normal development of the epidermal surface in Arabidopsis embryos. Plant J 54: 30–42 [DOI] [PubMed] [Google Scholar]
- Ursache R, Andersen TG, Marhavý P, Geldner N (2018) A protocol for combining fluorescent proteins with histological stains for diverse cell wall components. Plant J 93: 399–412 [DOI] [PubMed] [Google Scholar]
- Van Zelm E, Zhang Y, Testerink C (2020) Salt tolerance mechanisms of plants. Annu Rev Plant Biol 71: 403–433 [DOI] [PubMed] [Google Scholar]
- Villalta I, García E, Hornero‐Mendez D, Carranco R, Tello C, Mendoza I, De Luca A, Andrés Z, Schumacher K, Pardo JM et al (2021) Distinct roles of N‐terminal fatty acid acylation of the salinity‐sensor protein SOS3. Front Plant Sci 12: 691124 [DOI] [PMC free article] [PubMed] [Google Scholar]
- Waadt R, Schmidt LK, Lohse M, Hashimoto K, Bock R, Kudla J (2008) Multicolor bimolecular fluorescence complementation reveals simultaneous formation of alternative CBL/CIPK complexes in planta. Plant J 56: 505–516 [DOI] [PubMed] [Google Scholar]
- Wang FL, Tan YL, Wallrad L, Du XQ, Eickelkamp A, Wang ZF, He GF, Rehms F, Li Z, Han JP et al (2021) A potassium‐sensing niche in Arabidopsis roots orchestrates signaling and adaptation responses to maintain nutrient homeostasis. Dev Cell 56: 781–794 [DOI] [PubMed] [Google Scholar]
- Wang Y, Cao Y, Liang X, Zhuang J, Wang X, Qin F, Jiang C (2022) A dirigent family protein confers variation of Casparian strip thickness and salt tolerance in maize. Nat Commun 13: 1–14 [DOI] [PMC free article] [PubMed] [Google Scholar]
- Weinl S, Kudla J (2009) The CBL‐CIPK Ca2+‐decoding signaling network: function and perspectives. New Phytol 184: 517–528 [DOI] [PubMed] [Google Scholar]
- Wu Y, Xun Q, Guo Y, Zhang J, Cheng K, Shi T, He K, Hou S, Gou X, Li J (2016) Genome‐wide expression pattern analyses of the Arabidopsis leucine‐rich repeat receptor‐like kinases. Mol Plant 9: 289–300 [DOI] [PubMed] [Google Scholar]
- Yang Y, Guo Y (2018) Elucidating the molecular mechanisms mediating plant salt‐stress responses. New Phytol 217: 523–539 [DOI] [PubMed] [Google Scholar]
- Zhang M, Cao Y, Wang Z, Wang ZQ, Shi J, Liang X, Song W, Chen Q, Lai J, Jiang C (2018) A retrotransposon in an HKT1 family sodium transporter causes variation of leaf Na+ exclusion and salt tolerance in maize. New Phytol 217: 1161–1176 [DOI] [PubMed] [Google Scholar]
- Zhang H, Li X, Wang W, Li H, Cui Y, Zhu Y, Kui H, Yi J, Li J, Gou X (2022) SERKs regulate embryonic cuticle integrity through the TWS1‐GSO1/2 signaling pathway in Arabidopsis. New Phytol 233: 313–328 [DOI] [PubMed] [Google Scholar]
- Zhou H, Lin H, Chen S, Becker K, Yang Y, Zhao J, Kudla J, Schumaker KS, Guo Y (2014) Inhibition of the Arabidopsis salt overly sensitive pathway by 14‐3‐3 proteins. Plant Cell 26: 1166–1182 [DOI] [PMC free article] [PubMed] [Google Scholar]
- Zipfel C (2008) Pattern‐recognition receptors in plant innate immunity. Curr Opin Immunol 20: 10–16 [DOI] [PubMed] [Google Scholar]