

Abstract
Metastatic colonization of distant organs accounts for over 90% of deaths related to solid cancers, yet the molecular determinants of metastasis remain poorly understood. Here, we unveil a mechanism of colonization in the aggressive basal‐like subtype of breast cancer that is driven by the NAD+ metabolic enzyme nicotinamide N‐methyltransferase (NNMT). We demonstrate that NNMT imprints a basal genetic program into cancer cells, enhancing their plasticity. In line, NNMT expression is associated with poor clinical outcomes in patients with breast cancer. Accordingly, ablation of NNMT dramatically suppresses metastasis formation in pre‐clinical mouse models. Mechanistically, NNMT depletion results in a methyl overflow that increases histone H3K9 trimethylation (H3K9me3) and DNA methylation at the promoters of PR/SET Domain‐5 (PRDM5) and extracellular matrix‐related genes. PRDM5 emerged in this study as a pro‐metastatic gene acting via induction of cancer‐cell intrinsic transcription of collagens. Depletion of PRDM5 in tumor cells decreases COL1A1 deposition and impairs metastatic colonization of the lungs. These findings reveal a critical activity of the NNMT‐PRDM5‐COL1A1 axis for cancer cell plasticity and metastasis in basal‐like breast cancer.
Keywords: breast cancer, collagen, colonization, metastasis, NNMT
Subject Categories: Cancer; Chromatin, Transcription & Genomics; Metabolism
An NNMT‐PRDM5‐COL1A1 axis promotes cancer cell plasticity and metastasis in basal‐like breast cancer.
Introduction
Most solid cancer‐related fatalities result from metastasis, a complex cascade of events that begins with extravasation of cancer cells from the primary tumor site to enter the bloodstream and culminates in distant organ colonization, the fatal step for most patients (Chaffer et al, 2016; Massagué & Obenauf, 2016; Klein, 2020). Disseminated cancer cells (DTCs) survive and thrive in the varying ecosystems of distant organs due to their high level of plasticity (Gupta et al, 2019; Hanahan, 2022; Jehanno et al, 2022). In the past two decades, several classes of proteins expressed in cancer cells have been implicated in the increase in plasticity during metastasis, including those involved in survival, immune evasion, proliferation, self‐renewal, angiogenesis, and tissue invasion (Nguyen & Massagué, 2007; Chiang & Massagué, 2008; Massagué & Obenauf, 2016). In contrast, our understanding of the effects of metabolic genes on cancer cell plasticity and metastasis is incomplete.
Cancer metabolism rewiring is an essential feature of adaptation at metastatic sites. For instance, glutamine and fatty acid metabolism rewiring support metastasis in different cancer types (Wang et al, 2015; Ferraro et al, 2021). Organ colonization ultimately relies on efficient energy generation via ATP production, although the intricacies of the metabolic pathways involved seem to vary from organ to organ (Elia et al, 2018). DTCs in the lung microenvironment, for example, depend on the pyruvate metabolite that activates enzymes important for extracellular matrix (ECM) remodeling and mTORC1 activation (Elia et al, 2019; Rinaldi et al, 2021). Tissue invasion is dependent on glycolysis and fermentation, which promote the switch to an invasive phenotype via activation of epithelial‐to‐mesenchymal transition (EMT) and ECM degradation (Elia et al, 2018; Bergers & Fendt, 2021). Of note, several metabolites are powerful co‐factors (acetyl‐CoA, for acetylation) and substrates (methyl groups, for methylation) for epigenetic enzymes that can profoundly influence the epigenetic landscape of cancer cells and thus a multitude of metastatic traits (Miranda‐Gonçalves et al, 2018; Morrison, 2022).
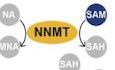
Here, we focused on basal‐like breast cancer as the most aggressive cancer type in women in a search for metabolic genes linked to cancer aggressiveness and poor‐patient outcome (Sørlie et al, 2001). We identified an axis involving multiple transcriptomic and epigenetic changes in basal, self‐renewal, and ECM‐related genes, all influenced by the metabolic enzyme nicotinamide N‐methyltransferase (NNMT), which is active in the basal‐like subset of breast cancers. NNMT is a cytosolic enzyme that catalyzes the irreversible transfer of the methyl group from S‐adenosyl‐L‐methionine (SAM) to nicotinamide (NA) and structurally related compounds, producing S‐adenosylhomocysteine (SAH) and 1‐methylnicotinamide (1‐MNA; Pissios, 2017). NNMT thus regulates a wide variety of metabolic processes associated with nicotinamide and methionine, such as NAD+‐related signaling pathways (e.g., sirtuins; Hong et al, 2015), folate and methionine cycles, polyamine flux, and chromatin remodeling, as well as histone, DNA and general protein methylation (Roberti et al, 2021). Under physiological conditions, NNMT is mostly expressed in the liver and at lower levels in adipose tissue, muscle, and mesenchymal cell types (Pissios, 2017). However, it is highly expressed in a variety of tumors, including lung and pancreatic cancer, glioblastoma, and in tumor‐associated fibroblasts (Roeßler et al, 2005; Wu et al, 2008; Kim et al, 2009; Sartini et al, 2015; Jung et al, 2017). NNMT was reported to be important for self‐renewal in glioblastoma (Jung et al, 2017) and a link between NNMT, chemoresistance, and EMT was established (Liang et al, 2018; Wang et al, 2019). NNMT has been recently described to evoke EMT and disease progression by promoting cholesterol efflux and membrane fluidity in breast cancer (Wang et al, 2022b), yet, how NNMT controls epigenetic programs and how it impinges on metastasis at the cancer cell‐intrinsic level remain unknown. Indeed, NNMT overexpression depletes SAM, thus lowering the methyl pool in cells which is normally used for methylation reactions and gene regulation (Ulanovskaya et al, 2013).
In the present study using basal‐like breast cancer models, we show that NNMT depletion decreases cancer cell plasticity and severely impairs metastatic colonization. NNMT promotes an epigenetic state that leads to the persistence of basal and mesenchymal programs in neoplastic breast cells and loss of this enzyme results in differentiation towards a more luminal/benign phenotype. Furthermore, NNMT depletion results in methylation‐dependent changes in tumor cell intrinsic PR/SET Domain 5 (PRDM5), collagens, and collagen‐crosslinking enzymes. Specifically, NNMT controls the expression of a PRDM5‐collagen axis that is essential for metastatic colonization in the lung. Our study identifies NNMT and the methionine metabolic pathway as central regulators of plasticity that endow breast cancer cells with the self‐sufficient properties that facilitate colonization. This uncovers a potential way to prevent metastatic growth.
Results
NNMT is a metabolic gene associated with metastasis and poor prognosis
To identify metabolic genes relevant to metastasis, we extracted a complete list of metabolic genes from the Reactome database and overlapped this with a gene signature correlated with poor prognosis and metastasis in clinical samples of triple‐negative breast cancer (Kuo et al, 2012). From this overlap, we identified Coenzyme Q2 (COQ2), UDP‐Glucose Ceramide Glucosyltransferase (UGCG), UDP Glycosyltransferase 8 (UGT8), and NNMT (Fig 1A) as the only common metabolic genes associated with worse prognosis. We focused our attention on NNMT as, compared with UGT8, COQ2, and UGCG, we found it strongly associated with reduced recurrence‐free survival of breast cancer patients in a separate cohort of patients, specifically in the basal‐like and HER2‐positive subtypes (Fig EV1A and B; Györffy et al, 2010). In addition, we found NNMT to be upregulated in basal‐like and estrogen receptor (ER) α‐negative cell lines and tumor specimens compared to luminal samples (METABRIC (Curtis et al, 2012; Pereira et al, 2016) and CCLE (Ghandi et al, 2019) datasets; Fig EV1C and D). Interestingly, in some models where NNMT expression was low or absent in the primary tumor, we observed its upregulation in matched metastatic lesions (MDA‐MB‐231 and patient‐derived xenograft (PDX) models (Obradović et al, 2019; Fig 1B and Dataset EV1)). This provided a rationale to prioritize and study the effects of this ill‐defined enzyme in cancer cell plasticity and human cancer metastasis.
Figure 1. NNMT ablation impairs metastatic colonization.
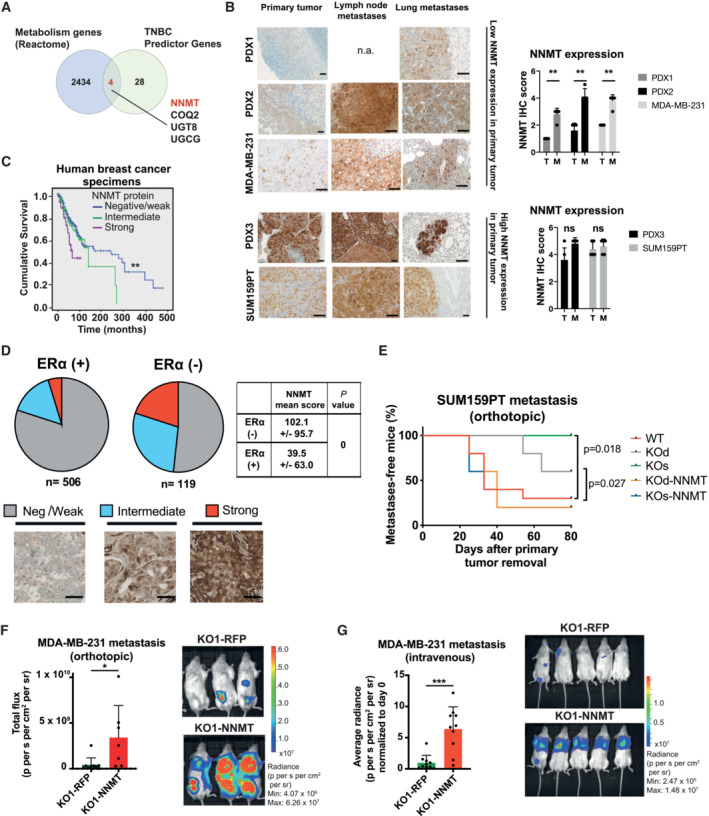
- Venn diagram depicting the four metabolic genes inferred from the Reactome metabolic gene list (NNMT, COQ2, UGCG and UGT8) overlapping with genes predictive in disease recurrence of triple‐negative breast cancers (TNBC) inferred from (Kuo et al, 2012).
- Representative images (left panel) and quantifications (right panel) of NNMT immunostaining in tissue sections from primary tumors (T) and metastases (M) in different breast cancer models, scale bar: 100 μm. n = 5 tissue sections per model. **P < 0.01; n.s., not significant, n.a., not available; Mann–Whitney U‐test. All data are means ± SD.
- Kaplan–Meier survival analysis of breast cancer patients stratified according to NNMT protein levels (negative or weak, n = 541; intermediate, n = 108; strong, n = 44) in primary tumor (n = 517) and metastatic (n = 176) tissue. Estimated 5‐year overall survival rates for subjects with strong, intermediate, and negative/weak NNMT levels were 43.0 ± 10.0, 69.0 ± 6.0 and 73.0 ± 2.0%, respectively. **P < 0.01; log‐rank test.
- Graphic quantification (pie charts) and representative images of immunostaining from 625 primary breast cancer specimens classified according to NNMT protein abundance [negative (neg)/weak, intermediate or strong]. NNMT levels are significantly higher (P = 0, Student's t‐test) in ERα negative (neg) than in ERα positive (pos) breast cancers (side table). Scale bar: 100 μm.
- Kaplan–Meier plot depicting metastasis onset after tumor removal in mice injected orthotopically with SUM159PT WT (n = 10), KO (KOd: n = 5; KOs: n = 5) or KO‐NNMT (KOd‐NNMT: n = 5; KOs‐NNMT: n = 5) cells. *P < 0.05; log‐rank test.
- Bar graph quantification (left panel) and representative bioluminescence images (right panel) of metastases at day 75 after cancer cell injection of MDA‐MB‐231 KO1‐RFP or KO1‐NNMT cells and post‐primary tumor removal. n = 7 to 10 animals per group. *P < 0.05; Mann–Whitney U‐test. All the data are means ± SD.
- Bar graph quantification (left panel) and representative bioluminescence images (right panel) of metastases at day 34 after injection of MDA‐MB‐231 KO1‐RFP or KO1‐NNMT cells into the tail vein of the mice. n = 10 animals per group. ***P < 0.001; Mann–Whitney U‐test. All data are means ± SD.
Figure EV1. NNMT predicts poor recurrence‐free survival and is highly expressed in ERα negative breast cancer.
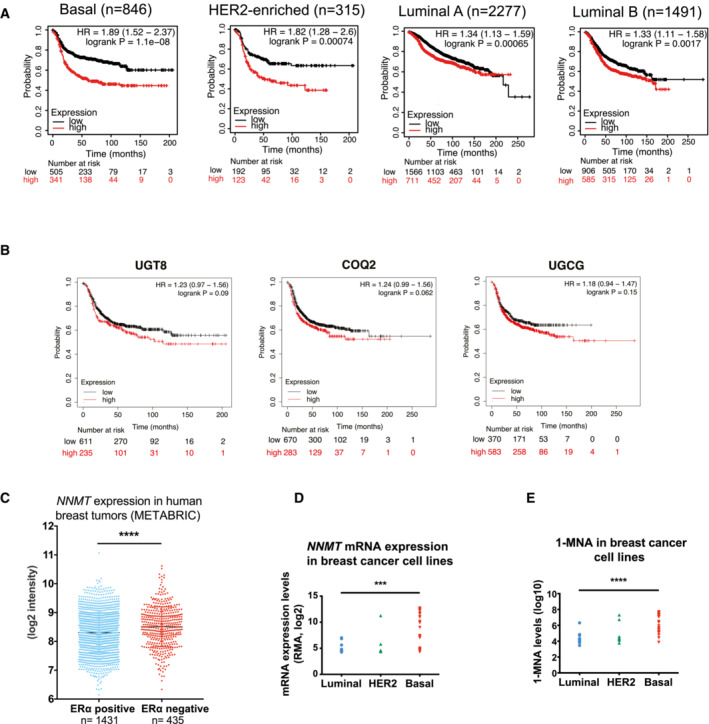
- Recurrence-free survival plots generated using the Kaplan–Meier Plotter (Györffy et al, 2010) based on signal intensity of the NNMT probe (202237_at) in Affymetrix microarray gene expression data from breast cancer patients of The Cancer Genome Atlas. The cut‐off was automatically set to split patients into two groups, high and low. NNMT expression is a strong indicator of poor recurrence‐free survival in the basal subset (median survival in months is 37 and 17 in low and high groups, respectively), in the HER2‐positive subset (median survival in months is 25.76 and 17 in the low and high groups, respectively), in the luminal A subset (median survival in months is 91.36 and 57.3 in the low and high groups, respectively), and in the luminal B subset (median survival in months is 50.07 and 37.0 in the low and high groups, respectively). The hazard ratio (95% confidence intervals) and log‐rank P values for each graph are indicated.
- Recurrence‐free survival plots generated using the Kaplan–Meier Plotter (Györffy et al, 2010) based on signal intensity of the UGT8 (208358_s_at), COQ2 (213379_at), UGCG (204881_s_at), probes in Affymetrix microarray gene expression data from breast cancer patients of The Cancer Genome Atlas, restricted to the basal subgroup according to the PAM50 classification (n = 953). The cut‐off was automatically set to split patients into two groups, high and low. The hazard ratio (95% confidence intervals) and log‐rank P values for each graph are indicated.
- Dot plot depicting NNMT mRNA expression in breast cancer cell lines from the Cancer Cell Line Encyclopedia (CCLE) atlas (Ghandi et al, 2019), ***P < 0.001; Student t‐test.
- Dot plots depicting 1‐MNA abundance in breast cancer cell lines from the Cancer Cell Line Encyclopedia (CCLE) atlas (Ghandi et al, 2019), ****P < 0.0001; Student t‐test.
To further validate our findings at the protein level in an independent cohort of patient samples, we immunostained a series of 625 primary breast cancer tissue samples for the presence of NNMT and found 48 cases (7.7%) with strong and 110 (17.6%) with intermediate NNMT protein expression. The remaining 467 cases (74.7%) were either weakly positive or negative. Not surprisingly, cases of strong NNMT presented the worst overall survival (Fig 1C) and we observed a remarkable overlap of NNMT positivity with the absence of ERα expression (< 10% of positive nuclei; Fig 1D). In addition, we found that the abundance of 1‐MNA (the end product of the NNMT‐catalyzed reaction) was generally low in luminal compared to basal‐like breast cancer cell lines (Fig EV1E; Sarrió et al, 2008; Ghandi et al, 2019). Altogether, these observations across different breast cancer models and patient datasets suggest a strong link between NNMT, basal‐like breast cancer metastasis, and reduced patient survival.
NNMT ablation reduces metastatic colonization
To investigate whether NNMT directly contributes to the aggressive features of basal‐like breast cancer, particularly metastasis, we fully depleted NNMT in the two metastatic basal‐like breast cancer models SUM159PT and MDA‐MB‐231 using CRISPR‐Cas9. NNMT was knocked‐out (KO) in SUM159PT using two different strategies generating two independent oligoclonal KO lines, one line using a single gRNAs (referred as KOs) and another line using two gRNAs enabling genomic deletion (referred as KOd; see Materials and Methods, Fig EV2A and B). We also generated rescue cell lines by infecting these cells with a lentiviral vector carrying the full NNMT ORF or an RFP control vector (Fig EV2B) to exclude off‐target effects. NNMT KO delayed tumor formation in the SUM159PT model, a feature that was lost upon NNMT re‐expression (Fig EV2C). However, once the tumors were established, they grew with similar kinetics (Fig EV2D), suggesting that NNMT is particularly relevant for the initial growth at the primary site. After injection of 10‐ to 200‐fold fewer cells, NNMT KO tumor onset was delayed even more profoundly or was fully impaired (Fig EV2E). With the MDA‐MB‐231 cells, where NNMT expression is low in the primary tumor but significantly elevated in metastases (Fig 1B), we could only generate a single KO clone (KO1–RFP; Fig EV2F), which was orthotopically injected along with its NNMT rescue counterpart (KO1–NNMT, see Materials and Methods). Not surprisingly, given the low NNMT levels at the primary tumor sites of MDA‐MB‐231, NNMT KO had no effect on tumor onset (Fig EV2G). Limiting dilution assay in this model also confirmed that NNMT is particularly relevant at the initial steps of the primary tumor growth (Appendix Fig S1A). In addition, we observed that NNMT KO cells have decreased tumorsphere forming capacities (Appendix Fig S1B and C), and that NNMT expression is sustained by the JAK/STAT3 pathway, as ruxilotinib and anti‐IL6 treatment decreased its abundance (Appendix Fig S1D–F). Finally, the loss of NNMT was associated with a decrease in the CD44high/CD24low stem‐like phenotype (Appendix Fig S1G and H), corroborating that NNMT expression enhances stemness and tumor initiating capacity.
Figure EV2. NNMT depletion reduces metastases formation in basal breast cancer.
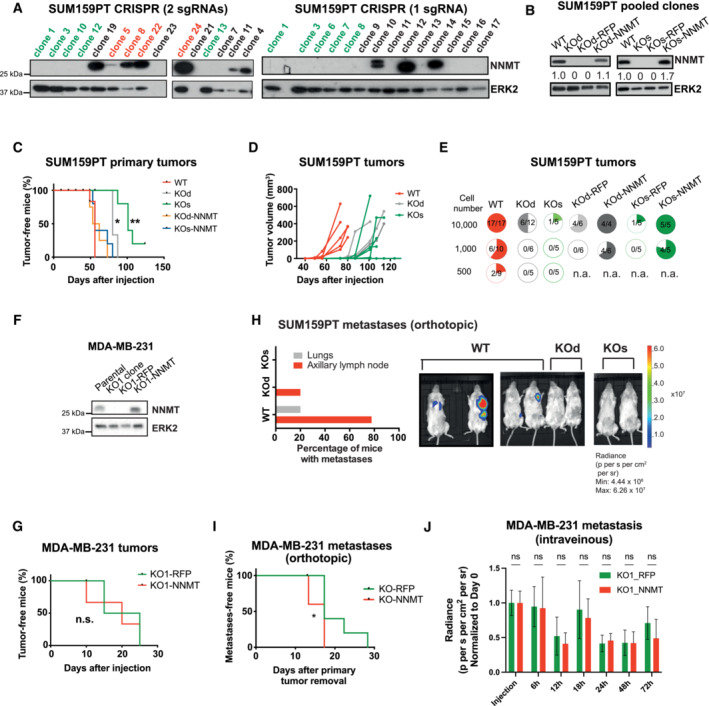
- Immunoblots showing levels of NNMT and ERK2 (loading control) in single‐cell derived clones of SUM159PT after NNMT KO using two independent CRISPR‐Cas9 strategies (left: KOd, right: KOs). For each group, single‐cell clones were pooled in equal proportions to minimize undesired off‐target and clonal effects (in red for WT and green for KOd and KOs).
- Immunoblots showing NNMT and ERK2 (loading control) levels in SUM159PT KOd, KOs, and WT pooled clones and the respective rescue cell lines.
- Kaplan–Meier plot depicting tumor onset in mice injected orthotopically with SUM159PT WT (median 56 days; n = 5), KO (KOd: median 80 days, n = 5; KOs: median 101 days, n = 5) or KO‐NNMT cells (KOd‐NNMT: median 58 days, n = 4; KOs‐NNMT: median 56 days, n = 5). *P < 0.05, **P < 0.01; log‐rank test.
- Graph representing the kinetics of SUM159PT WT (n = 5), KOd (n = 3), and KOs (n = 5) tumor growth upon orthotopic injection of 100,000 cells into NSG mice. The median onset (tumor volume approximately 5 mm3) is 45, 77 and 85 days for WT, KOd, and KOs tumors, respectively.
- Quantification of tumor incidence (pie charts) in the SUM159PT model upon orthotopic injection into mice of WT, NNMT KO or NNMT rescue cells.
- Immunoblots showing NNMT and ERK2 (loading control) levels in MDA‐MB‐231 parental cells and in a single KO clone (KO1) and the respective rescue cell lines.
- Kaplan–Meier plot depicting tumor onset in mice injected orthotopically with MDA‐MB‐231 KO1‐RFP (median 20 days; n = 5) or KO1‐NNMT (median 20 days; n = 5). n.s., not significant; log‐rank test.
- Bar plot depicting the proportion of organ‐specific metastases in mice injected with SUM159PT WT (n = 9) or NNMT KO (KOd, n = 5 and KOs, n = 5) cells. Representative bioluminescence images are shown.
- Kaplan–Meier plot depicting metastasis onset after tumor removal in mice injected with MDA‐MB‐231 KO1‐RFP (n = 10) or MDA‐MB‐231 KO1‐NNMT (n = 4). *P < 0.05; log‐rank test. All data are means ± SD.
- Bar graph quantification of luciferase signal from the lungs of NSG mice injected with MDA‐MB‐231 KO1‐RFP or KO1‐NNMT cells into the tail vein of mice, right after injection and at 6, 12, 18, 24, 48 and 72 h post‐injection. n = 5 animals per group. n.s. not significant; the Mann–Whitney U‐test. All data are means ± SD.
Next, we assessed the effect of NNMT ablation on metastases. When tumors from orthotopically injected cancer cells reached approximately 500 mm3, they were excised and the mice monitored for metastases by bioluminescence. NNMT KO significantly reduced the incidence of metastases in the lymph nodes and lungs in the SUM159PT model (Figs 1E and EV2H). Notably, in contrast to MDA–MB–231 primary tumors, the formation of metastases was profoundly impaired in KO1–RFP cells compared with KO1–NNMT when cells were injected either orthotopically (Figs 1F and EV2I) or intravenously (Fig 1G, and Appendix Fig S2A and B). Bioluminescence monitoring at early time points following intravenous injection of MDA‐MB‐231 cells revealed no difference between KO1–RFP and KO1–NNMT conditions, suggesting that NNMT does not act on extravasation nor survival in the lung (Fig EV2J). Finally, we analyzed circulating tumor cells (CTCs) shedding from KO1–RFP or KO1–NNMT primary tumor (at approximatively 500 mm3), either by flow cytometry or by colony count. We observed no significant difference, suggesting that NNMT does not control intravasation (Appendix Fig S2C–G). Altogether, these data suggest that this enzyme is important for the specific step of lung metastatic colonization.
While NNMT is expressed in basal‐like breast cancer cell lines, it is generally absent in luminal cell lines (Fig EV1D), raising the possibility that NNMT is dispensable for their growth. Forced NNMT expression (NNMT–OE) in the ERα‐positive MCF‐7 cell line hastened tumor growth compared with the RFP control (Appendix Fig S3A and B). Strikingly, NNMT–OE tumors generated axillary lymph node metastases, whereas the RFP controls rarely metastasized (50 vs. 14.2%, respectively, Appendix Fig S3C). These data show that NNMT is not usually expressed in luminal breast cancer but is pro‐metastatic when overexpressed in these tumors.
NNMT promotes a basal cell genetic program
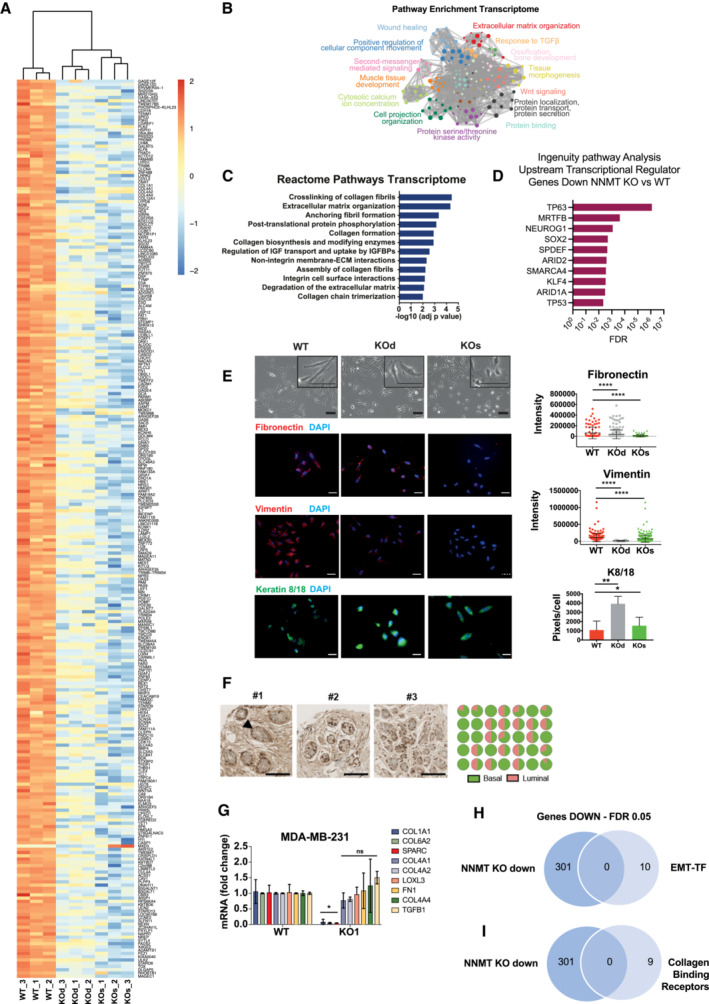
We subsequently investigated the molecular determinants of decreased metastatic potential in NNMT‐depleted models by performing global transcriptional profiling in SUM159PT WT, KOd, and KOs cells. We found a set of 301 genes downregulated and a set of 244 genes upregulated in both NNMT KO lines compared with WT cells (Figs 2A and EV3A). Gene set enrichment analysis (GSEA) of the transcriptome revealed loss of EMT (Gotzmann et al, 2006; Sarrió et al, 2008), TGF‐β signaling, and invasiveness (Schuetz et al, 2006; Anastassiou et al, 2011) signatures, together with a gain in luminal versus basal (Charafe‐Jauffret et al, 2006), oxidative phosphorylation, and reactive oxygen species signatures (Fig 2B). Pathway enrichment analysis confirmed downregulation of ECM organization and of collagen biosynthesis as the top hits in NNMT KO cells (Fig EV3B and C). Interestingly, upstream transcription regulators analysis (IPA) revealed transcription factors associated with myoepithelial/mesenchymal programs (TP63, MRTFB, SMARCA4) and stemness (SOX2, KLF4; Fig EV3D).
Figure 2. NNMT promotes cell–intrinsic expression of ECM components.
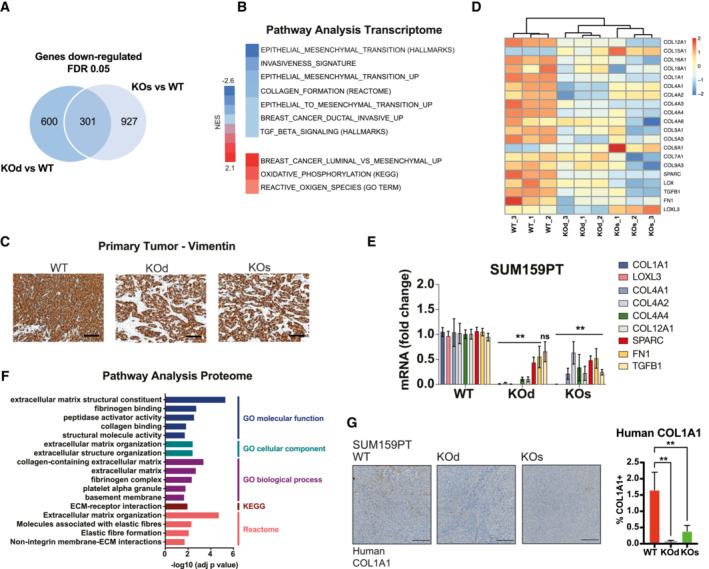
- Venn diagram depicting the 301 genes commonly downregulated upon NNMT ablation in the SUM159PT KOs versus WT and KOd versus WT comparisons. n = 3 experimental replicates per group. Cut‐off: FDR < 0.05, log2 fold change > 0.85.
- Gene Set Enrichment Analysis (GSEA) with NNMT KO‐specific genes (genes simultaneously changed in both KOd and KOs pools relative to WT cells).
- Representative histological images of SUM159 PT ‐WT, ‐KOd, and KOs tumors immunostained with an anti‐human vimentin antibody. n = 5 tumors, 2 sections each. Scale bar: 100 μm.
- Heat map depicting the concomitantly downregulated collagens and their processing machinery by mRNA expression in SUM159PT KOd and KOs versus WT cells.
- Bar graph representing average mRNA expression of collagens and collagen processing genes in the SUM159PT cell model upon NNMT KO. n = 2 to 3 experimental replicates with 2–3 technical replicates each. **P < 0.01, n.s., not significant; Two‐way ANOVA. All data are means ± SD.
- Pathway enrichment analysis (GO, KEGG and Reactome) for concomitantly downregulated proteins in SUM159PT KOd and KOs cells versus WT. Cut‐off: FDR < 0.05, log2 fold change > 1.
- Representative images of human COL1A1 immunostaining (left panel) and bar graph quantification of COL1A1 positive area (right panel) in tissue sections of SUM159PT WT, KOd, and KOs tumors. n = 10 to 15 tumors per model with 2–4 tissue sections per tumor. **P < 0.01; Kruskal–Wallis test. All data are means ± SD. Scale bar: 200 μm.
Figure EV3. NNMT depletion promotes loss of basal identity and represses expression of collagens and their processing machinery.
-
AHeat map depicting the 301 concomitantly downregulated genes in SUM159PT KOd and KOs versus WT cells. n = 3 experimental replicates per group. Cut‐off: FDR < 0.05, log2 fold change > 0.85.
-
B, CPathway enrichment analyses (B: Metascape, C: Reactome) analysis of the 301 commonly downregulated genes depicted in panel (A).
-
DIngenuity Pathway Analysis (Upstream Regulators) of the 301 commonly downregulated genes depicted in panel (A).
-
ELeft panel: Representative phase contrast and immunofluorescence images of SUM159PT WT, KOd and KOs cells demonstrating loss of mesenchymal morphology and acquisition of epithelial‐like features in NNMT KO cells. Right panel: immunofluorescence quantification (n = 3 experimental replicates) showing decreased protein expression of the mesenchymal fibronectin and vimentin markers and the luminal cytokeratins 8/18 in SUM159PT KOd and KOs cell compared to WT cells. *P < 0.5, **P < 0.01, ****P < 0.0001; Student t‐test. Scale bars: 50 μm. Data are means ± SD.
-
FLeft panel: Representative images of NNMT immunostaining in normal breast ducts from 35 breast cancer patients showing preferential expression in the basal cell compartment (arrowhead). Right panel: pie chart quantification of the percentage of NNMT‐positive cells within the basal and luminal compartments. Scale bar: 100 μm.
-
GBar graph representing average mRNA expression of collagens and collagen processing genes in the MDA‐MB‐231 cell model upon NNMT KO. n = 2–3 experimental replicates with 2–3 technical replicates each. *P < 0.05, n.s., not significant; Two‐Way ANOVA. All data are means ± SD.
-
HVenn diagram depicting overlap between the 301 genes commonly downregulated upon NNMT ablation in the SUM159PT KO versus WT comparison and a list of the 10 most described EMT‐inducing transcription factors, EMT‐TF (SNAI1, SNAI2 TWIST1, TWIST2, ZEB1, ZEB2, SOX4, SOX9, FOXC1, FOXC2).
-
IVenn diagram depicting overlap between the 301 genes commonly downregulated upon NNMT ablation in the SUM159PT KO versus WT comparison and a list of known collagen binding receptors (ITGB1, ITGA2 ITGA10, ITGA11, DDR1, DDR2, GP6, LAIR1, GPR56).
Akin to the loss of basal differentiation features, the morphology of SUM159PT KO cells was less mesenchymal and more epithelial than that of the WT cells (Fig EV3E, top panel). We observed decreased expression of fibronectin and vimentin and increased expression of luminal keratins 8/18 in the absence of NNMT (Fig EV3E), indicating that NNMT maintains basal cell identity. In addition, immunohistochemical analysis of tumor sections revealed more differentiated gland‐like structures in KO than in WT tumors, which grew as relatively undifferentiated sheets (Fig 2C). These findings strengthen the exclusivity of NNMT expression in the ERα negative/basal‐like subtype of breast cancer that we identified previously (Fig EV1C and D). Remarkably, we found NNMT to be expressed mostly in the basal layer of the normal breast epithelium (Fig EV3F), suggesting that this relationship is conserved between normal and cancer cells. Altogether, these findings reveal that NNMT promotes not only cancer cell metastasis but also the cellular basal/mesenchymal identity. Consequently, loss of this enzyme results in a more differentiated, benign phenotype alongside the loss of the metastatic potential.
Next, we aimed to understand how loss of such mesenchymal/basal traits could relate to the loss of metastatic potential. Within the specific changes detected in ECM and collagen biosynthesis after NNMT ablation, we detected systematic downregulation of multiple collagen‐encoding genes (COL1A1, COL4A1, COL4A2, COL4A4, COL12A1, and COL13A1) as well as regulators of collagen deposition (TGFB1), cross‐linking (LOXL3 and LOX), and assembly (SPARC and FN1; Fig 2D). These changes were confirmed by quantitative real time PCR (Q‐PCR) in both SUM159PT KO and MDA‐MB‐231 cells (Figs 2E and EV3G) and by immunofluorescence (Fig EV3D). The most consistently downregulated collagen across the different models was COL1A1 (Figs 2E and EV3G). Interestingly, none of the classical EMT‐inducing transcription factors (TFs; such as SNAI1/2, ZEB1/2, TWIST1/2, FOXC1, SOX4, and others) were downregulated upon NNMT ablation at the mRNA level (Fig EV3A, D and H), indicating that NNMT influences cancer cell‐intrinsic ECM expression via a mechanism independent of classic EMT–TF induction. Interestingly, no collagen‐binding proteins (Leitinger & Hohenester, 2007) were differentially regulated upon NNMT KO at the mRNA level, indicating that NNMT does not regulate collagen‐receptor expression (Fig EV3I). Next, we performed global proteomics analysis using Tandem Mass Tags and found that most of the proteins with decreased abundance in SUM159PT KO compared with WT cells are associated with ECM (Fig 2F). Furthermore, expression of human COL1A1 protein secreted specifically by the cancer cells was lower in SUM159PT KO tumors than in WT (Fig 2G). These data indicate that NNMT depletion impairs the secretion of ECM components from cancer cells in vivo, in particular of COL1A1.
NNMT ablation‐evoked methyl overflow represses PRDM5
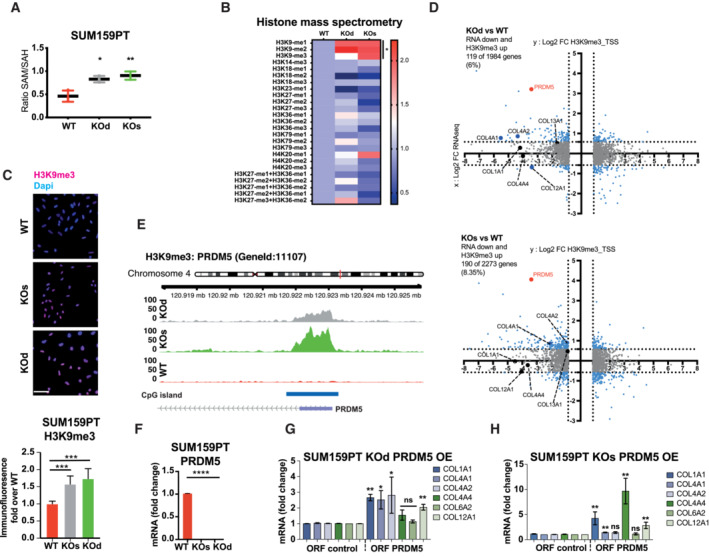
Next, we sought to identify the mechanism behind the decreased expression of basal and mesenchymal traits, particularly ECM components in NNMT‐depleted models. As expected, the ratios of SAM:SAH were 1.8 and 2 fold higher in SUM159PT NNMT KOd and KOs, respectively, than in WT cells (Fig 3A and Dataset EV2), indicating that NNMT depletion elevates the pool of the universal methyl donor SAM (Sperber et al, 2015). We confirmed that ectopic NNMT expression in the SUM159PT KOs and KOd cells abrogates this increase in SAM abundance (Appendix Fig S4A). Conceivably, NNMT‐evoked methyl overflow can result in epigenetic gene repression via histone and/or DNA methylation (Dai et al, 2020). Therefore, we performed an unbiased shotgun mass‐spectrometry‐based quantification of methylated histones 3 and 4 in SUM159PT WT, KOd, and KOs cells. Our results revealed preferential accumulation of H3K9me1/2/3 in NNMT KOd and KOs cells compared with WT (Fig 3B). This was confirmed by immunofluorescence (Fig 3C and Appendix Fig S4B) and immunoblotting (Appendix Fig S4D) in both the SUM159T and MDA‐MB‐231 models. The observed histone hypermethylation was specific to the K9 residue as H3K4 methylation was unchanged (Appendix Fig S4C). Such genome‐wide hypermethylation was paired with metabolic rewiring upon NNMT KO. Specifically, we detected increased oxygen consumption, ATP production and mitochondrial content, which are classically associated with cell differentiation and chromatin condensation (Appendix Fig S5A–C; Sperber et al, 2015; Dai et al, 2020). These findings further verify that loss of NNMT results in a more differentiated and benign phenotype.
Figure 3. NNMT loss increases H3K9me3 marks at the promoter of PRDM5.
-
ABar graph depicting increased ratio of S‐adenosylmethionine (SAM): S‐adenosylhomocysteine (SAH) in SUM159PT KOd and KOs compared to WT cells. n = 3 technical replicates. *P < 0.05; **P < 0.01; Mann–Whitney U‐test. All data are means ± SD.
-
BHeat map showing relative levels of histones 3 and 4 methylation marks in SUM159PT KOd and KOs cells compared to WT cells, as quantified by targeted mass spectrometry in purified histone extracts. n = 3 experimental replicates per group. *P < 0.05; Mann–Whitney U‐test.
-
CBar graph and images depicting H3K9me3 signal by immunofluorescence in SUM159PT WT, KOs, and KOd cells. n = 3 to 4 experimental replicates with 4 to 5 technical replicates each. ***P < 0.001; n.s., not significant; Kruskal–Wallis test. All data are means ± SD. Scale bar: 50 μm.
-
DDot plots depicting the overlap of H3K9me3 ChIP‐sequencing and mRNA‐sequencing data. In the y axis: differential H3K9me3 enrichment at the gene promoter in NNMT KO compared to WT cells. In the x axis: differential mRNA expression of NNMT KO compared to the WT cells. n = 3 experimental replicates. Cut‐off: adjusted P < 0.05. Bold dots highlight collagen genes and PRDM5.
-
EH3K9me3 signal at the TSS of PRDM5 extracted from BAM files.
-
FBar graph representing average PRDM5 mRNA expression in SUM159PT KOs, KOd, and WT cells. n = 3 experimental replicates with two technical replicates each. ****P < 0.0001; Mann–Whitney U‐test. All the data are means ± SD.
-
G, HBar graphs representing average collagen gene mRNA expression upon overexpression (OE) of PRDM5 in SUM159PT KOd (G) and KOs (H) cells. n = 3 to 5 experimental replicates with two technical replicates each. *P < 0.05, **P < 0.01, n.s., not significant; Kruskal–Wallis test. All data are means ± SD.
H3K9me3 is a mark widely described to govern heterochromatic long‐lasting gene repression (Du et al, 2015). Therefore, we investigated whether ECM‐related gene silencing upon NNMT depletion was mediated via H3K9me3 by performing H3K9me3 chromatin immunoprecipitation (ChIP)‐sequencing on SUM159PT WT, KOd, and KOs cells (Appendix Fig S6A). We first mapped H3K9me3 peaks statistically above the background noise genome‐wide, and subsequently performed contrast analyses, in order to identify H3K9me3 regions that were specifically enriched in SUM159PT NNMT KO lines as compared to WT (Appendix Fig S6B). Peaks to genes association using GREAT and cross analysis with the transcriptome revealed 82 genes located nearby a H3K9me3 peak (Appendix Fig S6C). This analysis indicates that approximately one third of the down‐regulated transcriptome upon NNMT KO is due to H3K9me3‐mediated silencing, suggesting additional processes by which NNMT influences expression of ECM components. Further assessment of H3K9me3 enrichment at gene promoters specifically (±2 kb from the TSS) revealed moderate increase in H3K9me3 promoter methylation in NNMT KOd and KOs cells (Fig 3D and Appendix Fig S6D), thus, confirming that H3K9me3 enrichment occurs at distant regulatory elements rather than in proximal promoter (Nicetto & Zaret, 2019). Of note, COL4A1 and COL4A2 displayed increased H3K9me3 at their promoters (Fig 3D). One of the top H3K9me3‐methylated genes in NNMT KOd and KOs cells compared with WT was the transcriptional regulator PRDM5 (Fig 3D and E, and Appendix Fig S6E and F). We also found PRDM5 to display significant H3K9me3 enrichment using gene bodies analysis (Appendix Fig S6G). In both SUM159PT and MDA‐MB‐231 NNMT KO cells, PRDM5 expression was downregulated compared to NNMT‐expressing cells (Fig 3F and Appendix Fig S6H). To confirm the regulation of PRDM5 by NNMT, we ectopically re‐expressed NNMT in the SUM159PT KOd line and observed partial PRDM5 re‐expression, thus, confirming the specificity of the methyl sink effect (Appendix Fig S6I). A comparison of previously described PRDM5‐bound genes (Galli et al, 2012) to our list of genes downregulated upon NNMT depletion revealed 18 common genes, mostly collagens and proteins, involved in ECM organization (Fig EV4A). To test whether PRDM5 regulates the expression of collagen genes, we re‐expressed PRDM5 either in WT or NNMT KOd and KOs cells ectopically or from its endogenous promoter using a Cas9‐Activator with the Synergistic Activation Mediators (CRISPR‐A) system in parental SUM159PT cells (Konermann et al, 2015). Expression of PRDM5 partially increased the expression of several collagens, most consistently COL1A1 (Figs 3G and H, EV4B and C). These data show that NNMT loss downregulates PRDM5, which in turn partly reduces collagen expression.
Figure EV4. PRDM5 enhances collagen gene expression and metastatic colonization.
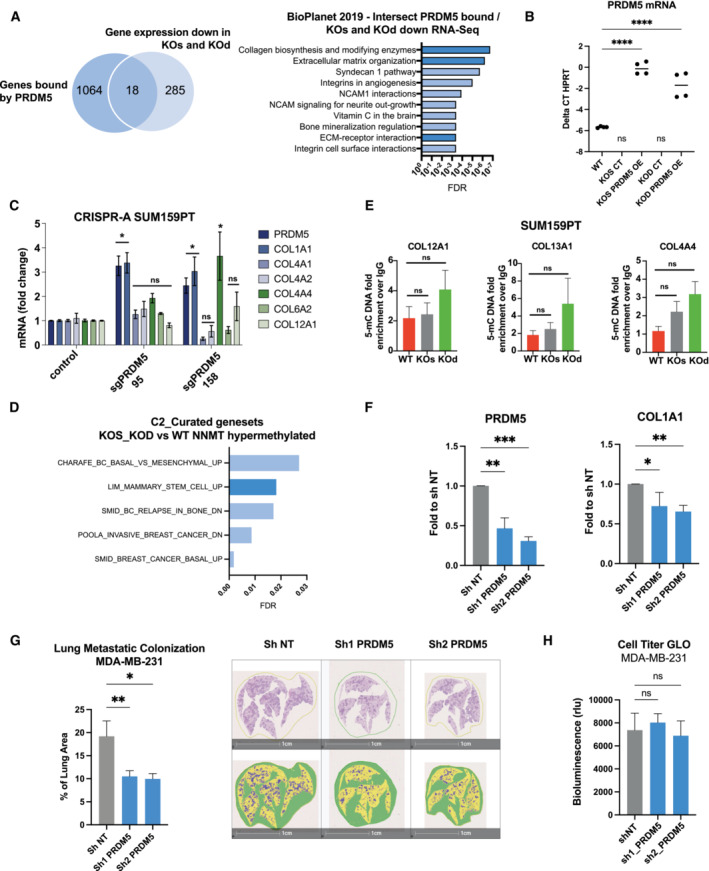
- Left panel: Venn diagram depicting the intersection of PRDM5 bound genes (Galli et al, 2012) with genes commonly downregulated in NNMT KOs and KOd cells. n = 3 experimental replicates. Cut‐off: FDR < 0.05, Log2 fold change > 0.85. Right panel: Pathway analysis (BioPlanet – 2019) of the 18 genes identified in the upper panel. Dark blue bars highlight ECM and collagen‐associated terms.
- Dot plot depicting PRDM5 mRNA expression in SUM159PT WT, KOd, KOs and PRDM5 over‐expression lines (n = 2 experimental replicates, with two technical replicates). ****P < 0.0001, n.d., not detected; One‐Way ANOVA. Central band indicates the mean.
- Bar graph representing average collagen gene mRNA expression upon overexpression of PRDM5 from its endogenous promoter using CRISPR‐Activating technology in SUM159PT parental cells. n = 3 experimental replicates with two technical replicates each. *P < 0.05, n.s., not significant; Kruskal–Wallis test. Data are means ± SEM.
- Gene set enrichment analysis (C2 – Curated GSEA, breast cancer‐related gene signatures) of the top 500 genes displaying promoter CpG hypermethylation upon NNMT KO (FDR > 0.05).
- Bar graphs depicting 5‐mC abundance at promoters of indicated genes shown as fold enrichment of methylated DNA immunoprecipitate (MedIP) over IgG control. n = 3 experimental replicates with 2 to 3 technical replicates each. n.s., not significant; Kruskal–Wallis test. All data are means ± SEM.
- Bar graphs representing PRDM5 and COL1A1 mRNA expression in MDA‐MB‐231 cells expressing sh NT or sh PRDM5. n = 4 experimental replicates. *P < 0.05, **P < 0.01, ***P < 0.001, n.s., not significant; Mann–Whitney U‐test. All data are means ± SEM.
- Left panel: bar graph quantification of lung metastatic positive area in the different conditions. n = 4 to 5 lungs per condition. *P < 0.05, **P < 0.01; One‐way ANOVA. All data are means ± SEM. Right panel: representative images of MDA‐MB‐231 lung metastatic foci stained with HE staining, in sh NT and sh PRDM5 experimental conditions. Scale bar: 1 cm.
- Bar graph showing quantification of Cell Titer GLO assay comparing MDA‐MB‐231 cells expressing sh NT or sh PRDM5. n = 6 experimental replicates. n.s., not significant; One‐way ANOVA. All data are means ± SD.
Loss of NNMT increases DNA methylation at the promoters of PRDM5 and collagen genes
Since re‐expression of PRDM5 in NNMT KO cells only partially rescued the expression of collagens, we sought additional cooperating mechanisms that might influence collagen gene expression. We found that an increased abundance of SAM additionally reverberates on DNA methylation by augmenting the global level of 5‐methylcytosine (5‐mC; Fig 4A). Therefore, to investigate whether DNA methylation directly mediates ECM‐related gene silencing following NNMT depletion, we performed a genome‐scale DNA methylation analysis using the Infinium MethylationEPIC BeadChip array that contains 850,000 probes covering more than 90% of the human genome (Pidsley et al, 2016). Functional annotation of genes displaying increased CpG promoter methylation upon NNMT KO confirmed the epigenetic silencing of genetic programs associated with plasticity, basal differentiation, ECM, and collagens (Figs 4B and EV4D). Analysis of DNA methylation at gene promoters revealed that 21% of the genes transcriptionally downregulated upon NNMT depletion had increased DNA promoter methylation (Fig 4C). Among those genes were PRDM5, COL1A1, COL4A1, COL4A2, and LOX. We validated these findings using targeted immunoprecipitation of methylated DNA (MedIP) and found elevated levels of 5‐mC in the promoters of COL1A1, COL4A1, and COL4A2 in NNMT KO cells compared with WT, but not of COL12A1, COL13A1, or COL4A4 (Figs 4D and EV4E). Interestingly, we also identified a 20‐fold increase in the level of 5‐mC in the vicinity of the PRDM5 gene promoter, which together with H3K9me3 likely contributes to the complete shutdown of PRDM5 expression in NNMT KO SUM159PT cells (Figs 4D and 3F). We also observed this in the MDA‐MB‐231 model (Appendix Fig S7A). To functionally validate the importance of DNA methylation in the repression of collagens, we treated SUM159PT cells with 5‐azacytidine (5‐aza) to inhibit DNA‐methyltransferases. Strikingly, 5‐aza treatment increased the expression of PRDM5 and collagens in NNMT KO but not in WT cells, indicating that repression of collagens via DNA methylation is exclusive to NNMT KO cells (Fig 4E). Of note, a washout experiment revealed that the effects of 5‐aza on PRDM5 and COL1A1 re‐expression were partly conserved 10 days after removal of the compound, thereby indicating a long‐lasting epigenetic memory effect (Appendix Fig S7B).
Figure 4. NNMT loss increases DNA methylation at the promoter of PRDM5 and collagens.
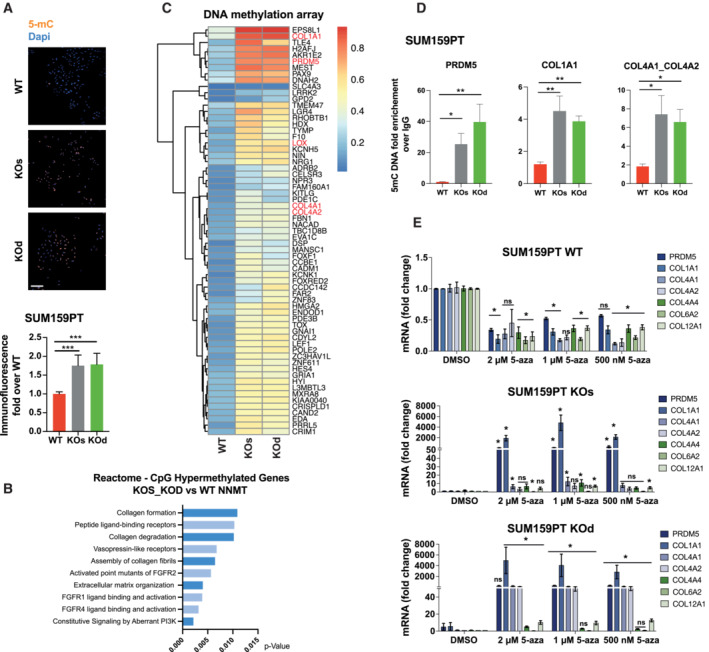
- Representative images and bar graph quantification depicting 5‐methylcytosine (5‐mC) signal by immunofluorescence in SUM159PT WT, KOs, and KOd cells. n = 2 experimental replicates with 5 to 6 technical replicates each. ***P < 0.001; Kruskal–Wallis test. Data are means ± SD. Scale bar: 50 μm.
- Pathway enrichment analysis (Reactome) of the top 500 genes displaying promoter CpG hypermethylation upon NNMT KO (FDR > 0.05).
- Heat map showing hypermethylated CpGs located at gene promoters (cut‐off: differential average beta values > 0.03; averaged by gene), whose expression at the mRNA level is downregulated in NNMT KO cells compared to WT.
- Bar graphs depicting 5‐mC abundance at promoters of the indicated genes shown as fold enrichment of methylated DNA immunoprecipitate (MedIP) over IgG control. n = 3 experimental replicates with 2 to 3 technical replicates each. *P < 0.05, **P < 0.01, n.s., not significant; Kruskal–Wallis test. Data are means ± SEM.
- Bar graphs representing average PRDM5 and collagen gene mRNA expression upon 5‐aza treatment in SUM159PT WT, KOs and KOd cells. n = 3 experimental replicates with two technical replicates each. *P < 0.05, n.s., not significant; Kruskal–Wallis test. Data are means ± SEM.
The PRDM5/COL1A1 axis mediates lung metastatic colonization
PRDM5 is frequently silenced by CpG methylation in several cancers and has been described previously as a tumor suppressor (Shu et al, 2011; Bond et al, 2015). In contrast, our findings suggest that PRDM5 acts downstream of NNMT and enhances collagen expression and thereby early metastatic colonization. Therefore, we assessed the contribution of PRDM5 to metastatic colonization in vivo. We engineered MDA‐MB‐231 to express two different sh RNAs targeting PRDM5 expression (Fig EV4F), with PRDM5 downregulation decreasing COL1A1 expression (Fig EV4F). Remarkably, intravenous injection of MDA‐MB‐231 sh PRDM5 cells showed a reduced lung metastatic burden compared to sh NT cells (Figs 5A, EV4G and H), thus validating PRDM5 as a key factor for metastatic colonization of the lungs.
Figure 5. Tumor cell‐intrinsic collagen expression promotes metastatic colonization and correlates positively with NNMT expression across different cancer types.
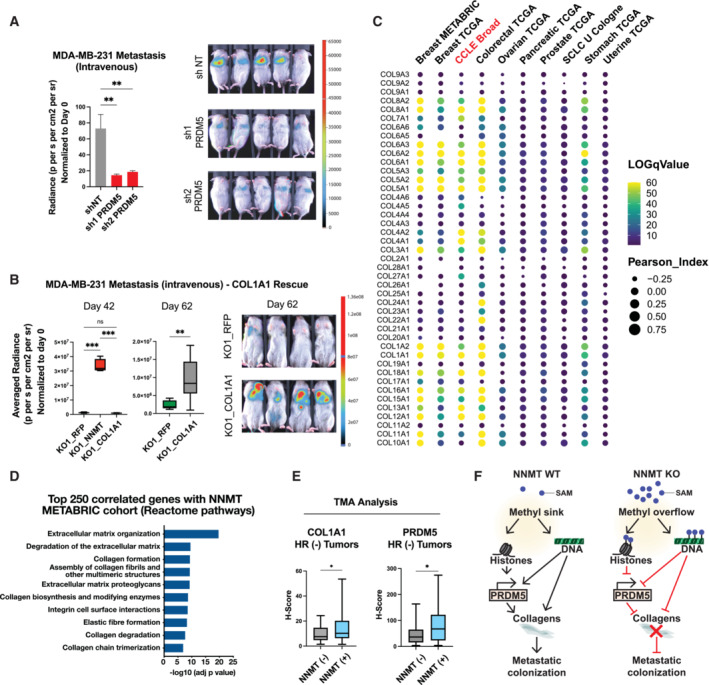
- Bar graph quantification (left panel) and representative bioluminescence images (right panel) of metastases at day 27 after injection of MDA‐MB‐231 cells into the tail vein of mice bearing short hairpin sh NT (non‐targeting), sh1 or sh2 targeting PRDM5. Mice were fed with doxycycline food to sustain shRNA expression during the whole experiment. n = 7 to 8 animals per group. **P < 0.01; One‐way ANOVA. All the data are means ± SD.
- Box plots depicting bioluminescence quantification (left panel) and representative images (right panel) of metastases at day 42 and day 62 after intravenous injection of MDA‐MB‐231 KO1_RFP, KO1_NNMT1 and KO1_COL1A1 (COL1A1 over‐expression) cells. n = 4 to 8 animals per group. **P < 0.01, ***P < 0.001; Day 42: One‐way ANOVA, Day 62: Student t‐test. Boxes define the upper and lower quartiles; central band indicate the median; whiskers define max to min values.
- Bubble plot depicting Spearman's correlation coefficient (circle size) and log q‐Value (color scale) between collagen genes and NNMT expression across different cancer types and within the CCLE dataset (Bell et al, 2011; Curtis et al, 2012; Koboldt et al, 2012; Getz et al, 2013; Abeshouse et al, 2015; George et al, 2015; Hoadley et al, 2018; Ghandi et al, 2019).
- Box plots showing COL1A1 and PRDM5 expression level (H‐Score) according to the NNMT status (NNMT negative, n = 17; NNMT positive, n = 47) within the hormone receptor‐negative (HR−) tumor samples. *P < 0.05; Student t‐test. Boxes define the upper and lower quartiles; central band indicate the median; whiskers define max to min values.
- Graphical abstract illustrating the molecular mechanisms by which NNMT evokes plasticity and expression of ECM components that favor metastatic colonization.
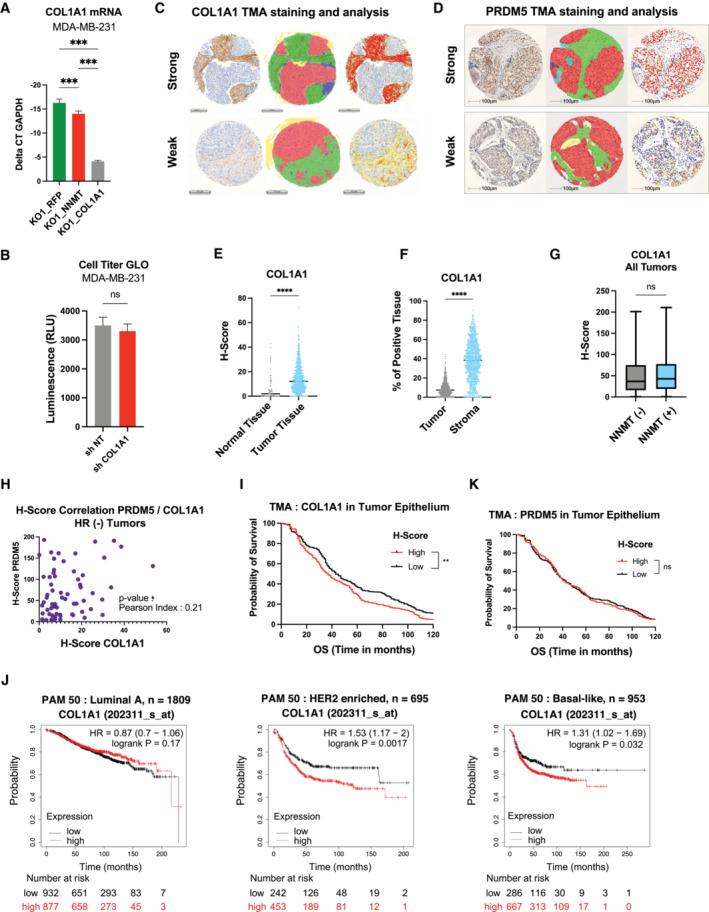
ECM and particularly fibrillar collagens (Types 1, 4) have been described to be predominantly deposited by organ‐specific stromal cells, thus leading to pre‐metastatic niche formation (Deasy & Erez, 2022). However, little is known about the importance of cancer‐cell intrinsic matrix deposition for organ colonization. To address this question, we over‐expressed COL1A1 in the NNMT depleted cell lines and intravenously injected them to assess metastatic colonization. While NNMT‐expressing cells have a higher colonizing ability as compared to the NNMT depleted ones, we found that COL1A1 over‐expression in the NNMT depleted cells increased lung colonization to an intermediate level, demonstrating that cancer cell‐intrinsic expression of collagen favors metastatic colonization (Figs 5B and EV5A). Interestingly, we also found that COL1A1 silencing decreased tumorsphere formation, without altering cell proliferation, thus recalling the NNMT‐phenotype (Fig EV5B and Appendix Fig S8A–D). Altogether, these data demonstrate that the PRDM5‐COL1A1 axis is a critical determinant of metastatic colonization of the lung.
Figure EV5. Immuno‐histochemical staining of COL1A1 and PRDM5, digital analysis, and clinical association with relapse‐free‐survival.
-
ABar graph showing COL1A1 mRNA expression in MDA‐MB‐231 KO1_RFP, KO1_NNMT and KO1_COL1A1 (COL1A1 over expression) cells. n = 3 experimental replicates. ***P < 0.001; One‐way ANOVA. All data are means ± SD.
-
BBar graph showing quantification of Cell Titer GLO assay comparing MDA‐MB‐231 cells expressing sh NT or sh COL1A1. n = 6 experimental replicates. n.s., not significant; Student t‐test. Data are means ± SD.
-
C, DRepresentative COL1A1 and PRDM5 staining of breast cancer tissues cores of the tissue‐microarrays (TMAs, left). Classes used for training a deep neural network algorithm: The red area corresponds to the tumor; stroma has been sub‐classified into desmoplastic (green) and inflamed (blue) (middle). Heatmap showing differential expression of the respective markers (right). COL1A1; Scale bar, 200 μm. PRDM5; Scale bar, 100 μm.
-
EDot plot showing COL1A1 expression level (H‐Score) across the different sample types: normal tissue (n = 76) or primary tumor (PT, n = 757) ****P < 0.0001, Student t‐test.
-
FDot plot showing COL1A1 expression level (H‐Score) across the different areas of the tissue section: tumor epithelium versus stroma (n = 857). ****P < 0.0001; Student t‐test.
-
GBar Graph showing COL1A1 expression level (H‐Score) according to the NNMT status within all tumor samples. NNMT (−) negative, n = 193; NNMT (+) positive, n = 170. n.s., non‐significant; Student t‐test. Boxes define the upper and lower quartiles; central band indicates the median; whiskers define max to min values.
-
HDot plot showing correlation of PRDM5 (x‐axis) and COL1A1 (y‐axis) H‐scores inferred from HR–negative tumor patient samples from the TMA (n = 64), *P < 0.05 correlation P‐value. Pearson index is indicated.
-
IKaplan–Meier plot depicting survival of breast cancer patients stratified according to COL1A1 protein levels (H‐Score) specifically in the tumor epithelium area (n = 857; median cut‐off). Estimated 10‐year overall survival rates are 37 (medium/high COL1A1 group) and 43 months (low/negative COL1A1 group), respectively. **P < 0.01; log‐rank test.
-
JRecurrence-free survival plots generated using the Kaplan–Meier Plotter based on signal intensity of COL1A1 (202311_s_at) probe in Affymetrix microarray gene expression data from breast cancer patients of The Cancer Genome Atlas (Györffy et al, 2010), in the luminal A (n = 1809), HER2‐enriched (n = 695) and basal (n = 953) subgroups according to the PAM50 classification. The cut‐off was automatically set to split patients into two groups, high and low. The hazard ratio (95% confidence intervals) and log‐rank P‐values for each graph are indicated.
-
KKaplan–Meier survival analysis of breast cancer patients stratified according to PRDM5 protein levels (H‐Score) specifically in the tumor epithelium area (n = 857; median cut‐off). Estimated 10‐year overall survival rates. n.s., non‐significant; log‐rank test.
NNMT expression positively correlates with collagen expression in multiple cancer types
Next, we questioned whether the influence of NNMT on mesenchymal and collagen genes occurs in other cancer types. Notably, a high correlation was found between NNMT and collagen expression in publicly available clinical datasets from human tumors, including not only breast but also prostate, colorectal, stomach, pancreatic, uterine, ovarian, and small cell lung cancers (Bell et al, 2011; Curtis et al, 2012; Koboldt et al, 2012; Getz et al, 2013; Abeshouse et al, 2015; George et al, 2015; Pereira et al, 2016; Hoadley et al, 2018; Fig 5C and Dataset EV3). NNMT was reported to be highly expressed in certain cancer‐associated fibroblasts (Eckert et al, 2019; Song et al, 2020), a major source of collagens in tumors (Kalluri, 2016). To determine whether the pan‐cancer association between collagen and NNMT expression might derive from contaminating stromal cells, we investigated the Cancer Cell Line Encyclopedia (CCLE) database, which includes 1,739 cell lines across 29 different cancer types (Ghandi et al, 2019). Unambiguously, we identified multiple collagen‐encoding genes whose expression was positively correlated with NNMT expression (Fig 5D). This highlights the broad relevance of NNMT in enhancing cancer cell intrinsic collagen expression across several cancer types.
Clinical validation of the NNMT‐PRDM5‐COL1A1 axis in hormone receptor‐negative (HR− ) breast cancer patients
Finally, we investigated the relevance for human cancer of the tumor cell intrinsic NNMT‐PRDM5‐COL1A1 axis by examining clinical patient samples. To this end, we immunostained breast cancer tissue samples that were previously stained for NNMT (Fig 1C) for the presence of COL1A1 and PRDM5. COL1A1 and PRDM5 staining was analyzed by an algorithm trained to recognize and separate the stroma from the tumor epithelium areas (Figs EV5C and D). We first observed that COL1A1 protein abundance was higher in the stroma than in the cancer cell compartment, which was in turn higher than in normal epithelial cells (Fig EV5E and F). To assess a putative association between COL1A1 and NNMT protein abundance, we separated the samples according to the NNMT status (positive or negative) and quantified COL1A1 expression (H‐score) within the tumor epithelium area. Interestingly, we found no positive association between COL1A1 and NNMT when considering all breast cancer subtypes (Fig EV5G). Given that NNMT is mostly expressed in HR− samples, where it specifically predicts poor outcome, we repeated the analysis of protein abundance in these specific specimens. Strikingly, we found that NNMT‐positive tumors displayed significantly elevated COL1A1 abundance as compared to NNMT‐negative samples (Fig 5E), thus, validating a positive correlation between NNMT and COL1A1 at the protein level. In addition, we observed that NNMT‐positive tumor samples also exhibit increased PRDM5 protein abundance, specifically in HR− samples (Fig 5E), corroborating our previous observations. More interestingly, we confirmed the existence of a positive and statistically relevant correlation between PRDM5 and COL1A1 levels (Fig EV5H), which highlights the functional relevance of the NNMT‐PRDM5‐COL1A1 axis in HR− human breast cancer. Lastly, we assessed the predictive value of tumor cell intrinsic expression of collagens and found that the COL1A1 protein level within the tumor epithelium area can predict worse overall survival (Fig EV5I), regardless of the subtype. Interestingly, COL1A1 expression at the mRNA level was also associated with reduced relapse‐free survival of breast cancer patients in a separate cohort (Györffy et al, 2010), specifically in basal‐like and HER2‐positive subtypes (Fig EV5J). Of note, PRDM5 protein abundance alone does not correlate with patient survival (Fig EV5K), suggesting a context specific activity of PRDM5 in cancer. Our findings confirm a clinical association between NNMT, PRDM5, and COL1A1 and the relevance of this axis to disease progression and patient outcome.
Taken together, our data reveal that NNMT depletion evokes a methyl overflow that triggers histone and DNA hypermethylation. This installs a non‐permissive epigenetic program that locks cells in a more differentiated state, represses PRDM5 and collagen gene transcription, and decreases cellular plasticity, all of which resulting in the loss of metastatic colonization ability (Fig 5F).
Discussion
Cellular plasticity, by which cell phenotypes change in response to environmental cues, is a key feature of malignant disseminated tumor cells that promotes metastatic colonization. Deciphering the molecular mechanisms and signaling pathways by which cancer cells become more plastic is therefore of paramount importance to the development of novel clinical interventions. Such mechanisms can be triggered by the host microenvironment (Elia et al, 2019; Correia et al, 2021; Jehanno et al, 2022) or they can be an intrinsic property of the cancer cells (Obradović et al, 2019; Jehanno et al, 2022). In this study, we have identified NNMT as a central factor in tumor cell intrinsic plasticity that enhances those basal and mesenchymal properties of basal‐like breast cancer cells that lead to lung colonization. Loss of NNMT downregulates these traits and upregulates luminal differentiation markers, which leads to differentiated tumors and less metastasis.
NNMT was originally shown to clear vitamin B3 from the body (Pissios, 2017). However, it is becoming increasingly apparent that NNMT has multi‐layered effects on normal physiology and disease. NNMT expression and activity are augmented upon injury and inflammation in various organs. For instance, NNMT expression increases in the lungs and skeletal muscles of patients with chronic obstructive pulmonary disease or in skeletal muscle of patients with diverse forms of dystrophy (Ho et al, 2010; Savarimuthu Francis et al, 2011). The importance of NNMT in cancer has recently been reported, ranging from initiating self‐renewal properties (Jung et al, 2017) to promoting tumor growth and invasiveness, and blocking cell death (Wu et al, 2008; Liang et al, 2018; Wang et al, 2022a). Nevertheless, its involvement in metastasis at the cancer cell intrinsic level remains elusive, with few studies describing a pro‐metastatic effect of NNMT in hepatic stellate cells (Li et al, 2019), in breast cancer cells by controlling cholesterol metabolism (Wang et al, 2022b), and in ovarian cancer by sustaining a pro‐metastatic gene program in cancer‐associated fibroblasts (Eckert et al, 2019).
We demonstrate here that NNMT activity initiates a permissive epigenetic program that fuels tumor cell plasticity. This promotes PRDM5 and ECM‐related gene transcription, augmenting metastatic colonization. Mechanistically, NNMT‐evoked methylation of nicotinamide creates a methyl sink that reduces the cellular methylation potential via reduction of the SAM:SAH ratio. The methyl sink effect of NNMT has already been described in the literature and appears to be highly dependent on the cell type considered. Indeed, it has been reported that NNMT loss in cancer associated fibroblasts triggered changes in H3K27me3 or H3K4me3 but not in H3K9me3, me2, or me1 (Eckert et al, 2019), while NNMT loss in ovarian cancer lines triggers increased H3K9 methylation and moderately H3K27 methylation (Ulanovskaya et al, 2013). These discrepancies could also be explained by the differential enzymatic activity of the epigenetic regulators (mostly methyltransferases) associated with each mark. Indeed, their activity also depends on the abundance of different metabolites such as α‐Keto‐Glutarate, NAD+ or succinate, which could explain why some epigenetic regulators are differentially sensitive to change in SAM levels (Meier, 2013). Furthermore, our data show that the hypomethylated state of NNMT‐expressing cells results in a permissive environment that allows direct de‐repression of collagen gene promoters and up‐regulation of the transcriptional activator PRDM5, which we validated as a direct master‐regulator of collagens expression. Thus, the hypomethylated state driven by NNMT unleashes cellular plasticity that re‐routs epithelial tumor cells to a more mesenchymal phenotype characteristic of the basal breast cancer subtype, facilitating migration, invasion, and drug resistance (Shibue & Weinberg, 2017; Williams et al, 2019). Of note, while PRDM5 has been paradoxically described as a tumor suppressor inhibiting WNT signaling and reducing tumor cell clonogenicity in various cancer cell lines (Shu et al, 2011), we propose here that it acts as an oncogene in the basal‐like breast cancer subtype, particularly by promoting metastatic colonization in the lungs. PRDM5 might therefore be an example of proteins, such as the glucocorticoid receptor (Obradović et al, 2019; Tonsing‐Carter et al, 2019), that can have antagonistic roles depending on the subtype and the stage of the disease considered.
We propose that aggressive cancers that express NNMT secrete specific ECM components that are particularly relevant in metastatic colonization (Tian et al, 2020; Cox, 2021). Collagens are major components of the ECM and their composition and stiffness in tumors differ from those of normal tissues (Levental et al, 2009). Examples of classic tumor‐specific collagens include COL1A1, COL3A1, COL4A2, COL7A1, COL17A1, whose major sources are fibroblasts (Deasy & Erez, 2022). At the same time, overexpression of collagen‐crosslinking or hydroxylating enzymes such as LOX or P4HA promotes assembling and stiffening of the ECM, which has been shown extensively to induce tumorigenesis and metastasis via regulation of essential hallmarks, such as cancer cell self‐renewal, EMT, and drug resistance (Erler et al, 2006; Elia et al, 2019). Mechanistically, how collagen signals to cancer cells via their cognate receptors in the metastatic niche and how it promotes cell survival or proliferation warrant further investigations to unveil potential actionable vulnerabilites (Heino, 2014; Han et al, 2020). Collagens and ECM remodeling enzymes can also be produced by cancer cells themselves (Fang et al, 2019; Jun et al, 2020). However, the molecular mechanisms underpinning such cell‐autonomous secretion of ECM components and the importance of this process in the remodeling of foreign microenvironments and metastatic colonization has remained ill‐defined. Among the different ECM‐proteins regulated by NNMT, we found all the critical components of the lung metastatic niche, including fibronectin‐1 and both fibrillar (type 1) and network‐forming collagens (type 4, 13; Deasy & Erez, 2022). Interestingly, we found that COL1A1 expression is epigenetically regulated by NNMT at multiple levels, both by promoter DNA methylation and via PRDM5. COL1A1 expression and matrix stiffening are well‐known drivers of metastasis in several cancer types (Zhang et al, 2018; Deasy & Erez, 2022). We propose that such plasticity endows cancer cells with the capacity to secrete their own niche, reducing the role of neighboring stromal cells in establishing the premetastatic niche of DTCs and initiating colonization. Finally, we demonstrate the intricate cancer cell‐intrinsic positive correlation between NNMT and collagen expression in other cancer types, suggesting that the influence of NNMT on the identified epigenetic program holds true in a wide variety of malignancies (Bell et al, 2011; Getz et al, 2013; Abeshouse et al, 2015; George et al, 2015; Hoadley et al, 2018).
Finally, NNMT may be a potential new actionable therapeutic target for basal‐like breast cancer. Indeed, few studies have described a cytotoxic effect of putative NNMT inhibitors in clear cell renal carcinoma or in melanoma, however not in the context of metastatic disease and with limited activity in vivo (Reustle et al, 2022; Sun et al, 2022). The development of selective NNMT inhibitors potent at increasing the SAM/SAH ratio and inhibiting subsequent epigenetic programs, an accurate patient stratification based on NNMT status, and the definition of the optimal time of treatment are awaited for assessing the clinical benefit of NNMT inhibition, in order to treat patients with the most aggressive forms of breast cancer.
Materials and Methods
Cell lines
All the cell lines were from ATCC and cultured according to their protocols, except for the SUM159PT cell line, which was kindly provided by Dr Charlotte Kupperwasser (Boston, Massachusetts, USA) and is commercially available (Asterand, Detroit, MI). These cells were cultured in Ham's F12 with 5% fetal calf serum (Gibco, Invitrogen), 5 μg/ml bovine insulin (Sigma), 1 μg/ml hydrocortisone (Sigma), 1× penicillin/streptomycin (Gibco, Invitrogen). SUM159PT cell line identity was confirmed by short tandem repeat (STR) sequencing and all cell lines were routinely tested for mycoplasma contamination.
Human breast cancer patient material
Tissue microarrays (TMAs) of primary breast cancer tissue samples from 1,253 patients were selected for this study. The construction of the TMAs and the clinicopathological characteristics of the patient cohort have been described previously (Varga et al, 2014; Pomp et al, 2015; Britschgi et al, 2017). The cohort comprises samples from the Department of Pathology and Molecular Pathology of the University Hospital Zürich that were collected between 1991 and 2011. Clinical data, tumor stage and at least 5 years of follow‐up with histopathological parameters, such as histological grading, hormone receptor, and HER2 status, were available for all the patients. Data regarding the presence of local or distant recurrence were available for most patients; 864 cores could be interpreted and were available for analysis. Three TMAs were used for this study. The first TMA (ZTMA 21) contained 608 single cores collected from 1991 to 2004. The second TMA (ZTMA 27) contained 336 single cores collected from 1995 to 2004. The third TMA (ZTMA 29) contained 308 single cores collected from 1995 to 2005. This retrospective study on human tissue samples was approved by the Cantonal Ethics Committee of Zurich (KEK‐2012‐553). Informed consent was not necessary as the ethical approval completely covered all issues of this retrospective study and the samples were completely anonymized and de‐identified before the study.
The H‐score is a clinical parameter ranging from 0 to 300 that integrates both the percentage of positive staining and the intensity of the staining (weak, moderate, and strong) for a given marker. The formula for calculating the H‐score is the following: H = (3 × percentage of strong staining intensity) + (2 × percentage of moderate staining intensity) + (percentage of weak staining intensity).
Animal experiments
Female non‐obese diabetic severe combined immunodeficient IL2rγ null (NSG) mouse colonies were maintained in the animal facility of the Friedrich Miescher Institute and at the Department of Biomedicine of the University of Basel, in accordance with Swiss guidelines on animal experimentation. Experiments were performed in accordance with the Swiss ethical animal welfare ordinance and approved by the cantonal veterinary office of Basel Stadt (reference number: 2159‐32962).
For orthotopic engraftment of breast cancer cell lines, 500–100,000 SUM159PT cells, 50–100,000 MDA‐MB‐231 cells, and 1,000,000 MCF‐7 cells were suspended in a 30‐ or 100‐μl mixture of basement membrane matrix (BD Biosciences) and PBS (1:2) and injected into the fourth mouse mammary gland of 8‐ to 10‐week‐old NSG mice. For the MCF‐7 tumors, 17β‐estradiol pellets (Belma Technologies) were implanted during the whole duration of the experiment. Tumors were measured with Vernier calipers and tumor volumes calculated by the formula 0.5 × [(larger diameter) × (smaller diameter)2]. For primary tumor endpoint experiments, mice were euthanized before the maximal tumor volumes permitted by the cantonal veterinary office of Basel Stadt were reached (1,500 mm3). For the metastasis studies, 300–500 mm3 tumors were surgically removed and the mice monitored by visual inspection and by bioluminescence. For the experimental metastasis, 100,000 MDA‐MB‐231 cells were resuspended in 100 μl of PBS and injected into the tail vein of 8‐ to 12‐week‐old NSG mice. Successful injections were confirmed immediately by bioluminescence. For bioluminescence imaging, mice were injected i.p. with 100 μl of D‐luciferin (15 mg/ml, Biosynth). Mice were anesthetized with isoflurane (2% in 1 l/min oxygen) and bioluminescence images acquired 5 min after D‐luciferin injection for 5 min using the IVIS Spectrum system (Caliper Life Sciences) or the Newton 7.0 system (Vilber). Randomization was performed based on age and body weight.
Lentiviral infections
For human NNMT knockdown, the following inducible pTRIPZ vector clones (Dharmacon) were used: V3THS_361507 (sh1), V3THS_361505 (sh2). For human PRDM5 knockdown, the following inducible SMARTvector Inducible Human PRDM5 shRNA clones (Dharmacon) were used: V3SH_224998828 (sh1), V3THS_225667375 (sh2). For human COL1A1 knockdown, the following inducible SMARTvector Inducible Human COL1A1 shRNA hEF1a clones (Dharmacon) were used: V3IHSHER_9334487 (sh1), V3IHSHER _10620068 (sh2). As a control, the pTRIPZ Inducible Lentiviral Non‐silencing (NT) shRNA Control (Dharmacon) was used. For the rescue experiments, the Precision LentiORF vectors containing NNMT ORF sequence (Dharmacon, clone PLOHS_100005471), PRDM5 ORF sequence (Dharmacon, clone OHS5898‐224630673), COL1A1 ORF sequence (Dharmacon, clone OHS5898‐202622811), or the RFP sequence (Dharmacon) were used.
A dual green fluorescent protein‐luciferase 2 reporter (eGFP‐Luc2) vector was used for in vivo bioluminescence imaging experiments. Lentiviruses were produced by PEI transfection of 293T cells as described (Duss et al, 2014). The titer of each lentiviral batch was determined in SUM159PT and MDA‐MB‐231 cells. Cell lines were infected overnight in the presence of hexamethrine bromide (8 μg/ml). For NNMT knockdown, infections were performed at a MOI of 10 viral particles per cell. Selection with 1.0–1.5 μg/ml puromycin was applied 48 h after infection for 3 days. For eGFP‐Luc2 (Liu et al, 2010), infections were performed at a MOI of 1 viral particle per cell. For rescue experiments, infections were performed at a MOI of 0.7 viral particles per cell and selected using fluorescence activated cell sorting for RFP (control vector) or GFP (NNMT ORF and eGFP‐Luc2) positivity.
Genome editing by CRISPR‐Cas9 in breast cancer cell lines
Two independent strategies were used to KO NNMT: for the KOd line, two pairs of sgRNAs that produce a deletion of exon 1 or, and for the KOs line, a single sgRNA that produces a frameshift mutation at the vicinity of the transcription start site (TSS). Single guide sequences specific for NNMT (exon 3) were designed using the Zhang's lab online CRISPR design tool (http://crispr.mit.edu/) and cloned into a modified PX330 (Addgene plasmid 42230), where the puromycin cassette was replaced with an RFP (provided by M. Buhler, FMI, Basel). The guide RNA sequences selected (based on the lowest number of predicted off‐targets and highest predicted efficiency) were the following: for the KOd approach, 5′‐CACCGAAGGGAGCTTAGGCGAACGG‐3′ and 5′‐CACCGAGGACAGCACTCCGGTCCTC‐3′; for the KOs approach, 5′‐CACCGATTTTTCTAGGTAATCCCGA‐3′. The sgRNA vectors were transduced into SUM159PT and MDA‐MB‐231 cells, followed by sorting for RFP positivity into 96‐well plates. Single cell clones were expanded and screened by PCR (KOd) and immunoblotting (KOs and KOd). The primer sequences for PCR confirmation of the KOd were: Primer pair 1: FWc: 5′‐CGTGACCCCTTTTCTTGGGA‐3′ and RVc 5′‐AAATTCCTGGCAACATGCCTC‐3′ (produces a 745‐bp band when WT and a 114‐bp band when KO); Primer pair 2: FWb 5′‐GATTTGCTAGGCGACTTGAGG‐3′ and RVc (produces a 486‐bp band when WT and no band when KO). For each group, four WT single‐cell clones, five KOd clones and five KOs clones were pooled in equal proportions to minimize undesired off‐target and clonal effects. Two additional lines (RFP and NNMT) were generated for rescue purposes by lentiviral infection of the KO pools with an RFP control vector or a plasmid containing the full ORF of human NNMT. In the MDA‐MB‐231 model, we were only able to propagate a single NNMT clone (KO1) using the single guide CRISPR‐Cas9 strategy. Infection of this clone with the Precision LentiORF RFP or NNMT generated two cell pools for rescue purposes.
To overexpress PRDM5 from its endogenous promoter in SUM159PT cells, we used a SAM‐engineered Cas9 activation complex (Konermann et al, 2015) that consists of three lentiviral vectors: (i) Lenti MS2‐P65‐HSF1_Hygro (Addgene plasmid 61426), (ii) lenti‐sgRNA‐MS2_Zeo (Addgene; plasmid 61427), and (iii) lenti‐dCAS‐VP64_Blast (Addgene 61425). sgRNA sequences were designed using Zhang's lab online CRISPR (http://sam.genome‐engineering.org) and cloned into lenti‐sgRNA‐MS2. Lenti‐sgRNA‐MS2 was digested with BsmbI and purified in a 0.8% agarose gel. The two annealed primers were ligated via the golden gate reaction (New England Biolabs). The sequences of the selected sgRNA are sgPRDM5_95, 5′‐CACCGTGACCCCAGGGCCTCAAACC‐3′ and sgPRDM5_158, 5′‐CACCGGGAACGCACGCCGCCGCGCC‐3′.
Circulating tumor cells (CTCs) quantification
MDA‐MB‐231 KO1_RFP and KO1_NNMT cells (100,000) were orthotopically injected into the fat pad of NSG mice (5 mice per group). When average primary tumor size reached 500 mm3, mice were sacrificed and blood was collected by heart puncture with a syringe (500 to 800 μl of blood per mouse). For CTC colonies count, 100 μl of blood was plated into 6 well‐plates and cultured for 10 days, in presence of blasticidin for cancer cell positive selection. For FACS analysis, 100 μl of blood was subjected to two rounds of red blood cell lysis for 10 min, and resuspended in FACS buffer. GFP‐positive, DAPI‐negative cells were detected by FACS and their abundance was assessed per million of live blood cells analyzed.
Flow cytometry
SUM159PT and MDA‐MB‐231 NNMT KO cells transduced with Precision LentiORF RFP or NNMT lentivirus were sorted for RFP‐ or GFP‐positive cells, respectively. Cell lines were detached using trypsin–EDTA, resuspended in growth medium and counted. Cells were passed through a 40‐μm strainer (Falcon) and resuspended in PBS with 1% FCS. DAPI (0.2%, Invitrogen) was added (1:250) 2 min before cell sorting. Single cells were gated on the basis of their forward and side‐scatter profiles and pulse‐width was used to exclude doublets. Dead cells (DAPI bright) were gated out. For all sorting experiments, a BD FACSAria III (Becton Dickinson) equipped with a 70‐μm nozzle was used. Flow‐conjugated antibodies used were anti‐Epcam (Biolegend, #324213, clone 9C4), anti‐CD44 (Biolegend, #338808) and anti‐CD24 (Biolegend, #311120).
3D tumorsphere cultures
For breast cancer cell line tumorsphere culture, cells were plated at 2,000–10,000 cells per ml density in ultra‐low attachment plates (Corning) for 6 days, in DMEM: F12 supplemented with 1× B27 (Gibco, Invitrogen), 20 ng/ml human EGF (PeproTech), 20 ng/ml basic FGF (PeproTech) and 1× penicillin/streptomycin (Gibco, Invitrogen). Doxycycline (1 μg/ml) was added to the medium to sustain sh RNAs expression, when adequate. Primary tumorspheres were dissociated with 0.05% trypsin and replated at the same density for additional 6 days for secondary tumorsphere assessment.
Protein lysate preparation and immunoblotting
Protein lysates were prepared in whole‐cell lysis buffer (150 mM NaCl, 10% glycerol, 1% IGEPAL, 0.5% sodium deoxycholate, 2 mM EDTA, 0.1% SDS, 20 mM Tris–HCl pH 8) supplemented with 1× protease inhibitor cocktail (Complete EDTA‐free, Roche), 1× Phosphatase Inhibitor cocktail (Roche), 0.2 mM sodium orthovanadate and 20 mM sodium fluoride, followed by sonication (5 × 30 s ON + 30 s OFF) using a Bioruptor device (Diagenode). Lysates (30–80 μg) were subjected to SDS–PAGE, transferred to PVDF membranes (Immobilon‐P, Millipore) and blocked for 1 h at room temperature with 5% milk in TBS/0.05% Tween 20. Membranes were incubated overnight at 4°C with primary antibodies and exposed to secondary HRP‐coupled anti‐mouse or anti‐rabbit antibodies (1:5,000, GE Healthcare) for 2 h at room temperature. Membranes were developed using Amersham ECL Prime Western Blotting Detection Reagent (GE Healthcare) or WesternBright Sirius HRP substrate (Advansta). The following antibodies were used: anti‐NNMT (1:1,000, ab119758, Abcam, clone OTI3D8), anti‐CD31 (Leica Biosystems, 607‐L‐CE, clone JC70A), anti‐ERK2 (1:2,000, sc‐1647, Santa Cruz), anti‐histone H3K9me3 (1:1,000, 39161, Active Motif), anti‐histone H3K4‐me3 (1:1,000, ab8580, Abcam), and anti‐histone 3 (1:1,000, 39763, Active Motif), and anti‐PRDM5 (1:500, MABE972, Merck). Blot densities were quantified using ImageJ (FIJI) and normalized to ERK2 or total Histone 3. Results are representative of at least three different experiments.
Immunofluorescence
Paraformaldehyde‐fixed cells were permeabilized with 0.2% Triton X‐100 for 10 min, washed with PBS for 10 min and blocked with 2.5% normal goat serum (Biozol) in 0.1% BSA PBS. The cells were then incubated at 4°C overnight with the following primary antibodies: anti‐vimentin (1:100, 5741, Cell Signaling Technologies) and anti‐fibronectin (1:50, ab2413, Abcam), anti 5‐methylcytosine (1:500, C15200081‐100, Diagenode), anti H3K9me3 (1:500, ab8898, Abcam), and anti H3K4me3 (1:500, 9751, Cell Signaling Technology). Goat‐anti‐mouse or goat‐anti‐rabbit secondary antibodies coupled to Alexa Fluor 488, 568 or 647 (1:200 to 1:500, Molecular Probes, Invitrogen) were used for detection. Cell nuclei were stained with 167 ng/ml DAPI (Sigma) for 15 min. For immunofluorescence, at least 200 cells were analyzed per experiment.
Histology and immunohistochemistry
All tissues were fixed in 4% paraformaldehyde for 24 h at 4°C. Samples were then dehydrated, embedded in paraffin and sectioned (3–4 μm). All immunohistochemistry experiments were performed using a Ventana DiscoveryXT instrument (Roche Diagnostics) following the Research IHC DAB Map XT procedure, except for NNMT staining of human breast TMAs, which was performed using an automated immunohistochemistry platform from Bond (Vision Biosystems). For these, slides were pre‐treated with CC1 for 45 min following primary and secondary antibodies incubation (Discovery UltraMap anti‐mouse HRP secondary antibody) and detection (Discovery ChromoMap DAB kit), both from Ventana/Roche. Slides were analyzed by a pathologist (K.M.). NNMT scores were obtained by multiplying NNMT quantity (0–100%) by NNMT intensity (0–3). These scores were grouped into the three classes of Negative/low: scores 0–100; Intermediate: scores 101–200; and Strong: scores 201–300. ERα‐indices of the cores were calculated by multiplying ERα quantity (0–100%) by ERα intensity (0–3).
For COL1A1 and PRDM5 staining of human breast TMAs, primary antibodies were incubated for 30 min at room temperature and used as follows: COL1A1 (ab138492, rabbit monoclonal, clone EPR7785, Abcam, Cambridge, UK, dilution: 1:500); PRDM5 (HPA051406, rabbit polyclonal, Sigma Aldrich, Missouri, USA, dilution: 1:100); Retrieval: Citrate buffer pH 6, 20 min. Antibody detection was performed with the BOND Polymer Refine DAB kit (Leica Biosystems) using 3,3‐diaminobenzidine as a brown chromogen. The samples were counterstained with hematoxylin. TMA slides were scanned on a 3DHISTECH Pannoramic 250 Flash II scanner (3DHISTECH, Budapest, Hungary) at a resolution of 0.194 μm/pixel. Digital slides were reviewed by four pathologists (ZV, KM, KB, VHK). The digital image analysis was carried out using HALO digital image analysis software (Indica Labs, Corrales, NM, USA). The digitized TMA slides were de‐arrayed into individual spot images of each tissue sample and linked to clinical annotations. Spots with insufficient amounts of tissue or tissue artifacts were excluded from analysis. To localize and quantify tumor and stroma tissue, a deep neural network algorithm was trained for COL1A1 and PRDM5‐stained slides, based on a pretrained DenseNet network. Adipose tissue, necrosis, erythrocyte aggregates, mucinous regions, folds, blurry regions, and glass background were excluded from further analysis. Graphical overlays were generated for each tissue class and the classification accuracy was reviewed. The total area of each tissue class was quantified in mm2. Nucleus segmentation and staining quantification for nuclei (Hematoxylin, RGB 57, 49, 137), COL1A1 (RGB 137, 68, 42), and PRDM5 (RGB 108, 64, 37) were performed in the tumor and stromal compartment. For nucleus segmentation, we used the HALO AI pre‐trained convolutional neural network which we fine‐tuned with application‐specific training examples. Pixels were classified as COL1A1‐positive if staining intensity exceeded internal controls as validated by pathologist review. The total vital tissue area in the tumor and stromal compartment, the amount of COL1A1‐positive area and the number of PRDM5‐positive were recorded for analysis with clinicopathological features.
For NNMT staining of xenograft sections, the procedure RUO Discovery Universal was used without any pre‐treatment of the slides. After incubation with blocking reagent 1:10 for 1 h at room temperature, mouse anti‐NNMT (OTI3D8, 1:200, ab119758, Abcam) was incubated in 20% donkey serum for 1 h at 37°C. Bound antibody was detected using the M.O.M kit (Vector Laboratories MP‐2400) followed by ImmPress anti‐mouse polymer reagent (Vector Laboratories) for 32 min at 37°C. For CD‐31, the procedure RUO Discovery Universal was used with CC1 pre‐treatment (40 min) and incubation for 1 h at 37°C of a rat anti‐CD31 antibody (1:50). Next, a rabbit monoclonal link antibody R18‐2 anti‐rat IgG Fc (Abcam 125900 5.4 μg/ml) was incubated for 20 min at 37°C, followed by an anti‐rabbit‐HQ conjugated antibody and an anti‐HQ‐HRP conjugated antibody (Roche Diagnostics, Manheim) incubated for 32 min at 37°C.
For COL1A1 staining, slides were pre‐treated with protease 3 (Roche Diagnostics) for 32 min, followed by 32 min of incubation with blocking buffer (Casein, surmodics, PBSC‐0100‐01). Anti‐COL1A1 primary antibodies (1:300, Abcam, ab138492) were incubated for 1 h, followed by secondary antibodies incubation (polymer anti‐rabbit, Nichirei, 414142F) for 1 h at 37°C and development with the Discovery ChromoMap DAB detection kit. Counter staining was performed with hematoxylin II and bluing reagent (Ventana, Roche diagnostics). Whole sections were scanned using a Nikon Ni‐e upright microscope coupled to a PRIOR slide loader. Acquisition was performed with a 4× AIR objective with a DS‐Fi3 camera using NIS software. Two to five representative images of 5–10 tumors of each condition were quantified manually or with Image J (Fiji).
Microscopy image acquisition
For immunofluorescence and immunohistochemistry sections, images were captured using an inverted Olympus BX63 wide‐field fluorescent microscope (20×, NA = 0.4 and 10×, NA = 0.75) equipped with a DP80 camera (pixel size 6.45 μm). Images were acquired with the CellSens software. Alternatively, a Nikon E600 Eclipse brightfield microscope was used (20×, NA = 0.5 and 10×, NA = 0.3 objectives) equipped with a Nikon DXM1200 camera (pixel size 6.7 μm) using the IMS software. For phase‐contrast imaging, we used an inverted Zeiss Axioscope (10×, NA = 0.25 and 5×, NA = 0.15) equipped with a Axiocam 503 mono 60 N‐C camera (pixel size 4.54 μm) and images were acquired using the Zen lite software. All the images were scaled appropriately.
RNA isolation and qPCR
Total RNA was extracted using the RNeasy Plus Mini Kit according to the manufacturer's protocol (Qiagen). Total RNA (1 μg) was transcribed using the iScript cDNA conversion kit from Biorad. PCR and fluorescence detection were performed using the StepOnePlus Sequence Detection System, the 7500 ABI Fast Cycler (Applied Biosystems) or the ViiA 7 real‐time PCR System (Applied Biosystems) according to the manufacturers' protocols. The reaction volume was 10 or 20 μl containing 1× TaqMan Universal PCR Master Mix (Applied Biosystems) and 25–50 ng of cDNA. 1× IDT (Integrated DNA technologies) probes were used for gene expression quantification of NNMT (Hs.PT.56a.26066181.g), GAPDH (Hs.PT.39a.22214836), HPRT1 (Hs.PT.58.v.45621572), FN1 (Hs.PT.58.21141138), COL1A1 (Hs.PT.58.15517795), SPARC (Hs.PT.58.24878442), LOXL3 (Hs.PT.58.39480927), TGFB1 (Hs.PT.58.39813975), PRDM5 (Hs.PT.58.1322571), COL4A1 (Hs.PT.58.15679435), COL4A2 (Hs.PT.58.427878), COL4A4 (Hs.PT.58.3212616), COL5A1 (Hs.PT.58.39306346), COL6A2 (Hs.PT.58.39898355), COL12A1 (Hs.PT.58.4712050), and COL13A1 (Hs.PT.58.212348). All the measurements were performed in duplicate and the arithmetic mean of the C t values was used for calculations. Target gene mean C t values were normalized to the respective housekeeping genes (GAPDH or HPRT1), mean C t values (internal reference gene, C t), and then to the experimental control. The values obtained were expressed as fold changes compared to the experimental control using the method of relative quantification.
RNA‐sequencing and analysis
mRNA‐sequencing stranded libraries were generated using the TruSeq Illumina kit according to the manufacturer's instructions. Libraries were sequenced on the Illumina HiSeq 2500 platform, with 51 cycles single‐end reads. Reads were aligned to the human genome downloaded from UCSC (genome.ucsc.edu, version hg38AnalysisSet) with STAR (version STAR/2.5.2a) with default parameters except for reporting for multi‐mappers only one hit in the final alignment files ‘‐‐outFilterMultimapNmax 10 ‐‐outSAMmultNmax 1’. Data were analyzed using the Galaxy tool (Afgan et al, 2018). Read and alignment quality control were performed using the QuasR (version 1.18.0) data package and differentially expressed genes were determined with the edgeR (version 3.20.9) Bioconductor package (Robinson et al, 2009; McCarthy et al, 2012). Pathway enrichment analysis was performed using gProfiler (Raudvere et al, 2019), Metascape (Zhou et al, 2019), and Bioplanet 2019 (Huang et al, 2019).
Targeted LC–MS analysis of histone marks (lysine‐methylations)
Sample preparation
For each sample, histones from SUM159PT cells were enriched using the Histone Purification Mini kit (Active Motif) following the manufacturer's instructions. After adding 20 μl of reaction buffer (6 M guanidine hydrochloride, 1 M HEPES, pH 8.3), each sample was reduced with 5 mM TCEP for 30 min at 60°C and alkylated with 10 mM iodoacetamide for 30 min in the dark at 25°C. The alkylation was quenched for 15 min at room temperature with 12 mM N‐acetyl‐cysteine and all free amino groups were acetylated by adding 15 μl of 0.15 M N‐acetoxy‐d3‐succinimide (in DMSO) and a 2‐h incubation at 25°C. After stopping acetylation by adding 10 μl of a 1.5 M hydroxylamine solution and waiting 15 min at 25°C, 0.1 M ammonium bicarbonate buffer was added to reduce the guanidine hydrochloride concentration to 0.5 M. Subsequently, the labeled proteins were digested by incubation with sequencing‐grade modified trypsin (1/50 w/w; Promega) overnight at 37°C. Finally, peptides were desalted on C18 reversed phase spin columns according to the manufacturer's instructions (Microspin, Harvard Apparatus), dried under vacuum and stored at −80°C until further processing.
Shotgun LC–MS analysis (identification of histone methylation sites)
Peptides (0.1 μg of each sample) were subjected to LC–MS analysis using a dual pressure LTQ‐Orbitrap Elite mass spectrometer connected to an electrospray ion source (both Thermo Fisher Scientific) as described (Ahrné et al, 2016) with a few modifications. In brief, peptide separation was carried out using an EASY nLC‐1000 system (Thermo Fisher Scientific) equipped with an RP–HPLC column (75 μm × 30 cm) packed in‐house with C18 resin (ReproSil‐Pur C18‐AQ, 1.9 μm resin; Dr. Maisch GmbH) using a linear gradient from 95% solvent A (0.15% formic acid, 2% acetonitrile) and 5% solvent B (98% acetonitrile, 0.15% formic acid) to 28% solvent B over 90 min at a flow rate of 0.2 μl/min. The data acquisition mode was set to obtain one high‐resolution MS scan in the FT part of the mass spectrometer at a resolution of 120,000 full width at half‐maximum (at m/z 400) followed by MS/MS scans in the linear ion trap of the 20 most intense ions. The charged state screening modus was enabled to exclude unassigned and singly charged ions and the dynamic exclusion duration was set to 20 s. The ion accumulation time was set to 300 ms (MS) and 50 ms (MS/MS). The collision energy was set to 35% and one microscan was acquired for each spectrum. For all LC–MS measurements, singly charged ions and ions with unassigned charge state were excluded from triggering MS2 events.
The acquired raw‐files were converted to the mascot generic file (mgf) format using the msconvert tool [part of ProteoWizard, version 3.0.4624 (2013‐6‐3)]. Using the MASCOT algorithm (Matrix Science, Version 2.4.0), the mgf files were searched against a decoy database containing normal and reverse sequences of the predicted SwissProt entries of Homo sapiens (www.uniprot.org, release date 29/06/2015) and commonly observed contaminants (in total 41,158 protein sequences) generated using the Sequence Reverser tool from the MaxQuant software (Version 1.0.13.13). The precursor ion tolerance was set to 10 ppm and fragment ion tolerance was set to 0.6 Da. The search criteria were set as follows: full Arg‐C specificity was required (cleavage after arginine residues unless followed by proline), 1 missed cleavage was allowed, carbamidomethylation (C) was set as fixed modification and oxidation (M), mono‐, di‐, and tri‐methylation (K) were set as variable modifications. Next, the database search results were imported to the Scaffold Q+ software (version 4.3.3, Proteome Software Inc.) and the peptide false identification rate was set to 1% based on the number of decoy hits.
Targeted MS (quantification of histone methylation sites)
All identified peptides carrying a methylation site and originating from histone proteins were exported and selected for quantification by targeted MS. Therefore, all peptide sequences including all methylated versions and the unmodified forms of selected histone peptides were imported into the Skyline software (version 1.4, https://brendanx‐uw1.gs.washington.edu/labkey/project/home/software/Skyline/begin.view) together with the charge state and annotated transitions found. Then, a mass isolation list comprising the precursor ion masses of all peptides was exported and used for parallel reaction monitoring (PRM)86 quantification on a Q‐Exactive HF platform. PRM mass spectrometric analysis was similar to the previous one with the following changes: an LC gradient of 60 min was used, 3e6 ions were accumulated for MS1 and MS2 and scanned at a resolution of 60,000 FWHM (at 200 m/z). Fill time was set to 150 ms for both scan types. For MS2, a normalized collision energy of 28% was employed, the ion isolation window was set to 0.4 Th and the first mass was fixed to 100 Th. Each condition was analyzed in biological triplicates. All raw files were imported into Skyline for protein/peptide quantification. To control for variation in injected sample amounts, samples were normalized using the total ion current from the MS1 scans. In addition, all generated raw files were subjected to database searching using the same search parameters as above, reducing the fragment mass tolerance to 0.02 Da. Only identified peptides were used for PRM quantification.
Targeted LC–MS analysis of SAM and SAH
Cellular concentrations of SAM and SAH were determined following the protocol from (Sperber et al, 2015). In brief, cells were quenched in a 75 mM ammonium carbonate pH 7.4 solution and flash‐frozen in liquid nitrogen. Next, a 70° ethanol solution was added for solvent metabolites extraction and frozen at −80°C. The extracts were split into two aliquots and dried under vacuum. One aliquot was dissolved in 100 μl LC buffer (40% acetonitrile, 59.9% water, 0.1% formic acid) and used to determine SAM levels by direct infusion MS analysis. The other aliquot was dissolved in 0.1% TFA and subjected to C18 clean‐up as described above for peptides. After drying, the samples were again dissolved in 20 μl of 0.1% TFA and 2 μl analyzed by selected reaction monitoring LC–MS analysis. Here, samples were analyzed on a TSQ‐Vantage triple‐quadrupole mass spectrometer coupled to an Easy nLC (both Thermo Fisher Scientific) equipped with a RP–HPLC column (75 μm × 30 cm) packed in‐house with C18 resin (ReproSil‐Pur C18–AQ, 1.9 μm resin; Dr Maisch GmbH, Ammerbuch‐Entringen, Germany) with a linear gradient from 95% solvent A (0.1% formic acid) and 5% solvent B (80% acetonitrile, 0.1% formic acid) to 28% solvent B over 40 min at a flow rate of 0.2 μl/min. A 0.7 FWHM resolution window for both Q1 and Q3 was set for parent‐ and product‐ion isolation and a cycle time of 1 s was used. For SRM analysis, SAH/SAM precursor ion masses were set to 385.24/399.24 Th and the following product ions monitored (SAH: 250.09, 136.12, 134.12/SAM: 250.09, 136.12, 298.1). Collision energies were set to 16/20 eV for SAM/SAH and Q2 CID gas was set to 1.5 mTorr. Transition intensities were determined using the QualBrowser software (Thermo Fisher Scientific) and used for quantification. MS intensities were calibrated by analyzing a calibration mixture containing 500 ng/ml of SAM and SAH. All the samples were analyzed as three biological replicates (n = 3). Due to the low‐binding affinities of SAM for the LC–MS setup employed, SAM was analyzed by direct infusion MS. Therefore, the second sample aliquot (not C18 cleaned) was injected into the MS at a flow rate of 10 μl/min using product ion monitoring. A 0.7 FWHM resolution window for both Q1 and Q3 was set for parent‐ and product‐ion isolation. Fragmentation of parent‐ions was performed in Q2 at 1.5 mTorr, collision energy was set to 16 eV with scan time of 0.5 s. Parent mass was set to 399.24 and the intensity of the product mass 250.09 was monitored (QualBrowser) and used for quantification. MS intensities were calibrated using a calibration solution containing 200 ng/ml of SAM dissolved in the same LC buffer mentioned above.
Global proteomics analysis using tandem mass tags (TMT)
SUM159PT cells were collected and lysed in 50 μl lysis buffer (1% sodium deoxycholate (SDC), 0.1 M TRIS, 10 mM TCEP, pH 8.5) using strong ultra‐sonication (10 cycles, Bioruptor, Diagnode). Protein concentration was determined by BCA assay (Thermo Fisher Scientific). Sample aliquots containing 50 μg of total proteins were reduced for 10 min at 95°C and alkylated in 15 mM chloroacetamide for 30 min at 37°C. Proteins were digested by incubation with sequencing‐grade modified trypsin (1/50, w/w; Promega, Madison, Wisconsin) overnight at 37°C. The peptides were then cleaned up using iST cartridges (PreOmics, Munich, Germany) according to the manufacturer's instructions using an RESOLVEX® A200 positive pressure workstation (Tecan Group Ltd., Männedorf, Switzerland). Samples were dried under vacuum and stored at −80°C until further use.
Sample aliquots comprising 5 μg of peptides were labeled with isobaric tandem mass tags (TMTpro 16‐plex, Thermo Fisher Scientific). Peptides were resuspended in 10 μl labelling buffer (2 M urea, 0.2 M HEPES, pH 8.3) by sonication and 2.5 μl of each TMT reagent was added to the individual peptide samples, followed by a 1 h incubation at 25°C and shaking at 32 g. To control for ratio distortion during quantification, a peptide calibration mixture consisting of six digested standard proteins mixed in different amounts was added to each sample before TMT labeling as previously described (Ahrné et al, 2016). To quench the labeling reaction, 0.75 μl aqueous 1.5 M hydroxylamine solution was added and samples were incubated for another 5 min at 25°C at 32 g, followed by pooling of all samples. The pH of the sample pool was increased to 11.9 by adding 1 M phosphate buffer (pH 12) and incubated for 20 min at 25°C and shaking at 500 rpm to remove TMT labels linked to peptide hydroxyl groups. Subsequently, the reaction was stopped by adding 2 M hydrochloric acid until a pH < 2 was reached. Finally, peptide samples were further acidified using 5% TFA, desalted using Sep‐Pak Vac 1 cc (50 mg) C18 cartridges (Waters) according to the manufacturer's instructions and dried under vacuum.
TMT‐labeled peptides were fractionated by high‐pH reversed phase separation using a XBridge Peptide BEH C18 column (3.5 μm, 130 Å, 1 × 150 mm, Waters) on an Agilent 1260 Infinity HPLC system. Peptides were loaded on the column in buffer A (20 mM ammonium formate in water, pH 10) and eluted using a two‐step linear gradient from 2 to 10% in 5 min and then to 50% buffer B (20 mM ammonium formate in 90% acetonitrile, pH 10) over 55 min at a flow rate of 42 μl/min. Elution of peptides was monitored with a UV detector (215, 254 nm) and a total of 36 fractions were collected, pooled into 12 fractions using a post‐concatenation strategy as previously described (Buescher et al, 2010) and dried under vacuum. Dried peptides were resuspended in 0.1% aqueous formic acid and subjected to LC–MS/MS analysis using a Q Exactive HF Mass Spectrometer fitted with an EASY‐nLC 1000 (both Thermo Fisher Scientific) and a custom‐made column heater set to 60°C. Peptides were resolved using an RP–HPLC column (75 μm × 30 cm) packed in‐house with C18 resin (ReproSil‐Pur C18–AQ, 1.9 μm resin; Dr. Maisch GmbH) at a flow rate of 0.2 μl/min. The following gradient was used for peptide separation: from 5% B to 15% B over 10 min to 30% B over 60 min to 45% B over 20 min to 95% B over 2 min followed by 18 min at 95% B. Buffer A was 0.1% formic acid in water and buffer B was 80% acetonitrile, 0.1% formic acid in water.
The mass spectrometer was operated in DDA mode with a total cycle time of approximately 1 s. Each MS1 scan was followed by high‐collision‐dissociation (HCD) of the 10 most abundant precursor ions with dynamic exclusion set to 30 s. For MS1, 3e6 ions were accumulated in the Orbitrap over a maximum time of 100 ms and scanned at a resolution of 120,000 FWHM (at 200 m/z). MS2 scans were acquired at a target setting of 1e5 ions, maximum accumulation time of 100 ms and a resolution of 30,000 FWHM (at 200 m/z). Singly charged ions and ions with unassigned charge state were excluded from triggering MS2 events. The normalized collision energy was set to 30%, the mass isolation window was set to 1.1 m/z and one microscan was acquired for each spectrum.
The acquired raw files were analyzed using the SpectroMine software (Biognosis AG, Schlieren, Switzerland). Spectra were searched against a human database consisting of 20,350 protein sequences (SwissProt entries downloaded from Uniprot on 2020/4/17) and 392 commonly observed contaminants. Standard Pulsar search settings for TMT 16 pro (“TMTpro_Quantification”) were used and resulting identification and corresponding quantitative values were exported on the PSM level using the “Export Report” function. Acquired reporter ion intensities in the experiments were employed for automated quantification and statistical analysis using an in‐house developed SafeQuant R script (v2.3). This analysis included adjustment of reporter ion intensities, global data normalization by equalizing the total reporter ion intensity across all channels, summation of reporter ion intensities per protein and channel, calculation of protein abundance ratios and testing for differential abundance using empirical Bayes moderated t‐statistics. Finally, the calculated P‐values were corrected for multiple testing using the Benjamini−Hochberg method.
Chromatin immunoprecipitation (ChIP)‐sequencing and data analysis
SUM159PT cells were subjected to Chromatin ImmunoPrecipitation (ChIP). All the reagents were purchased from Sigma‐Aldrich. Sample preparation was performed following published protocols (Mohn et al, 2008) with a few modifications. After cross‐linking for 10 min in 1× fixing solution [from 11× fixing solution: 11% formaldehyde, 50 mM Hepes pH 8.0 (set with NaOH), 1 mM EDTA, 0.5 mM EGTA, 100 mM NaCl, Protease inhibitor cocktail (Complete, Roche)], cells were quenched with 0.125 M glycine for 10 min at 4°C. Next, samples were washed twice with cold PBS and protease inhibitors, collected by centrifugation, followed by resuspension in Buffer 1 (10 mM Tris pH 8.0, 10 mM EDTA pH 8.0, 0.5 mM EGTA, 0.25% Triton X‐100, 1× Protease Inhibitor Cocktail). After centrifugation, nuclei were isolated with Buffer 2 (10 mM Tris pH 8.0, 1 mM EDTA pH 8, 0.5 mM EGTA, 200 mM NaCl, 1× Protease Inhibitor Cocktail). After a brief wash in Buffer 2, nuclei were lysed with Lysis Buffer 1 containing 50 mM Hepes/KOH pH 7.5, 500 mM NaCl, 1 mM EDTA, 1% Triton X100, 0.1% sodium deoxycholate, 0.1%SDS, and 1× Protease Inhibitor Cocktail, followed by sonication using a Bioruptor Pico machine (Diagenode). Lysates were centrifuged and pre‐cleared for 1 h at 4°C with tRNA (5 mg/ml, Sigma) and pre‐blocked with a mix of 4:1 Protein A:Protein G Dynabeads (ThermoScientific). A fraction of the sample was frozen and represents the input sample. The lysates were further incubated with anti‐H3K9me3 antibody (39161, ActiveMotif) overnight at 4°C with overhead shaking. The next day, pre‐blocked Dynabeads were incubated with the samples for 3 h at 4°C with overhead shaking. The magnetic beads were collected in a magnetic rack and subjected to one washing in cold low salt lysis buffer (50 mM Hepes/KOH pH 7.5, 150 mM NaCl, 1 mM EDTA, 1% Triton X100, 0.1% sodium deoxycholate, 0.1%SDS, 1× Protease Inhibitor Cocktail), followed by two washings in Lysis Buffer 1, two washings in DOC buffer (10 mM Tris pH 8, 0.25 M LiCl, 0.5% NP‐40, 0.5% sodium deoxycholate, 1 mM EDTA, 1× protease inhibitor cocktail) and a final wash in TE buffer pH 8.0. The chromatin was eluted with freshly prepared Elution Buffer (1% SDS, 0.1 M NaHCO3) and reverse crosslinked in a solution containing 10 mM EDTA, 40 mM Tris pH 6.5, 50 μg/ml Proteinase K for 2.5 h at 55°C, followed by overnight incubation at 65°C. The DNA was purified using a standard phenol‐chloroform‐isoamyl alcohol protocol. Briefly, 1 volume of phenol‐chloroform‐isoamyl alcohol was added to the DNA, followed by a 0.1 volume of sodium acetate (3 M, pH 5.2), 2 volumes of 100% ethanol and 20 μg/ml glycogen. After centrifugation, the pellets were washed in ice cold 70% ethanol and eluted in EB buffer. 10 ng of DNA was used for the library preparation using the KAPA Hyper Prep Kit (Roche), according to the manufacturer's instructions. QC of libraries was done with Fragment Analyzer using the High Sensitivity NGS Fragment Analysis Kit (both from AATI). The DNA was sequenced following the manufacturer's instructions using the Illumina NextSeq 500 High Output v2 kit (75 cycles in multiplexed run to obtain 81‐bp single‐end reads). The Illumina NextSeq 500 RTA software version was 2.4.11 and the base calling version was bcl2fastq v2.20.0.422.
Reads were aligned with bowtie2 (version Bowtie2/2.3.2) to the human genome downloaded from UCSC (genome.ucsc.edu, version hg38AnalysisSet). The output was sorted and indexed with samtools (version SAMtools/1.7). Duplicated reads were marked with picard (version picard/2.9.2). All the subsequent gene expression data analysis was done within the R software (R Foundation for Statistical Computing, Vienna, Austria). Coverage tracks per sample were generated by tiling the genome in 20‐bp windows, counting overlapping reads per window using the function bamCount from the bioconductor package bamsignals (bioconductor version 3.6) and exporting these window counts in bigWig format using the export function of the bioconductor package rtracklayer. Read and alignment quality was evaluated using the qQCReport function of the bioconductor package QuasR (version 1.18.0). For each sample, peaks were called with macs2 (version MACS2/2.1.1.20160309) using the options ‘‐q 0.01 ‐‐nomodel ‐‐shift −75 ‐‐extsize 150 ‐g 2,700,000,000 ‐‐keep‐dup all’. Called peaks were merged across biological replicates. The maximal peak distance for merging was set to the average fragment size (150). The log fold‐change over input was calculated for this merged peak set (based on the total library size in each sample) and filtered for a log2[fold‐change] > 1. The resulting merged and filtered peaks were converted to bigBed format using the UCSC command line tool bedToBigBed. Promoters were defined as ±1 kb around gene TSS. Differentially bound regions (peaks or promoters) were identified using the edgeR package (version 3.20.9). For each pair‐wise comparison, peaks were classified as ‘genotype specific’, i.e., WT, KOs or KOd if the FDR was less than 0.05 and log2 difference in binding was at least 1. Otherwise, the peaks were classified as ‘no‐changing’. Enrichment of transcription factor binding sites was tested for each genotype specific set of peaks using the ‘no‐changing’ peaks as a background. ‘findMotifs.pl’ from HOMER suite (version 4.9; Heinz et al, 2010).
Genome‐wide DNA methylation profiling by microarray
Total genomic DNA from SUM159PT WT, KOs and KOd was isolated, including RNAse A treatment, according to the manufacturer's protocol (Macherey Nagel, 740952.50). Concentration was measured by nanodrop and 1 μg of input DNA was used for bisulphite conversion using the EZ‐96DNA Methylation‐Lightning™ MagPrep kit (D5046, Zymo Research). Bisulphite‐treated samples were hybridized on Human Infinium Methylation EPIC BeadChip to measure global DNA methylation on CpG. Illumina's Genome Studio software V2.0 was used to extract the raw signal intensities of the 850 k probes. Probes were filtered out when the standard deviation among the biological replicates was > 0.05. Methylation levels per probe were computed as average Beta (β) values βv = M/(M + U + 100), where M > 0 and U > 0 denote the methylated and unmethylated signal intensities, respectively, measured by the Illumina 850 k array. Differentially methylated CpG in the comparisons SUM159PT WT versus KOs/KOd were identified when the difference in average β values was > 0.3.
Methyl DNA immune‐precipitation (MedIP) qPCR
To perform 5‐methylcytosine immunoprecipitation, SUM159PT WT, KOs and KOd were grown at 80% confluence and collected in ice‐cold PBS. DNA was isolated using a kit (Macherey Nagel, 740952.50) and 5 μg of DNA resuspended in 300 μl of TE Buffer (10 mM Tris–HCl pH 8,1 mM EDTA). DNA was sonicated using a Bioruptor Pico device (Diagenode; 8 × 30 s ON + 30 s OFF). 20 μl of input DNA was collected and stored at −20°C and 120 μl of TE buffer was added to the remaining DNA for IP. Samples were incubated for 5 min at 95°C for denaturation, then cooled down on ice for 15 min. For immunoprecipitation, 100 μl of 5× IP buffer (50 mM Na‐phosphate pH 7, 0.7 NaCl, 0.25% Triton X‐100) and 1.5 μg of 5‐methylcytosine (5‐mC) antibodies (clone 33D3, C15200081‐100, Diagenode) or 1.5 μg of control IgGs (eBioscience, 16‐5098‐85) were added to the mix for overnight incubation at 4°C with 70 g agitation. The next day, 30 μl of magnetic beads prewashed in TE Buffer were added to the mix and incubated for 2 h in a rotary shaker at 4°C. Precipitated 5‐mC DNA was then washed 3 times with 1× IP buffer using a magnetic rack, resuspended in 250 μl of digestion buffer (50 mM Tris–HCl pH 8, 10 mM EDTA, 0.5% SDS) and supplemented with 50 μg of proteinase K. Samples were incubated for 3 h at 55°C in a thermomixer with 120 g agitation. To isolate precipitated DNA, 500 μl of a mixture of phenol/isoamylic alcohol‐chloroform (Sigma P3803‐400ML) was added to the mix and vortexed vigorously for 30 s. Samples were centrifuged at room temperature for 5 min at 14,000 × g and the aqueous phase transferred to a new Eppendorf tube for DNA precipitation. 0.1 vol of 3 M sodium acetate, 2.5 vol of ethanol and 20 μg of glycogen (Thermo Scientific, R0561) were added to the sample, followed by vortexing and incubation at −80°C for 1 h 30 min. After 30 min of centrifugation at 4°C and 14,000 × g, DNA pellets were rinsed with 75% ethanol, dried at 50°C for 20 min and resuspended in 50 μl of water. For performing qPCR, 2 μl of each sample were used with the following program: 95°C – 30 s, 58°C – 30 s, 72°C – 30 s (×40). Results are displayed as fold enrichment of IP against control IgGs. The sequences of the DNA probes used for qPCR are the following: PRDM5_F, GGAGGACTTCAGGGAGAACC; PRDM5_R, GGGATTCTGGGAGGAAAACT; COL1A1_F, CGCCAAAGTTTCTCATCCTC; COL1A1_R, GCATTTGAAGCCCAAGATGT; COL4A1_4A2_F, CCTCATCCTGCGCTAAACTC; COL4A1_4A2_R, ATGGGAAAGGGAGGAAGAGA; COL4A4_F, GCGCCTCCCGCTTAATCT; COL4A4_R, GGATCCAGGGTAAGGGGTTA; COL12A1_F, GAGAATCCCAGGAGGAGAGG; COL12A1_R, ACCTTCTCAGGCGTTTCGTA; COL13A1_F, CGGCACTTCCTCTCCTACTG; COL13A1_R, ATCCTCTCGCGTCTTGAGAA.
Statistical analysis
Standard laboratory randomization procedure was used for cell line groups and animals of the same age and sex. The investigators were not blinded to allocation during experiments and outcome assessment. The number of mice was calculated by performing power analysis using data from small pilot experiments. Values represent the means ± SEM or ±SD. For animal tumor incidence studies, the Kaplan–Meier plots were generated using the survival calculation tool from GraphPad Prism and significance was calculated using the log‐rank test. The variance was similar between groups that we compared. For the human breast cancer patient data, survival curves were generated using the SPSS software and significance was calculated using the log‐rank test. Depending on the type of experiment, data were tested for normal distribution and analyzed using unpaired Student's t‐test, non‐parametric Mann–Whitney U‐test, log‐rank test, Kruskal–Wallis test, or two‐way ANOVA, as indicated in the Figure legends. Experimental replicates are independent experiments. Technical replicates are tests or assays run on the same sample multiple times.
Author contributions
Joana Pinto Couto: Conceptualization; formal analysis; supervision; funding acquisition; validation; investigation; methodology; writing – original draft; project administration. Milica Vulin: Conceptualization; formal analysis; supervision; funding acquisition; validation; investigation; methodology; writing – original draft; project administration. Charly Jehanno: Conceptualization; formal analysis; supervision; funding acquisition; validation; investigation; methodology; writing – original draft; project administration; writing – review and editing. Marie‐May Coissieux: Formal analysis; investigation; methodology. Baptiste Hamelin: Investigation; methodology. Alexander Schmidt: Resources; data curation; formal analysis. Robert Ivanek: Resources; data curation; formal analysis; methodology. Atul Sethi: Resources; data curation; formal analysis. Konstantin Bräutigam: Formal analysis; investigation; visualization. Anja L Frei: Formal analysis; investigation; visualization. Carolina Hager: Investigation. Madhuri Manivannan: Investigation. Jorge Gómez‐Miragaya: Data curation; formal analysis. Milan MS Obradović: Investigation; methodology. Zsuzsanna Varga: Resources; supervision; investigation; methodology. Viktor H Koelzer: Resources; supervision; investigation; methodology. Kirsten D Mertz: Resources; supervision; investigation; methodology. Mohamed Bentires‐Alj: Conceptualization; resources; supervision; writing – original draft; project administration.
Disclosure and competing interests statement
MV, CJ, ASc, ZV, KDM, KB, ALF, CH, BH, VHK, M‐MC, BH, JG‐M and RI declare no competing financial interests. JPC is an employee of Novartis. ASe and MMSO are employees of F. Hoffmann–La Roche. MB‐A owns equities in and has received laboratory support and compensation from Novartis, and served as consultant for Basilea.
Supporting information
Appendix
Expanded View Figures PDF
Dataset EV1
Dataset EV2
Dataset EV3
PDF+
Acknowledgements
We thank the members of the Bentires‐Alj laboratory for advices and discussions. The authors are grateful to the Genomics Core Facility at the BSSE‐ETHZ Basel for the Chip library preparation and sequencing and to the Animal Facilities of the University of Basel and FMI. The authors thank the following people and facilities at the FMI and University of Basel for the experimental support: Sandrine Bichet and Diego Calabrese from the Histology Core Facilities, Hubertus Kohler, Lorenzo Raeli and Emmanuel Traunecker from the FACS Facilities and the whole Imaging Core Facilities, in particular Katrin Volkmann, Jan Eglinger, Mike Abanto and Loïc Sauteur. We thank Zora Baumann for performing the intracardiac blood sampling. We would also like to thank Rabih Murr (Department of Genetic Medicine and Development – Faculty of Medicine, University of Geneva) for advices on ChIP procedures. We thank Susanne Dettwiler and Fabiola Prutek at the Department of Pathology and Molecular Pathology, University Hospital Zurich for outstanding collaboration and technical assistance in generating the TMAs and staining. We thank Charlotte Kuperwasser and Steve Ethier for the SUM159PT cell line. JPC was supported by an EMBO Long Term fellowship and a Marie Skłodowska‐Curie Actions Intra‐European Fellowship (reference MetabBC). CJ was supported by a Marie Skłodowska‐Curie Actions Intra‐European Fellowship (Horizon 2020, Project EPICAN 841872) and the Excellence Junior Research Fund of the University of Basel. We also thank the Hemmi Foundation for supporting this research project and for awarding CJ with the Hemmi Foundation price. VHK gratefully acknowledges additional funding by the Promedica Foundation (F‐87701‐41‐01). The laboratory is further supported by the Swiss National Science Foundation, the European Research Council (ERC advanced grant 694033 STEM‐BCPC), Novartis, the Krebsliga Beider Basel, the Swiss Cancer League, the Swiss Personalized Health Network (Swiss Personalized Oncology driver project), the Medical Faculty and Department of Surgery of the University Hospital Basel.
The EMBO Journal (2023) 42: e112559
Data availability
RNA‐sequencing and ChIP‐sequencing data were deposited on the Gene Expression Omnibus (GEO) database with the GSE114877 accession number (/https://www.ncbi.nlm.nih.gov/geo/query/acc.cgi?acc=GSE114877). DNA methylation array data were deposited on the GEO database with the GSE182073 accession number (https://www.ncbi.nlm.nih.gov/geo/query/acc.cgi?acc=GSE182073). The mass spectrometry proteomics data have been deposited in the ProteomeXchange Consortium via the PRIDE partner repository with the dataset identifier PXD027964 (https://www.ebi.ac.uk/pride/archive/projects/PXD027964).
References
- Abeshouse A, Ahn J, Akbani R, Ally A, Amin S, Andry CD, Annala M, Aprikian A, Armenia J, Arora A et al (2015) The molecular taxonomy of primary prostate cancer. Cell 163: 1011–1025 [DOI] [PMC free article] [PubMed] [Google Scholar]
- Afgan E, Baker D, Batut B, Van Den Beek M, Bouvier D, Ech M, Chilton J, Clements D, Coraor N, Grüning BA et al (2018) The galaxy platform for accessible, reproducible and collaborative biomedical analyses: 2018 update. Nucleic Acids Res 46: W537–W544 [DOI] [PMC free article] [PubMed] [Google Scholar]
- Ahrné E, Glatter T, Viganò C, Von Schubert C, Nigg EA, Schmidt A (2016) Evaluation and improvement of quantification accuracy in isobaric mass tag‐based protein quantification experiments. J Proteome Res 15: 2537–2547 [DOI] [PubMed] [Google Scholar]
- Anastassiou D, Rumjantseva V, Cheng W, Huang J, Canoll PD, Yamashiro DJ, Kandel JJ (2011) Human cancer cells express slug‐based epithelial‐mesenchymal transition gene expression signature obtained in vivo. BMC Cancer 11: 529 [DOI] [PMC free article] [PubMed] [Google Scholar]
- Bell D, Berchuck A, Birrer M, Chien J, Cramer DW, Dao F, Dhir R, Disaia P, Gabra H, Glenn P et al (2011) Integrated genomic analyses of ovarian carcinoma. Nature 474: 609–615 [DOI] [PMC free article] [PubMed] [Google Scholar]
- Bergers G, Fendt SM (2021) The metabolism of cancer cells during metastasis. Nat Rev Cancer 21: 162–180 [DOI] [PMC free article] [PubMed] [Google Scholar]
- Bond CE, Bettington ML, Pearson SA, McKeone DM, Leggett BA, Whitehall VLJ (2015) Methylation and expression of the tumour suppressor, PRDM5, in colorectal cancer and polyp subgroups. BMC Cancer 15: 20 [DOI] [PMC free article] [PubMed] [Google Scholar]
- Britschgi A, Duss S, Kim S, Couto JP, Brinkhaus H, Koren S, De Silva D, Mertz KD, Kaup D, Varga Z et al (2017) The hippo kinases LATS1 and 2 control human breast cell fate via crosstalk with ERα. Nature 541: 541–545 [DOI] [PMC free article] [PubMed] [Google Scholar]
- Buescher JM, Moco S, Sauer U, Zamboni N (2010) Ultrahigh performance liquid chromatography‐tandem mass spectrometry method for fast and robust quantification of anionic and aromatic metabolites. Anal Chem 82: 4403–4412 [DOI] [PubMed] [Google Scholar]
- Chaffer CL, San Juan BP, Lim E, Weinberg RA (2016) EMT, cell plasticity and metastasis. Cancer Metastasis Rev 35: 645–654 [DOI] [PubMed] [Google Scholar]
- Charafe‐Jauffret E, Ginestier C, Monville F, Finetti P, Adélaïde J, Cervera N, Fekairi S, Xerri L, Jacquemier J, Birnbaum D et al (2006) Gene expression profiling of breast cell lines identifies potential new basal markers. Oncogene 25: 2273–2284 [DOI] [PubMed] [Google Scholar]
- Chiang AC, Massagué J (2008) Molecular basis of metastasis. N Engl J Med 359: 2814–2823 [DOI] [PMC free article] [PubMed] [Google Scholar]
- Correia AL, Guimaraes JC, Auf der Maur P, De Silva D, Trefny MP, Okamoto R, Bruno S, Schmidt A, Mertz K, Volkmann K et al (2021) Hepatic stellate cells suppress NK cell‐sustained breast cancer dormancy. Nature 594: 566–571 [DOI] [PubMed] [Google Scholar]
- Cox TR (2021) The matrix in cancer. Nat Rev Cancer 21: 217–238 [DOI] [PubMed] [Google Scholar]
- Curtis C, Shah SP, Chin SF, Turashvili G, Rueda OM, Dunning MJ, Speed D, Lynch AG, Samarajiwa S, Yuan Y et al (2012) The genomic and transcriptomic architecture of 2,000 breast tumours reveals novel subgroups. Nature 486: 346–352 [DOI] [PMC free article] [PubMed] [Google Scholar]
- Dai Z, Ramesh V, Locasale JW (2020) The evolving metabolic landscape of chromatin biology and epigenetics. Nat Rev Genet 21: 737–753 [DOI] [PMC free article] [PubMed] [Google Scholar]
- Deasy SK, Erez N (2022) A glitch in the matrix: organ‐specific matrisomes in metastatic niches. Trends Cell Biol 32: 110–123 [DOI] [PubMed] [Google Scholar]
- Du J, Johnson LM, Jacobsen SE, Patel DJ (2015) DNA methylation pathways and their crosstalk with histone methylation. Nat Rev Mol Cell Biol 16: 519–532 [DOI] [PMC free article] [PubMed] [Google Scholar]
- Duss S, Brinkhaus H, Britschgi A, Cabuy E, Frey DM, Schaefer DJ, Bentires‐Alj M (2014) Mesenchymal precursor cells maintain the differentiation and proliferation potentials of breast epithelial cells. Breast Cancer Res 16: R60 [DOI] [PMC free article] [PubMed] [Google Scholar]
- Eckert MA, Coscia F, Chryplewicz A, Chang JW, Hernandez KM, Pan S, Tienda SM, Nahotko DA, Li G, Blaženović I et al (2019) Proteomics reveals NNMT as a master metabolic regulator of cancer‐associated fibroblasts. Nature 569: 723–728 [DOI] [PMC free article] [PubMed] [Google Scholar]
- Elia I, Doglioni G, Fendt SM (2018) Metabolic hallmarks of metastasis formation. Trends Cell Biol 28: 673–684 [DOI] [PubMed] [Google Scholar]
- Elia I, Rossi M, Stegen S, Broekaert D, Doglioni G, van Gorsel M, Boon R, Escalona‐Noguero C, Torrekens S, Verfaillie C et al (2019) Breast cancer cells rely on environmental pyruvate to shape the metastatic niche. Nature 568: 117–121 [DOI] [PMC free article] [PubMed] [Google Scholar]
- Erler JT, Bennewith KL, Nicolau M, Dornhöfer N, Kong C, Le QT, Chi JTA, Jeffrey SS, Giaccia AJ (2006) Lysyl oxidase is essential for hypoxia‐induced metastasis. Nature 440: 1222–1226 [DOI] [PubMed] [Google Scholar]
- Fang S, Dai Y, Mei Y, Yang M, Hu L, Yang H, Guan X, Li J (2019) Clinical significance and biological role of cancer‐derived type I collagen in lung and esophageal cancers. Thorac Cancer 10: 277–288 [DOI] [PMC free article] [PubMed] [Google Scholar]
- Ferraro GB, Ali A, Luengo A, Kodack DP, Deik A, Abbott KL, Bezwada D, Blanc L, Prideaux B, Jin X et al (2021) Fatty acid synthesis is required for breast cancer brain metastasis. Nat Cancer 2: 414–428 [DOI] [PMC free article] [PubMed] [Google Scholar]
- Galli GG, Honnens de Lichtenberg K, Carrara M, Hans W, Wuelling M, Mentz B, Multhaupt HA, Fog CK, Jensen KT, Rappsilber J et al (2012) Prdm5 regulates collagen gene transcription by association with RNA polymerase II in developing bone. PLoS Genet 8: e1002711 [DOI] [PMC free article] [PubMed] [Google Scholar]
- George J, Lim JS, Jang SJ, Cun Y, Ozretia L, Kong G, Leenders F, Lu X, Fernández‐Cuesta L, Bosco G et al (2015) Comprehensive genomic profiles of small cell lung cancer. Nature 524: 47–53 [DOI] [PMC free article] [PubMed] [Google Scholar]
- Getz G, Gabriel SB, Cibulskis K, Lander E, Sivachenko A, Sougnez C, Lawrence M, Kandoth C, Dooling D, Fulton R et al (2013) Integrated genomic characterization of endometrial carcinoma. Nature 497: 67–73 [DOI] [PMC free article] [PubMed] [Google Scholar]
- Ghandi M, Huang FW, Jané‐Valbuena J, Kryukov GV, Lo CC, McDonald ER, Barretina J, Gelfand ET, Bielski CM, Li H et al (2019) Next‐generation characterization of the cancer cell line encyclopedia. Nature 569: 503–508 [DOI] [PMC free article] [PubMed] [Google Scholar]
- Gotzmann J, Fischer ANM, Zojer M, Mikula M, Proell V, Huber H, Jechlinger M, Waerner T, Weith A, Beug H et al (2006) A crucial function of PDGF in TGF‐β‐mediated cancer progression of hepatocytes. Oncogene 25: 3170–3185 [DOI] [PubMed] [Google Scholar]
- Gupta PB, Pastushenko I, Skibinski A, Blanpain C, Kuperwasser C (2019) Phenotypic plasticity: driver of cancer initiation, progression, and therapy resistance. Cell Stem Cell 24: 65–78 [DOI] [PMC free article] [PubMed] [Google Scholar]
- Györffy B, Lanczky A, Eklund AC, Denkert C, Budczies J, Li Q, Szallasi Z (2010) An online survival analysis tool to rapidly assess the effect of 22,277 genes on breast cancer prognosis using microarray data of 1,809 patients. Breast Cancer Res Treat 123: 725–731 [DOI] [PubMed] [Google Scholar]
- Han XH, Caron JM, Brooks PC (2020) Cryptic collagen elements as signaling hubs in the regulation of tumor growth and metastasis. J Cell Physiol 235: 9005–9020 [DOI] [PMC free article] [PubMed] [Google Scholar]
- Hanahan D (2022) Hallmarks of cancer: new dimensions. Cancer Discov 12: 31–46 [DOI] [PubMed] [Google Scholar]
- Heino J (2014) Cellular signaling by collagen‐binding integrins. Adv Exp Med Biol 819: 143–155 [DOI] [PubMed] [Google Scholar]
- Heinz S, Benner C, Spann N, Bertolino E, Lin YC, Laslo P, Cheng JX, Murre C, Singh H, Glass CK (2010) Simple combinations of lineage‐determining transcription factors prime cis‐regulatory elements required for macrophage and B cell identities. Mol Cell 38: 576–589 [DOI] [PMC free article] [PubMed] [Google Scholar]
- Ho CK, Mofarrahi M, Vassilakopoulos T, Maltais F, Sigala I, Debigare R, Bellenis I, Hussain SNA (2010) Expression and functional significance of nicotinamide n‐methyl transferase in skeletal muscles of patients with chronic obstructive pulmonary disease. Am J Respir Crit Care Med 181: 797–805 [DOI] [PubMed] [Google Scholar]
- Hoadley KA, Yau C, Hinoue T, Wolf DM, Lazar AJ, Drill E, Shen R, Taylor AM, Cherniack AD, Thorsson V et al (2018) Cell‐of‐origin patterns dominate the molecular classification of 10,000 tumors from 33 types of cancer. Cell 173: 291–304 [DOI] [PMC free article] [PubMed] [Google Scholar]
- Hong S, Moreno‐Navarrete JM, Wei X, Kikukawa Y, Tzameli I, Prasad D, Lee Y, Asara JM, Fernandez‐Real JM, Maratos‐Flier E et al (2015) Nicotinamide N‐methyltransferase regulates hepatic nutrient metabolism through Sirt1 protein stabilization. Nat Med 21: 887–894 [DOI] [PMC free article] [PubMed] [Google Scholar]
- Huang R, Grishagin I, Wang Y, Zhao T, Greene J, Obenauer JC, Ngan D, Nguyen DT, Guha R, Jadhav A et al (2019) The NCATS BioPlanet – an integrated platform for exploring the universe of cellular signaling pathways for toxicology, systems biology, and chemical genomics. Front Pharmacol 10: 445 [DOI] [PMC free article] [PubMed] [Google Scholar]
- Jehanno C, Vulin M, Richina V, Richina F (2022) Phenotypic plasticity during metastatic colonization. Trends Cell Biol 32: 1–14 [DOI] [PubMed] [Google Scholar]
- Jun BH, Guo T, Libring S, Chanda MK, Paez JS, Shinde A, Wendt MK, Vlachos PP, Solorio L (2020) Fibronectin‐expressing mesenchymal tumor cells promote breast cancer metastasis. Cancers (Basel) 12: 2553 [DOI] [PMC free article] [PubMed] [Google Scholar]
- Jung J, Kim LJY, Wang X, Wu Q, Sanvoranart T, Hubert CG, Prager BC, Wallace LC, Jin X, Mack SC et al (2017) Nicotinamide metabolism regulates glioblastoma stem cell maintenance. JCI Insight 2: e90019 [DOI] [PMC free article] [PubMed] [Google Scholar]
- Kalluri R (2016) The biology and function of fibroblasts in cancer. Nat Rev Cancer 16: 582–598 [DOI] [PubMed] [Google Scholar]
- Kim J, Hong SJ, Lim EK, Yu YS, Kim SW, Roh JH, Do IG, Joh JW, Kim DS (2009) Expression of nicotinamide N‐methyltransferase in hepatocellular carcinoma is associated with poor prognosis. J Exp Clin Cancer Res 28: 20 [DOI] [PMC free article] [PubMed] [Google Scholar]
- Klein CA (2020) Cancer progression and the invisible phase of metastatic colonization. Nat Rev Cancer 20: 681–694 [DOI] [PubMed] [Google Scholar]
- Koboldt DC, Fulton RS, McLellan MD, Schmidt H, Kalicki‐Veizer J, McMichael JF, Fulton LL, Dooling DJ, Ding L, Mardis ER et al (2012) Comprehensive molecular portraits of human breast tumours. Nature 490: 61–70 [DOI] [PMC free article] [PubMed] [Google Scholar]
- Konermann S, Brigham MD, Trevino AE, Joung J, Abudayyeh OO, Barcena C, Hsu PD, Habib N, Gootenberg JS, Nishimasu H et al (2015) Genome‐scale transcriptional activation by an engineered CRISPR‐Cas9 complex. Nature 517: 583–588 [DOI] [PMC free article] [PubMed] [Google Scholar]
- Kuo WH, Chang YY, Lai LC, Tsai MH, Hsiao CK, Chang KJ, Chuang EY (2012) Molecular characteristics and metastasis predictor genes of triple‐negative breast cancer: a clinical study of triple‐negative breast carcinomas. PLoS ONE 7: e45831 [DOI] [PMC free article] [PubMed] [Google Scholar]
- Leitinger B, Hohenester E (2007) Mammalian collagen receptors. Matrix Biol 26: 146–155 [DOI] [PubMed] [Google Scholar]
- Levental KR, Yu H, Kass L, Lakins JN, Egeblad M, Erler JT, Fong SFT, Csiszar K, Giaccia A, Weninger W et al (2009) Matrix crosslinking forces tumor progression by enhancing integrin signaling. Cell 139: 891–906 [DOI] [PMC free article] [PubMed] [Google Scholar]
- Li J, You S, Zhang S, Hu Q, Wang F, Chi X, Zhao W, Xie C, Zhang C, Yu Y et al (2019) Elevated N‐methyltransferase expression induced by hepatic stellate cells contributes to the metastasis of hepatocellular carcinoma via regulation of the CD44v3 isoform. Mol Oncol 13: 1993–2009 [DOI] [PMC free article] [PubMed] [Google Scholar]
- Liang L, Zeng M, Pan H, Liu H, He Y (2018) Nicotinamide N‐methyltransferase promotes epithelial‐mesenchymal transition in gastric cancer cells by activating transforming growth factor‐β1 expression. Oncol Lett 15: 4592–4598 [DOI] [PMC free article] [PubMed] [Google Scholar] [Retracted]
- Liu H, Patel MR, Prescher JA, Patsialou A, Qian D, Lin J, Wen S, Chang YF, Bachmann MH, Shimono Y et al (2010) Cancer stem cells from human breast tumors are involved in spontaneous metastases in orthotopic mouse models. Proc Natl Acad Sci USA 107: 18115–18120 [DOI] [PMC free article] [PubMed] [Google Scholar]
- Massagué J, Obenauf AC (2016) Metastatic colonization by circulating tumour cells. Nature 529: 298–306 [DOI] [PMC free article] [PubMed] [Google Scholar]
- McCarthy DJ, Chen Y, Smyth GK (2012) Differential expression analysis of multifactor RNA‐seq experiments with respect to biological variation. Nucleic Acids Res 40: 4288–4297 [DOI] [PMC free article] [PubMed] [Google Scholar]
- Meier JL (2013) Metabolic mechanisms of epigenetic regulation. ACS Chem Biol 8: 2607–2621 [DOI] [PMC free article] [PubMed] [Google Scholar]
- Miranda‐Gonçalves V, Lameirinhas A, Henrique R, Jerónimo C (2018) Metabolism and epigenetic interplay in cancer: regulation and putative therapeutic targets. Front Genet 9: 427 [DOI] [PMC free article] [PubMed] [Google Scholar]
- Mohn F, Weber M, Rebhan M, Roloff TC, Richter J, Stadler MB, Bibel M, Schübeler D (2008) Lineage‐specific Polycomb targets and De novo DNA methylation define restriction and potential of neuronal progenitors. Mol Cell 30: 755–766 [DOI] [PubMed] [Google Scholar]
- Morrison AJ (2022) Cancer cell metabolism connects epigenetic modifications to transcriptional regulation. FEBS J 289: 1302–1314 [DOI] [PMC free article] [PubMed] [Google Scholar]
- Nguyen DX, Massagué J (2007) Genetic determinants of cancer metastasis. Nat Rev Genet 8: 341–352 [DOI] [PubMed] [Google Scholar]
- Nicetto D, Zaret KS (2019) Role of H3K9me3 heterochromatin in cell identity establishment and maintenance. Curr Opin Genet Dev 55: 1–10 [DOI] [PMC free article] [PubMed] [Google Scholar]
- Obradović MMS, Hamelin B, Manevski N, Couto JP, Sethi A, Coissieux MM, Münst S, Okamoto R, Kohler H, Schmidt A et al (2019) Glucocorticoids promote breast cancer metastasis. Nature 567: 540–544 [DOI] [PubMed] [Google Scholar]
- Pereira B, Chin SF, Rueda OM, Vollan HKM, Provenzano E, Bardwell HA, Pugh M, Jones L, Russell R, Sammut SJ et al (2016) Erratum: The somatic mutation profiles of 2,433 breast cancers refine their genomic and transcriptomic landscapes. Nat Commun 7: 11908 [DOI] [PMC free article] [PubMed] [Google Scholar]
- Pidsley R, Zotenko E, Peters TJ, Lawrence MG, Risbridger GP, Molloy P, Van Djik S, Muhlhausler B, Stirzaker C, Clark SJ (2016) Critical evaluation of the Illumina MethylationEPIC BeadChip microarray for whole‐genome DNA methylation profiling. Genome Biol 17: 208 [DOI] [PMC free article] [PubMed] [Google Scholar]
- Pissios P (2017) Nicotinamide N‐methyltransferase: more than a vitamin B3 clearance enzyme. Trends Endocrinol Metab 28: 340–353 [DOI] [PMC free article] [PubMed] [Google Scholar]
- Pomp V, Leo C, Mauracher A, Korol D, Guo W, Varga Z (2015) Differential expression of epithelial–mesenchymal transition and stem cell markers in intrinsic subtypes of breast cancer. Breast Cancer Res Treat 154: 45–55 [DOI] [PubMed] [Google Scholar]
- Raudvere U, Kolberg L, Kuzmin I, Arak T, Adler P, Peterson H, Vilo J (2019) G:profiler: a web server for functional enrichment analysis and conversions of gene lists (2019 update). Nucleic Acids Res 47: W191–W198 [DOI] [PMC free article] [PubMed] [Google Scholar]
- Reustle A, Menig L, Leuthold P, Hofmann U, Stühler V, Schmees C, Becker M, Haag M, Klumpp V, Winter S et al (2022) Nicotinamide‐N‐methyltransferase is a promising metabolic drug target for primary and metastatic clear cell renal cell carcinoma. Clin Transl Med 12: e883 [DOI] [PMC free article] [PubMed] [Google Scholar]
- Rinaldi G, Pranzini E, Van Elsen J, Broekaert D, Funk CM, Planque M, Doglioni G, Altea‐Manzano P, Rossi M, Geldhof V et al (2021) In vivo evidence for serine biosynthesis‐defined sensitivity of lung metastasis, but not of primary breast tumors, to mTORC1 inhibition. Mol Cell 81: 386–397 [DOI] [PMC free article] [PubMed] [Google Scholar]
- Roberti A, Fernández AF, Fraga MF (2021) Nicotinamide N‐methyltransferase: at the crossroads between cellular metabolism and epigenetic regulation. Mol Metab 45: 101165 [DOI] [PMC free article] [PubMed] [Google Scholar]
- Robinson MD, McCarthy DJ, Smyth GK (2009) edgeR: a Bioconductor package for differential expression analysis of digital gene expression data. Bioinformatics 26: 139–140 [DOI] [PMC free article] [PubMed] [Google Scholar]
- Roeßler M, Rollinger W, Palme S, Hagmann ML, Berndt P, Engel AM, Schneidinger B, Pfeffer M, Andres H, Karl J et al (2005) Identification of nicotinamide N‐methyltransferase as a novel serum tumor marker for colorectal cancer. Clin Cancer Res 11: 6550–6557 [DOI] [PubMed] [Google Scholar]
- Sarrió D, Rodriguez‐Pinilla SM, Hardisson D, Cano A, Moreno‐Bueno G, Palacios J (2008) Epithelial‐mesenchymal transition in breast cancer relates to the basal‐like phenotype. Cancer Res 68: 989–997 [DOI] [PubMed] [Google Scholar]
- Sartini D, Seta R, Pozzi V, Morganti S, Rubini C, Zizzi A, Tomasetti M, Santarelli L, Emanuelli M (2015) Role of nicotinamide N‐methyltransferase in non‐small cell lung cancer: in vitro effect of shRNA‐mediated gene silencing on tumourigenicity. Biol Chem 396: 225–234 [DOI] [PubMed] [Google Scholar]
- Savarimuthu Francis SM, Larsen JE, Pavey SJ, Duhig EE, Clarke BE, Bowman RV, Hayward NK, Fong KM, Yang IA (2011) Genes and gene ontologies common to airflow obstruction and emphysema in the lungs of patients with COPD. PLoS ONE 6: e17442 [DOI] [PMC free article] [PubMed] [Google Scholar]
- Schuetz CS, Bonin M, Clare SE, Nieselt K, Sotlar K, Walter M, Fehm T, Solomayer E, Riess O, Wallwiener D et al (2006) Progression‐specific genes identified by expression profiling of matched ductal carcinomas in situ and invasive breast tumors, combining laser capture microdissection and oligonucleotide microarray analysis. Cancer Res 66: 5278–5286 [DOI] [PubMed] [Google Scholar]
- Shibue T, Weinberg RA (2017) EMT, CSCs, and drug resistance: the mechanistic link and clinical implications. Nat Rev Clin Oncol 14: 611–629 [DOI] [PMC free article] [PubMed] [Google Scholar]
- Shu X, Sheng GH, Li L, Ying J, Ma C, Wang Y, Poon FF, Wang X, Ying Y, Yeo W et al (2011) The epigenetic modifier PRDM5 functions as a tumor suppressor through modulating WNT/β‐catenin signaling and is frequently silenced in multiple tumors. PLoS ONE 6: e27346 [DOI] [PMC free article] [PubMed] [Google Scholar]
- Song M, Li Y, Miao M, Zhang F, Yuan H, Cao F, Chang W, Shi H, Song C (2020) High stromal nicotinamide N‐methyltransferase (NNMT) indicates poor prognosis in colorectal cancer. Cancer Med 9: 2030–2038 [DOI] [PMC free article] [PubMed] [Google Scholar]
- Sørlie T, Perou CM, Tibshirani R, Aas T, Geisler S, Johnsen H, Hastie T, Eisen MB, Van De Rijn M, Jeffrey SS et al (2001) Gene expression patterns of breast carcinomas distinguish tumor subclasses with clinical implications. Proc Natl Acad Sci USA 98: 10869–10874 [DOI] [PMC free article] [PubMed] [Google Scholar]
- Sperber H, Mathieu J, Wang Y, Ferreccio A, Hesson J, Xu Z, Fischer KA, Devi A, Detraux D, Gu H et al (2015) The metabolome regulates the epigenetic landscape during naive‐to‐primed human embryonic stem cell transition. Nat Cell Biol 17: 1523–1535 [DOI] [PMC free article] [PubMed] [Google Scholar]
- Sun W, Zou Y, Cai Z, Huang J, Hong X, Liang Q, Jin W (2022) Overexpression of NNMT in glioma aggravates tumor cell progression: an emerging therapeutic target. Cancers (Basel) 14: 3538 [DOI] [PMC free article] [PubMed] [Google Scholar]
- Tian C, Öhlund D, Rickelt S, Lidström T, Huang Y, Hao L, Zhao RT, Franklin O, Bhatia SN, Tuveson DA et al (2020) Cancer cell–derived Matrisome proteins promote metastasis in pancreatic ductal adenocarcinoma. Cancer Res 80: 1461–1474 [DOI] [PMC free article] [PubMed] [Google Scholar]
- Tonsing‐Carter E, Hernandez KM, Kim CR, Harkless RV, Oh A, Bowie KR, West‐Szymanski DC, Betancourt‐Ponce MA, Green BD, Lastra RR et al (2019) Glucocorticoid receptor modulation decreases ER‐positive breast cancer cell proliferation and suppresses wild‐type and mutant ER chromatin association. Breast Cancer Res 21: 82 [DOI] [PMC free article] [PubMed] [Google Scholar]
- Ulanovskaya OA, Zuhl AM, Cravatt BF (2013) NNMT promotes epigenetic remodeling in cancer by creating a metabolic methylation sink. Nat Chem Biol 9: 300–306 [DOI] [PMC free article] [PubMed] [Google Scholar]
- Varga Z, Tubbs RR, Moch H (2014) Concomitant detection of HER2 protein and gene alterations by immunohistochemistry (IHC) and silver enhanced in situ hybridization (SISH) identifies HER2 positive breast cancer with and without gene amplification. PLoS ONE 9: e105961 [DOI] [PMC free article] [PubMed] [Google Scholar]
- Wang Q, Hardie RA, Hoy AJ, Van Geldermalsen M, Gao D, Fazli L, Sadowski MC, Balaban S, Schreuder M, Nagarajah R et al (2015) Targeting ASCT2‐mediated glutamine uptake blocks prostate cancer growth and tumour development. J Pathol 236: 278–289 [DOI] [PMC free article] [PubMed] [Google Scholar]
- Wang Y, Zeng J, Wu W, Xie S, Yu H, Li G, Zhu T, Li F, Lu J, Wang GY et al (2019) Nicotinamide N‐methyltransferase enhances chemoresistance in breast cancer through SIRT1 protein stabilization. Breast Cancer Res 21: 64 [DOI] [PMC free article] [PubMed] [Google Scholar]
- Wang W, Yang C, Wang T, Deng H (2022a) Complex roles of nicotinamide N‐methyltransferase in cancer progression. Cell Death Dis 13: 267 [DOI] [PMC free article] [PubMed] [Google Scholar]
- Wang Y, Zhou X, Lei Y, Chu Y, Yu X, Tong Q, Zhu T, Yu H, Fang S, Li G et al (2022b) NNMT contributes to high metastasis of triple negative breast cancer by enhancing PP2A/MEK/ERK/c‐Jun/ABCA1 pathway mediated membrane fluidity. Cancer Lett 547: 215884 [DOI] [PubMed] [Google Scholar]
- Williams ED, Gao D, Redfern A, Thompson EW (2019) Controversies around epithelial–mesenchymal plasticity in cancer metastasis. Nat Rev Cancer 19: 716–732 [DOI] [PMC free article] [PubMed] [Google Scholar]
- Wu Y, Siadaty MS, Berens ME, Hampton GM, Theodorescu D (2008) Overlapping gene expression profiles of cell migration and tumor invasion in human bladder cancer identify metallothionein 1E and nicotinamide N‐methyltransferase as novel regulators of cell migration. Oncogene 27: 6679–6689 [DOI] [PMC free article] [PubMed] [Google Scholar]
- Zhang Z, Wang Y, Zhang J, Zhong J, Yang R (2018) COL1A1 promotes metastasis in colorectal cancer by regulating the WNT/PCP pathway. Mol Med Rep 17: 5037–5042 [DOI] [PMC free article] [PubMed] [Google Scholar]
- Zhou Y, Zhou B, Pache L, Chang M, Khodabakhshi AH, Tanaseichuk O, Benner C, Chanda SK (2019) Metascape provides a biologist‐oriented resource for the analysis of systems‐level datasets. Nat Commun 10: 1523 [DOI] [PMC free article] [PubMed] [Google Scholar]