

Abstract
Objective
The Benton Visual Form Discrimination Test (VFDT) is a commonly used measure of visual discrimination and visual recognition memory and has shown promise in distinguishing between different levels of cognitive impairment. We assess the predictive diagnostic utility of the VFDT in a sample of older Veterans with cognitive concerns.
Method
Subjects included a total of 172 mostly male Veterans over the age of 64 (mean = 76.0; SD = 7.6) recruited from a VA clinic specializing in neuropsychological assessment of older Veterans. The clinical sample included 56 subjects diagnosed with Major Neurocognitive Disorder, 74 diagnosed with Mild Neurocognitive Disorder, and 42 with No Neurocognitive Impairment. Impairment categories were modeled in separate multinomial logistic regressions with two versions of the VFDT as predictors: the Visual Form Discrimination Test-Recognition Subtest (VFDT-Rec) test (visual recognition memory) and the Visual Form Discrimination Test-Matching Subtest VFDT-Mat test (visual form discrimination). Years of education were included as a covariate.
Results
After adjusting for education, higher VFDT-Rec total scores were associated with lower odds of being categorized with a greater degree of cognitive/functional impairment (OR 0.66–0.83, p < .001). VFDT-Mat scores showed a similar pattern, but only reached statistical significance for the Major versus No Neurocognitive Impairment (OR = 0.77, p = .0010) and Major versus Mild comparisons (OR = 0.89, p = .0233).
Conclusions
The VFDT may enhance the confidence of differential diagnosis of dementia in older adult Veterans. Formal education-adjusted norms need to be established for clinical use.
Keywords: Assessment, Elderly/geriatrics/aging, Perception/spatial processing, Learning and memory, Mild cognitive impairment, Dementia
Assessment of visuospatial abilities and visual memory is an integral part of the neuropsychological evaluation. Poor visuospatial performance is observed in several neurodegenerative conditions (Salimi et al., 2018), particularly on more complex tasks requiring higher level or layered skills (Benton, Sivan, Hamsher, Varney, & Spreen, 1994). In fact, a range of impairments in visual perception and visuospatial functioning can be observed from conditions such as Alzheimer’s disease (Li et al., 2018), vascular dementia (Sengupta, Ganguly, Pal, & Ghosal, 2019), and Lewy Body disease (Hamilton et al., 2008). Visuospatial memory performance may also predict higher loads of Alzheimer’s pathology approximately 20 years after initial testing, presumably related to early Alzheimer’s disease-related changes in the temporoparietal pathways (Robinson et al., 2018). Moreover, visuospatial skills have broader implications for functional abilities as poorer performance on visuospatial tasks has been associated with declines in ability to independently perform tasks of daily living (Reppermund et al., 2011; Watson, Gignac, Weinborn, Green, & Pestell, 2020) and driving ability (Reger et al., 2004).
Assessing visuospatial skills and visual memory in older adults can prove challenging due to age- and disease-related declines in sensory and motor abilities that may influence performance on measures that rely on those skills. Deficits in other cognitive domains further complicate evaluation of visual perception and memory abilities, particularly in clinical populations at risk for neurodegenerative conditions. For example, executive dysfunction (e.g., impaired attention, impulsivity) may affect performance on visuospatial and visual memory tasks in frontotemporal dementia (Salimi et al., 2019) and traumatic brain injury (TBI) (Schwarz et al., 2009). Minimizing the effects of sensory and other cognitive difficulties during neuropsychological assessment is critical to improving the accuracy of differentiating true visuospatial dysfunction from a primary difficulty in a sensory or cognitive domain. In general, the field of neuropsychology has several methods of improving the accuracy of visuospatial and visual memory assessment, including the use of measures that are untimed, involve simple instructions, do not require verbal responses (e.g., pointing to indicate answer), and/or reduce demand on fine-motor/motor-planning skills. Two such tests are the Benton Visual Retention Test-Multiple Choice (BVRT-MC; Benton, Hamsher, & Stone, 1977) and Benton Visual Form Discrimination Test (VFDT; Benton et al., 1994).
The BVRT-MC and VFDT were originally developed together with the Benton Visual Retention Test (BVRT) to improve assessment of visuospatial abilities and aspects of visual memory through the reduction of fine-motor demands. Although both the BVRT-MC and VFDT rely on the same task stimuli, they employ different test paradigms: BVRT-MC evaluates short-term visual memory using a recognition procedure after a short delay, whereas the VFDT relies on a matching paradigm to evaluate visual discrimination (Benton et al., 1994). When used in concert, the BVRT-MC and VFDT are particularly useful in differentiating between difficulties in visual memory versus a more fundamental difficulty in visual discrimination. Throughout this paper, these measures will be referred to as the Visual Form Discrimination Test-Recognition Subtest (VFDT-Rec) for the memory task (formerly BVRT-MC), the Visual Form Discrimination Test-Matching Subtest (VFDT-Mat) for the matching task, and collectively as the VFDT for clarity.
Much of the VFDT research has focused on detection of visuospatial dysfunction after neurologic insult (e.g., Benton et al., 1994; Caplan & Caffery, 1992) and subsequent development of normative data. Early work established the clinical utility of the VFDT-Rec in identifying right-hemisphere impairment (Axelrod & Ricker, 1995; Caplan & Caffery, 1992), whereas subsequent studies focused on the impact of demographic factors such as age, education, and race on both VFDT-Rec and VFDT-Mat performance (e.g., Campo & Morales, 2003; Le Carret et al., 2003) among several different sample cohorts. In addition, work by Moses (1986), replicated by Lockwood, Mansoor, Homer-Smith, and Moses Jr. (2011), confirmed co-loading of both the VFDT-Rec and VFDT-Mat on the same visual memory factor as the BVRT, suggesting that these tasks are measuring visual immediate memory. This is supported by work correlating VFDT-Mat and Rey Complex Figure Copy Trial (RCFT) performance in both healthy controls and individuals with Mild Neurocognitive Disorder (Kasai et al., 2009).
For older adult samples, associations between VFDT-Mat and disease-related factors, such as severity of neurocognitive difficulties, are documented. Work by Kaskie and Storandt (1995) demonstrated significant differences in VFDT-Mat performance between different diagnostic groups in older adults, finding that poorer VFDT-Mat performance was associated with higher Clinical Dementia Ratings (CDR). A similar relationship was found by Kasai and colleagues (2009) in community-dwelling older adults, such that individuals with Mild and Major Neurocognitive Disorders had lower VFDT-Mat total scores compared with healthy controls. In addition, Nabors, Vangel Jr., and Lichtenberg (1996) used VFDT-Mat scores to predict group membership via logistic regression (Cognitive Impairment vs. No Cognitive Impairment), correctly classifying 73% of patients with cognitive impairment (72% sensitivity, 75% specificity). Together, these findings suggest that VFDT performance may have further utility in distinguishing different levels of neurocognitive impairment in older adults.
There have been a limited number of recent works focused on the VFDT, although several magnetic resonance imaging (MRI) works have found links between VDFT-Mat and cortical thickness in left lingual and fusiform gyrus in Parkinson’s Disease (Garcia-Diaz et al., 2018) and the right superior parietal lobe and left precuneus in idiopathic Rapid Eye Movement behavior sleep disorder (Campabadal et al., 2020), a risk factor for Parkinsonian conditions (Postuma et al., 2019). Meanwhile, other work has suggested that poorer VFDT-Mat performance may be associated with more risky decision-making on a road-crossing task in individuals with Alzheimer’s disease (Fang, Lin, Liu, & Ou, 2018), suggesting potential ecological validity. Collectively, these studies support the clinical use of the VFDT subtests in assessing visuospatial skills and visual spatial memory in older adult populations; however, with comparatively fewer recent studies, updated research is needed.
Although the relative efficiency and decreased reliance on graphomotor skills of the VFDT in assessing visuospatial functioning makes this measure an appealing addition to neuropsychological evaluations, further exploration of the VFDT and its use in assessing and/or predicting cognitive decline in older adults is needed. The absence of motor skills needed to complete the VFDT, in particular, further adds to its utility in assessing older adults, many of whom suffer from declining motor function. The current investigation therefore assesses if VFDT performance can retroactively predict diagnosis of a Neurocognitive Disorder in a sample of older Veterans, after accounting for any effects of age and education.
Methods
Participants
All study protocols and research were conducted under the approval of the Stanford University Institutional Review Board, in association with the VA Palo Alto Health Care System. The present study used archival data from older Veterans who were seen for outpatient neuropsychological evaluation of cognitive concerns at the Memory Clinic in the VA Palo Alto Health Care System between September 2009 and April 2017. Referral questions also included the following: differential diagnosis of potential Neurocognitive Disorders, decisional capacity (i.e., independent living, financial, and medical decision-making), and psychological functioning in the context of cognitive decline. Diagnostic impressions were based on Diagnostic and Statistical Manual of Mental Disorders-Fifth Edition (DSM-5) criteria for Mild and Major Neurocognitive Disorders (American Psychiatric Association, 2013). According to the DSM-5, a diagnosis of Neurocognitive Disorder requires demonstration of impairment in at least one cognitive domain and level of functional independence distinguishes between Mild and Major Neurocognitive Disorders.
Patients’ data were included in these analyses if they were evaluated by the Memory Clinic between September 2009 and April 2017, received a diagnosis of No Neurocognitive Impairment, Mild, or Major Neurocognitive Disorder per DSM-5 criteria, were 64 years or older, and signed a Stanford University IRB approved consent form to participate in research. Patient data was only included if performance on embedded performance validity tests (PVTs) was adequate. To mitigate false-positive risk in our Major Neurocognitive Disorder group due to the impact of dementia (e.g., McGuire, Crawford, & Evans, 2019), patients minimally passed one PVT measure and demonstrated borderline performance on the other (e.g., five on the Reliable Digit Span, RDS), with consistent behavioral observations suggesting adequate effort in the context of dementia.
Out of an initial 756 Memory Clinic patient records, 172 were used for the current analyses: 42 with No Neurocognitive Impairment, 74 with Mild Neurocognitive Disorder, and 56 with Major Neurocognitive Disorder. Diagnostic etiologies varied in this sample; the most frequently diagnosed etiologies included Vascular disease (35%), Unspecified (28%), and Multiple etiologies (25%). Sample mean age was 76 years old (SD = 7.6; range: 60–97) and mean education was 14.5 years (SD = 2.9). The majority of our sample belonged to the Vietnam and Korean era cohorts (52.3% and 22.1%, respectively). Demographic characteristics, including medical and psychiatric history, are described in Tables 1–3 and 5. Cardiovascular risk factors were present in the majority of our sample, including 14.5% with stroke, consistent with the relatively high rate of vascular neurocognitive etiologies. Other neurologic conditions were present at comparatively lower rates: 6.4% with remote TBI, 3.5% with epilepsy, and 2.9% with Parkinson’s disease.
Table 1.
Sample demographic characteristics
| Characteristic | Number in sample |
|---|---|
| Ethnicity | |
| Hispanic/Latino | 22 |
| Not Hispanic/Latino | 148 |
| Unknown/not reported | 2 |
| Race | |
| American Indian/Alaska Native | 1 |
| Asian | 5 |
| Native Hawaiian or other Pacific Islander | 3 |
| Black or African American | 14 |
| White | 129 |
| South/Central American | 16 |
| More than one race | 3 |
| Unknown/not reported | 1 |
| Gender | |
| Male | 168 |
| Female | 4 |
| Handedness | |
| Right | 146 |
| Left | 19 |
| Ambidextrous | 7 |
| Marital status | |
| Married | 83 |
| Divorced | 44 |
| Single/never married | 15 |
| Widower/widow | 25 |
| Separated | 5 |
Table 3.
Sample psychiatric history
| Characteristic | Percentage of sample |
|---|---|
| Posttraumatic stress disorder (PTSD) | 13.4 |
| Depression | 23.8 |
| Anxiety | 10.5 |
| Severe mental illness (SMI) | 5.8 |
| Substance use disorder | 27.3 |
| Alcohol | 14.0 |
| Tobacco | 15.1 |
| Cannabis | 2.9 |
| Stimulant | 2.3 |
| Opioid | 1.7 |
| Sedative/hypnotic/anxiolytic | 0.6 |
| Inhalant | 0.6 |
Table 5.
Sample demographic data
| No Neurocognitive Impairment | Mild NCD | Major NCD | p | ||||
|---|---|---|---|---|---|---|---|
| (n = 42) | (n = 74) | (n = 56) | |||||
| M | (SD) | M | (SD) | M | (SD) | ||
| Age | 73.5 | (5.9) | 77.0 | (7.7) | 76.6 | (8.3) | .045 |
| Education | 14.7 | (2.6) | 15.2 | (3.0) | 13.4 | (2.6) | .001 |
NCD = Neurocognitive Disorder.
Table 2.
Sample medical history
| Characteristic | Percentage of sample |
|---|---|
| Stroke/cerebrovascular accident | 14.5 |
| Aneurysm | 4.1 |
| Transient ischemic attack | 7.6 |
| Coronary artery disease | 20.3 |
| Cardiovascular disease | 1.7 |
| Heart attack/myocardial infarction | 4.7 |
| Hypertension | 74.4 |
| Hyperlipidemia | 65.1 |
| Diabetes (all types) | 36.6 |
| Obesity | 18.6 |
| Sleep apnea | 19.8 |
| Vitamin B12 deficiency | 8.7 |
| Headache/migraine | 6.4 |
| Cancer | 27.9 |
| HIV/AIDS | 0.6 |
| Traumatic brain injury (TBI) | 6.4 |
| Epilepsy/seizure disorder | 3.5 |
| Parkinson’s disease | 2.9 |
Approximately 24% of our sample had a history of depression, 13.4% with posttraumatic stress disorder, and 10.5% with anxiety; overall consistent with persisting higher rates of psychiatric concerns in the Vietnam Cohort over time (Marmar et al., 2015). Severe mental illness was present in a smaller proportion of our sample (5.8%), including bipolar I, schizophrenia spectrum disorders, and unspecified bipolar and schizophrenia. Substance use (past and present) was present in 27.3%, with alcohol and tobacco use being the most common (14.0% and 15.1%, respectively).
Procedure
Participants were assessed by clinical psychology trainees who were enrolled in or recently completed a doctoral program for clinical or counseling psychology, under the supervision of a licensed doctoral level staff neuropsychologist. Testing was completed at the Memory Clinic within the VA Palo Alto Health Care System. The VFDT was part of a larger neuropsychological test battery that was preceded by clinical interview. The neuropsychological test battery was semi-flexible and validated for use with older adults (Table 4), including assessment of the following cognitive domains: attention, processing speed, visuospatial functioning, language, visual memory, auditory memory, working memory, and executive functioning. Embedded PVTs were included in all test batteries, namely, California Verbal Learning Test-II Forced Choice and RDS from the Wechsler Adult Intelligence Scale-IV Digit Span subtest (Table 4).
Table 4.
Core subtests
| Domain of assessment | Assessment measure |
|---|---|
| Attention | The Digit Span subtest of the Wechsler Adult |
| Intelligence Test-4th Edition (WAIS-IV) | |
| Processing speed | Trail-Making Test parts A and B |
| Coding subtest of the WAIS-IV | |
| Visuospatial functioning | Block Design subtest of the WAIS-IV |
| VFDT | |
| BVRT | |
| Brief Visuospatial Memory Test-Revised | |
| Language functioning | Boston Naming Test (BNT) |
| Verbal Fluency subtest of the Delis–Kaplan | |
| Executive Function System (DKEFS) | |
| Visual memory | VFDT |
| BVRT | |
| Brief Visuospatial Memory Test-Revised | |
| Auditory memory | California Verbal Learning Test-2 (CVLT-2), Standard Form, Alternate Form, or Short-Form |
| Older Adult Battery Logical Memory I and II | |
| Subtests of the Wechsler Memory Scale-4th Edition (WMS-IV) | |
| Working memory | Wechsler Adult Intelligence Test-3rd Edition |
| (WAIS-III) Letter-Number Sequencing subtest | |
| The Digit Span subtest of the Wechsler Adult | |
| Intelligence Test-4th Edition (WAIS-IV) | |
| Executive functioning | Trail-Making Test parts A and B |
| Color-Word Interference subtest of the DKEFS | |
| Verbal Fluency subtest of the DKEFS | |
| Performance validity | CVLT-2 Forced Choice (CVLT-2 FC), Standard |
| Form, Alternate Form, or Short-Form | |
| WAIS-IV Reliable Digit Span (WAIS-IV RDS) |
VFDT = Visual Form Discrimination Test; BVRT = Benton Visual Retention Test.
The VFDT-Rec was administered prior to the VFDT-Mat per standardized administration of the VFDT following the instructions provided in Benton and colleagues (1977) unpublished manuscript of Administrations F and G. Presentation of VFDT-Rec target stimuli varied from 10 to 15 s. As per Axelrod and Ricker (1995), a weighted score was used such that participants were awarded partial credit for peripheral errors and no credit for other types of errors (i.e., major rotations, major distortions) to provide an unbiased assessment of visuospatial discrimination and memory, with some control for declines in vision associated with normal aging that may impact VFDT performance.
Measures
Visual Form Discrimination Test-Recognition Subtest
The VFDT-Rec is comprised of 16 target stimulus items, each including two large major figures and a small peripheral figure. The examinee is presented with a target stimulus for 10 s, after which an array with four different designs is presented. These four designs include the exact match of the original target stimulus and three similar designs that differ in one of the following ways: placement of the peripheral figure, rotation of one of the major figures, and a distortion of one of the main original figures characterized by an alteration in the placement of a figure’s internal details. Errors are then classified into the following categories: peripheral, major rotation, and major distortion. An additional response category entitled “No Response” is also included. Total VFDT-Rec score is calculated by multiplying the total number of correct responses by two and adding 1 point for each peripheral error response. The maximum total score is 32. As per standardized administration, all patients completed two sample items with corrective feedback before proceeding to the 16 test items.
Mitrushina, Boone, and D’Elia (1999) provide a comprehensive review of seven normative studies evaluating the VFDT-Rec (formerly BVRT-MC); most of those studies used large sample sizes and report information on age and education, although, none formally stratify by age.
Visual Form Discrimination Test-Matching Subtest
The same test stimuli used in VFDT-Rec are used for the VFDT-Mat, which is administered immediately after the VFDT-Rec. Like the VFDT-Rec, the VFDT-Mat begins with two sample items with corrective feedback, if necessary, before completion of the actual 16 test items. During the VFDT-Mat, examinees are shown both the original target stimulus and the display featuring the four multiple choice stimuli concurrently. Individuals are then asked to identify the target stimuli from among the distractors, whereas the original target stimulus is still displayed. Each item is untimed. As with the VFDT-Rec, the total VFDT-Mat score is calculated by multiplying the correct score by two and adding 1 point for each peripheral error response. The maximum total score is 32.
The original normative data for the VFDT-Mat were developed by Benton and colleagues in 1983 using healthy controls and stratifying by both age and gender (Benton et al., 1994). Although mean and median performance data were reported, standard deviations were omitted, limiting use of the data. Later, Caplan and Schultheis (1998) provided standard deviations, T-score, and percentile equivalents for the original data.
Diagnosis of Neurocognitive Disorder
A diagnosis of Mild or Major Neurocognitive Disorder was made based on the specific criteria outlined in the DSM-5. A detailed chart review was completed prior to each evaluation to assist with differential diagnosis and rule out delirium or contributing mental health diagnoses. Clinical interviews were conducted prior to neuropsychological testing to obtain the most current information about the patient. Corroborating information was obtained from collateral informants, such as family or caregivers, when available. Results of neuropsychological testing, along with an assessment of self- and informant-reported changes in daily functioning, contributed to the final diagnosis.
For the purpose of this study, a licensed VA Neuropsychologist determined diagnosis through review with exclusion of all VFDT information. Prior to this review, patient records were de-identified by research staff, including removal of all data pertaining to the VFDT and clinical diagnosis utilizing the VFDT.
Statistical Methods
Differences in age and years of education across diagnostic categories were formally tested [one-way analysis of variance (ANOVA)] to determine whether to include these as covariates in the primary models. The primary analysis consisted of a multinomial logistic regression to model the probability of being categorized into increasing levels of cognitive impairment (i.e., No Neurocognitive Impairment, Mild, or Major Neurocognitive Disorder) as a function of VFDT score. The VFDT-Rec and VFDT-Mat were analyzed in two separate models.
Secondary analyses examined if alternate cognitive covariates (e.g., delayed auditory memory) might better account for the variance in these models. The Older Adult version of Wechsler Memory Scale-4th Edition (WMS-IV) Logical Memory (LM I and II) and the Mini-Mental State Examination (MMSE) were selected as covariates, in order to include a more formal measure of memory and a commonly used cognitive screening measure, respectively. Out of the original sample (n = 172), 156 patients completed LM (I and II) and 162 completed the MMSE, who were then used in these subsequent analyses. All analyses were performed using SAS v9.4 (SAS Inc., Cary, NC).
Results
Table 5 summarizes education and age by diagnostic category. The number of years of education was significantly different across diagnostic categories (one-way ANOVA, p < .001) and was thus included in the primary analysis as a covariate. Although age was also significantly different between diagnostic categories based on the ANOVA, it was not a significant predictor when added to the multinomial logistic regression models. Therefore, age was not included as a covariate and was removed from the models.
Table 6 displays descriptive statistics for the VFDT-Rec and VFDT-Mat subtests by diagnostic group and logistic regression results can be found in Table 7. Logistic regression showed that higher (i.e., better) VFDT-Rec memory scores significantly predicted a better neurocognitive category after adjustment for education, for all three comparisons: None versus Mild, None versus Major, and Mild versus Major. Odds ratios presented here provide an estimate of effect size. Of note, a 1-point improvement in the VFDT-Rec score yielded 20% lower odds (95% CI: 0.71, 0.90) of a diagnosis of Mild impairment when compared with No impairment. Similarly, the same improvement in the score yielded 17% lower odds (95% CI: 0.75, 0.91) of a diagnosis of Major impairment when compared with Mild impairment.
Table 6.
Sample VFDT-Rec and VFDT-Mat descriptive data
| No Neurocognitive Impairment | Mild NCD | Major NCD | |||||||
|---|---|---|---|---|---|---|---|---|---|
| (n = 42) | (n = 74) | (n = 56) | |||||||
| M | (SD) | Range | M | (SD) | Range | M | (SD) | Range | |
| VFDT-Rec | 26.6 | (3.4) | 17–31 | 23.7 | (4.1) | 11–31 | 20.1 | (4.0) | 11–30 |
| VFDT-Mat | 30.2 | (2.1) | 24–32 | 29.2 | (3.4) | 15–32 | 27.2 | (4.1) | 15–32 |
VFDT-Rec = Visual Form Discrimination Test-Recognition Subtest; VFDT-Mat = Visual Form Discrimination Test-Matching Subtest; NCD = Neurocognitive Disorder.
Table 7.
Results of multinomial logistic regression models: VFDT-Rec and VFDT-Mat as predictors with years of education as a covariate
| Model 1: VFDT-Rec | |||||||||
|---|---|---|---|---|---|---|---|---|---|
| Mild NCD versus No Neurocognitive Impairment | Major NCD versus No Neurocognitive Impairment | Major NCD versus Mild NCD | |||||||
| OR | 95% CI | p | OR | 95% CI | p | OR | 95% CI | p | |
| VFDT-Rec | 0.80 | (0.71, 0.90) | <.001 | 0.66 | (0.57, 0.76) | <.001 | 0.83 | (0.75, 0.91) | <.001 |
| Education | 1.08 | (0.93, 1.27) | .32 | 0.89 | (0.74, 1.06) | .20 | 0.82 | (0.71, 0.94) | .005 |
| Model 2: VFDT-Mat | |||||||||
| Mild NCD versus No Neurocognitive Impairment | Major NCD versus No Neurocognitive Impairment | Major NCD versus Mild NCD | |||||||
| OR | 95% CI | p | OR | 95% CI | p | OR | 95% CI | p | |
| VFDT-Mat | 0.87 | (0.75, 1.01) | .07 | 0.77 | (0.66, 0.90) | .001 | 0.89 | (0.80, 0.98) | .02 |
| Education | 1.08 | (0.94, 1.25) | .27 | 0.89 | (0.76, 1.04) | .14 | 0.82 | (0.72, 0.94) | .003 |
VFDT-Rec = Visual Form Discrimination Test-Recognition Subtest; VFDT-Mat = Visual Form Discrimination Test-Matching Subtest; NCD = Neurocognitive Disorder.
VFDT-Mat scores demonstrated a similar pattern, but only reached statistical significance for the None versus Major and Mild versus Major comparisons (Table 8). A better VFDT-Mat performance was associated with less neurocognitive impairment, whereas poorer performance was associated with greater impairment.
Table 8.
VFDT-Rec multinomial logistic regression results with LM (I and II) and MMSE added as covariates
| Mild NCD versus No Neurocognitive Impairment | Major NCD versus No Neurocognitive Impairment | Major NCD versus Mild NCD | |||||||
|---|---|---|---|---|---|---|---|---|---|
| OR | 95% CI | p | OR | 95% CI | p | OR | 95% CI | p | |
| VFDT-Rec | 0.80 | (0.68, 0.94) | <.001 | 0.65 | (0.54, 0.78) | .005 | 0.81 | (0.72, 0.92) | <.001 |
| Education | 1.30 | (1.02, 1.65) | .03 | 1.15 | (0.88, 1.49) | .31 | 0.89 | (0.76, 1.04) | .13 |
| LM I | 1.02 | (0.92, 1.12) | .78 | 0.95 | (0.84, 1.07) | .40 | 0.93 | (0.85, 1.02) | .13 |
| LM II | 0.86 | (0.77, 0.96) | .008 | 0.83 | (0.72, 0.96) | .01 | 0.97 | (0.88, 1.08) | .60 |
| MMSE | 0.81 | (0.62, 1.05) | .11 | 0.69 | (0.52, 0.92) | .01 | 0.86 | (0.74, 1.00) | .04 |
LM = learning memory; MMSE = Mini-Mental State Examination; VFDT-Rec = Visual Form Discrimination Test-Recognition Subtest; NCD = Neurocognitive Disorder.
Figures 1–6 present the predicted probability of diagnostic category as a function of VFDT scores for patients in each diagnostic category. With inclusion of both VFDT-Rec and VFDT-Mat in the same model, only VFDT-Rec remained significant (p < .001). The pattern of association between VFDT scores and probability of obtaining a diagnosis of mild or major neurocognitive disorder is shown in Figures 1–6. Notably, the predicted probability of having no diagnosis compared with either Mild or Major impairment increases as the VFDT-Rec scores increase. Similar interpretations may be made for the VFDT-Mat. Furthermore, the probability of impairment for given VFDT scores also depends on education, such that the probability of no impairment decreases with lower educational attainment.
Fig. 1.
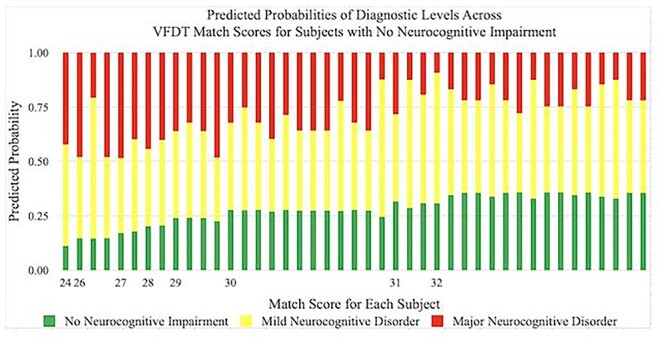
Predicted probabilities of achieving a diagnosis of No Neurocognitive Impairment, Mild Neurocognitive Disorder, and Major Neurocognitive Disorder by VFDT-Mat scores in subjects with No Neurocognitive Impairment. Predicted probabilities are presented as percentages and VFDT-Mat scores are represented by raw score values. Multiple bars per raw score value indicate variability in performance among individuals within a specific diagnostic category. VFDT-Mat = Visual Form Discrimination Test-Matching Subtest.
Fig. 6.
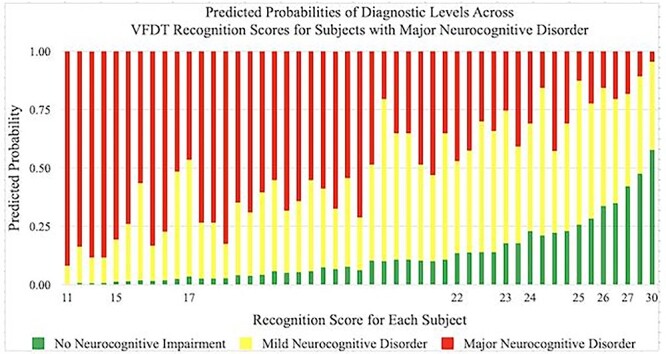
Predicted probabilities of achieving a diagnosis of No Neurocognitive Impairment, Mild Neurocognitive Disorder, and Major Neurocognitive Disorder by VFDT-Rec scores in subjects with Major Neurocognitive Disorder. Predicted probabilities are presented as percentages and VFDT-Rec scores are represented by raw score values. Multiple bars per raw score value indicate variability in performance among individuals within a specific diagnostic category. VFDT-Rec, Visual Form Discrimination Test-Recognition Subtest.
Fig. 2.
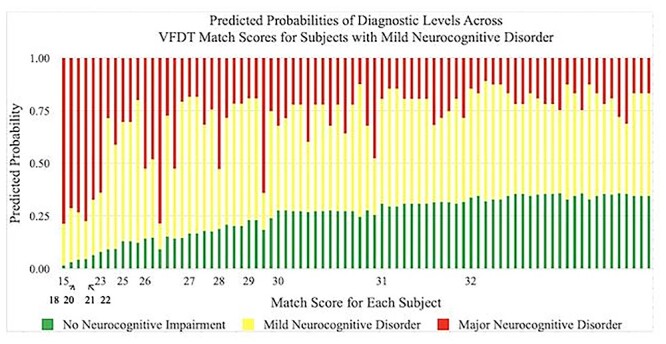
Predicted probabilities of achieving a diagnosis of No Neurocognitive Impairment, Mild Neurocognitive Disorder, and Major Neurocognitive Disorder by VFDT-Mat scores in subjects with Mild Neurocognitive Disorder. Predicted probabilities are presented as percentages and VFDT-Mat scores are represented by raw score values. Multiple bars per raw score value indicate variability in performance among individuals within a specific diagnostic category. VFDT-Mat, Visual Form Discrimination Test-Matching Subtest.
Fig. 3.
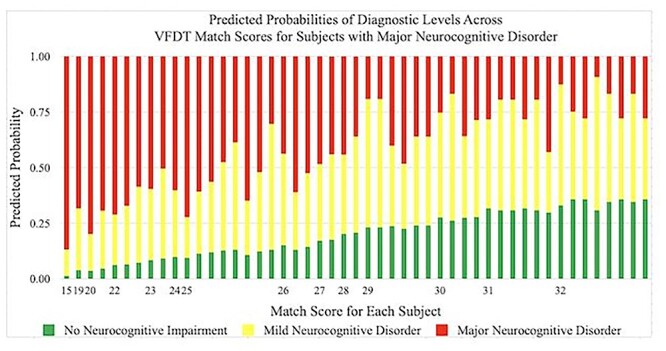
Predicted probabilities of achieving a diagnosis of No Neurocognitive Impairment, Mild Neurocognitive Disorder, and Major Neurocognitive Disorder by VFDT-Mat scores in subjects with Major Neurocognitive Disorder. Predicted probabilities are presented as percentages and VFDT-Mat scores are represented by raw score values. Multiple bars per raw score value indicate variability in performance among individuals within a specific diagnostic category. VFDT-Mat, Visual Form Discrimination Test-Matching Subtest.
Fig. 4.
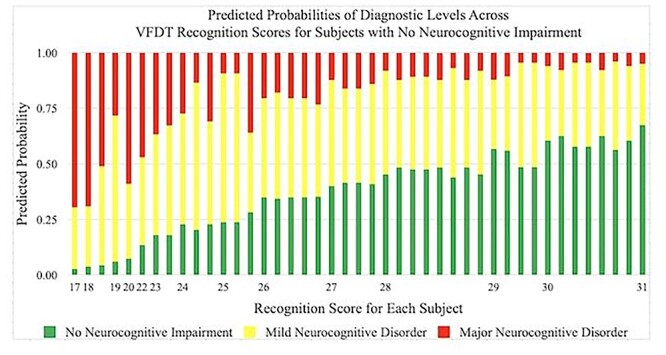
Predicted probabilities of achieving a diagnosis of No Neurocognitive Impairment, Mild Neurocognitive Disorder, and Major Neurocognitive Disorder by VFDT-Rec scores in subjects with No Neurocognitive Impairment. Predicted probabilities are presented as percentages and VFDT-Rec scores are represented by raw score values. Multiple bars per raw score value indicate variability in performance among individuals within a specific diagnostic category. VFDT-Rec, Visual Form Discrimination Test-Recognition Subtest.
Fig. 5.
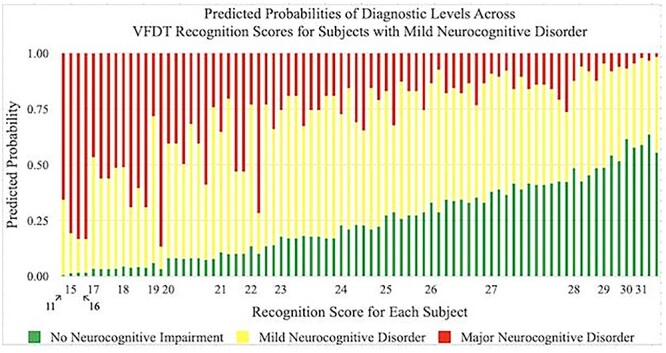
Predicted probabilities of achieving a diagnosis of No Neurocognitive Impairment, Mild Neurocognitive Disorder, and Major Neurocognitive Disorder by VFDT-Rec scores in subjects with Mild Neurocognitive Disorder. Predicted probabilities are presented as percentages and VFDT-Rec scores are represented by raw score values. Multiple bars per raw score value indicate variability in performance among individuals within a specific diagnostic category. VFDT-Rec, Visual Form Discrimination Test-Recognition Subtest.
To validate our results, we considered whether alternative cognitive covariates might account for some of the explanatory power provided by the VFDT subtests. The VFDT-Rec subtest (memory paradigm) was positively correlated with both LM subtests (LMI: p = <.001, r = .33; LM2: p < .001, r = .28) and MMSE total (p = <.001, r = .38). However, the VFDT subtests reached similar levels of significance with or without the addition of these alternative cognitive covariates in the model (Tables 9), with the exception that the VFDT-Mat matching score was no longer significant in the Mild versus Major comparison (Table 9).
Table 9.
VFDT-Mat multinomial logistic regression results with LM (I and II) and MMSE added as covariates
| Mild NCD versus No Neurocognitive Impairment | Major NCD versus No Neurocognitive Impairment | Major NCD versus Mild NCD | |||||||
|---|---|---|---|---|---|---|---|---|---|
| OR | 95% CI | p | OR | 95% CI | p | OR | 95% CI | p | |
| VFDT-Mat | 0.89 | (0.75, 1.06) | .20 | 0.81 | (0.67, 0.98) | .03 | 0.91 | (0.81, 1.02) | .10 |
| Education | 1.30 | (1.04, 1.63) | .02 | 1.15 | (0.90, 1.46) | .27 | 0.88 | (0.76, 1.03) | .10 |
| LM I | 1.01 | (0.91, 1.12) | .84 | 0.95 | (0.85, 1.07) | .41 | 0.94 | (0.87, 1.02) | .16 |
| LM II | 0.87 | (0.77, 0.97) | .01 | 0.83 | (0.72, 0.95) | .007 | 0.96 | (0.87, 1.06) | .41 |
| MMSE | 0.75 | (0.58, 0.96) | .02 | 0.65 | (0.49, 0.85) | .002 | 0.87 | (0.75, 1.00) | .05 |
LM = learning memory; MMSE = Mini-Mental State Examination; VFDT-Mat = Visual Form Discrimination Test-Matching Subtest.
Discussion
Overall, we found a significant relationship between VFDT performance and neurocognitive diagnosis, which was maintained even with the addition of other cognitive test covariates to the models. Although both the VFDT-Rec and VFDT-Mat were significant predictors of impairment in separate models, only the VFDT-Rec remained significant when both scores were included in the same model. This finding is consistent with the fact that the VFDT-Mat is a less complex task with fewer cognitive demands, measuring primarily visual discrimination, which raised concerns in early research about the VFDT-Mat’s discriminability due to its ease and high ceiling effects (Lopez, Charter, Oh, Lazar, & Imperio, 2005). In contrast, the VFDT-Rec requires layering of multiple skills, including visual memory and visual discrimination, resulting in an increase in task complexity. Given these differences, it is unsurprising that the VFDT-Rec appeared to be the main predictor of neurocognitive diagnosis, as its higher complexity level likely helped to increase individual score variability and overall sensitivity in detecting cognitive impairment. These findings provide further support for the clinical utility of the VFDT-Rec in classification of cognitive impairment, although more studies are needed to confirm and expand these findings.
Despite its relative simplicity, our findings suggest the VFDT-Mat may continue to be a useful screening measure for visuospatial dysfunction, particularly when used in conjunction with the VFDT-Rec. The VFDT-Mat allows evaluators to easily parse visuospatial deficits associated with normal aging, e.g., vision loss and reductions in visual discriminability, which may affect overall performance on the VFDT-Rec and other visual memory tasks (Andersen, 2012) with comparatively little time added to the overall test battery. Although additional research investigating the VFDT-Mat may be useful to address further questions of this subtest’s clinical utility, improved normative values specific to the VFDT-Mat subtest may not be necessary given its high potential for ceiling effects (Lopez et al., 2005). Instead, it may be more useful to consider developing separate and improved normative values for the VFDT-Rec test (memory paradigm) independently of the VFDT-Mat (visual discrimination).
Although our results generally support increased probability of being categorized with No Neurocognitive Impairment as VFDT scores improve, lower scores are not necessarily indicative of cognitive impairment. Normal variability in performance across tasks during a neuropsychological assessment is common in both healthy adults and older adults with cognitive impairment (Binder, Iverson, & Brooks, 2009; Hultsch, MacDonald, Hunter, Levy-Bencheton, & Strauss, 2000). In this study, each cognitive domain assessed included multiple measures to account for normal variability in test scores and a particular domain was only deemed to be impaired when impairment was demonstrated on multiple measures within that domain. These methods were specifically utilized to avoid inaccuracy and misdiagnosis related to normal fluctuations in performance, representing a strength of this study and paralleling best clinical practices. Consequently, a Veteran who performs poorly on the VFDT may avoid a neurocognitive diagnosis if other measures of visuospatial functioning and visual memory are intact, underscoring the importance of using multiple sources of data to make a diagnosis of Neurocognitive Disorder. Nevertheless, even with this caveat, the VFDT has demonstrated promise in aiding clinical decision-making.
Moreover, as neuropsychological assessment of older adults can be complicated by use of measures that require a diverse set of cognitive skills, it can be difficult to disentangle the effects of any single cognitive domain. Many common measures of visual learning and memory (e.g., WMS Visual Reproductions and the RCFT) rely on cognitive functions other than memory processes, particularly executive functioning (Temple et al., 2006). Given the relative absence of visuoconstructive requirements and reduced executive demands, the VFDT appears to minimize some of the ambiguity of other visual learning/memory measures, further contributing to its clinical utility. Without the motor component required in many assessments of visual memory, the VFDT may be an ideal instrument for use with populations in which motor functioning is impaired, such as patients with spinal cord injuries, Parkinson’s disease, multiple sclerosis, and essential tremor. In addition, recent MRI studies have linked VFDT-Mat performance to brain regions close to the parahippocampal formation (e.g., Campabadal et al., 2020), which may indicate that constructs measured by the VFDT may have the potential to signal early changes in these regions.
It is notable that visual memory is not a core aspect of most brief cognitive screening assessments (Chan et al., 2014), although visual memory dysfunction is a valuable part of the neuropsychological battery. In fact, several common screening measures, e.g., MMSE (Folstein, Folstein, & McHugh, 1975), have a relative absence of visual discrimination and visual memory tasks, whereas other screening batteries, e.g., the Dementia Rating Scale-2, can be limited in regard to subtest difficulty and availability of normative data specific to the visual memory subtests. The VFDT is unique in that it is a stand-alone test with its own normative comparisons, whereas allowing assessors to reduce unintended bias from the impact of visuoperceptual difficulties on visual memory that may be present in other short screening batteries (Lopez, Kenney, Ratajska, Jacobson, & Bowers, 2021).
Overall, the VFDT is relatively easy to use, reduces motor/sensory demands, and can be administered in a brief period of time, making it a useful measure of visuospatial functioning. Along with ease of administration, the benefits of brevity inherent in the VFDT may increase diagnostic classification accuracy of common cognitive screening measures and result in a more holistic view of cognitive functioning under conditions of limited time, such as in a primary care setting. However, the current normative benchmarks for VFDT scores include limited considerations of demographic variables that may impact performance, such as level of education. Our analyses suggest a strong need for comparisons that are adjusted for education to expand the clinical utility of this test, at least among our sample of older Veterans.
Limitations and Future Directions
Although the current research has important implications for the evaluation of neurocognitive functioning, our participants were mostly older male Veterans with memory concerns and educated in the United States, which limits generalizability of the present findings. Further research based on more diverse samples of older adults is needed before results can be applied to general clinical use, particularly as significant differences exist between Veteran and civilian cohorts with regard to physical health, mental health, and substance use (Agha, Lofgren, VanRuiswyk, & Layde, 2000; Hoerster et al., 2012). For example, epidemiological studies have identified increased prevalence of cardiovascular disease among Veterans relative to civilians (Betancourt et al., 2021), which has been known to impact cognition in older males (World Health Organization, 2019). These findings confirm the need for measures of neuropsychological functioning and normative comparisons that are specific to older Veteran populations. Moreover, the present sample is largely composed of male participants and thus may limit generalizability to female Veterans, especially given previous findings of gender differences in visuospatial functioning (e.g., Caparelli-Dáquer, Oliveira-Souza, & Filho, 2009), highlighting the need for further research examining the impact of gender on visuospatial functioning among Veterans.
Conclusion
The VFDT remains a valuable visual memory and visuospatial assessment tool, but without further research supporting its utility as a diagnostic assessment, interpretations may lead to inaccurate diagnoses. Appropriate normative comparisons based on education may increase the clinical appeal of the VFDT; however, diagnosis of a Neurocognitive Disorder should always be made in the context of converging evidence of cognitive dysfunction, supporting history, and declines in functional ability. Despite the absence of education-based norms, the VFDT is currently used in clinical practice and further evidence is needed to support the measure’s utility and ability to enhance diagnostic accuracy. Results from the current investigation provide useful information about the test’s ability to predict likelihood of a neurocognitive disorder, whereas accounting for education, in an older Veteran population. In addition, differences in performance on the VFDT-Rec in comparison with the VFDT-Mat highlight the utility of the two versions as distinct measures of different aspects of visuospatial functioning, making the VFDT a promising potential addition to neuropsychological test batteries.
Acknowledgments
This work was supported by Psychology Service, Research Service and Sierra-Pacific Mental Illness Research Clinical Center, VA Palo Alto Health Care System.
Contributor Information
Brian A Maruyama, Kaiser Permanente Redwood City, Integrated Behavioral Health Services-Mental Health, Redwood City, CA, USA.
Valerie Z Alipio Jocson, Department of Veterans Affairs, VA Palo Alto Health Care System, Palo Alto, CA, USA.
Julie Gretler, Department of Veterans Affairs, VA Palo Alto Health Care System, Palo Alto, CA, USA; Department of Health Psychology, University of Missouri, Columbia, MO, USA.
Kelly Doudell, Department of Psychology, University of Alabama, Tuscaloosa, AL, USA.
Laura C Lazzeroni, Department of Psychiatry and Behavioral Sciences, Stanford University School of Medicine, Stanford, CA, USA.
Beatriz Hernandez, Department of Psychiatry and Behavioral Sciences, Stanford University School of Medicine, Stanford, CA, USA.
Art Noda, Department of Psychiatry and Behavioral Sciences, Stanford University School of Medicine, Stanford, CA, USA.
Jerome A Yesavage, Department of Veterans Affairs, VA Palo Alto Health Care System, Palo Alto, CA, USA; Department of Psychiatry and Behavioral Sciences, Stanford University School of Medicine, Stanford, CA, USA.
Lisa M Kinoshita, Department of Veterans Affairs, VA Palo Alto Health Care System, Palo Alto, CA, USA.
Conflict of Interest
None declared.
References
- Agha, Z., Lofgren, R. P., VanRuiswyk, J. V., & Layde, P. M. (2000). Are patients at Veterans Affairs medical centers sicker? A comparative analysis of health status and medical resource use. Archives of Internal Medicine, 160 (21), 3252–3257. 10.1001/archinte.160.21.3252. [DOI] [PubMed] [Google Scholar]
- American Psychiatric Association. (2013). Neurocognitive disorders. In Diagnostic and statistical manual of mental disorders (5th ed.). [Google Scholar]
- Andersen, G. J. (2012). Aging and vision: Changes in function and performance from optics to perception. Cognitive Science, 3 (3), 403–410. 10.1002/wcs.1167. [DOI] [PMC free article] [PubMed] [Google Scholar]
- Axelrod, B. N., & Ricker, J. H. (1995). Clinical utility of a recognition paradigm of the Visual Form Discrimination Test. Applied Neuropsychology, 2 (3), 150–154. . [DOI] [PubMed] [Google Scholar]
- Benton, A. L., Hamsher, K. d. S., & Stone, F. B. (1977). Visual Retention Test: Multiple choice form 1 Administration F: Visual form discrimination Administration G: Multiple choice-memory. Unpublished manuscript. Iowa City: University of Iowa School of Medicine, Division of Behavioral Neurology. [Google Scholar]
- Benton, A. L., Sivan, A. B., Hamsher, K. d. S., Varney, N. R., & Spreen, O. (1994). Contributions to neuropsychological assessment: A clinical manual. New York: Oxford University Press. [Google Scholar]
- Betancourt, J. A., Granados, P. S., Pacheco, G. J., Reagan, J., Shanmugam, R., Topinka, J. B., et al. (2021). Exploring health outcomes for U.S. veterans compared to non-veterans from 2003 to 2019. Healthcare (Basel, Switzerland), 9 (5), 604. 10.3390/healthcare9050604. [DOI] [PMC free article] [PubMed] [Google Scholar]
- Binder, L. M., Iverson, G. L., & Brooks, B. L. (2009). To err is human: 'Abnormal' neuropsychological scores and variability are common in healthy adults. Archives of Clinical Neuropsychology, 24 (1), 31–46. 10.1093/arclin/acn001. [DOI] [PubMed] [Google Scholar]
- Campabadal, A., Inguanzo, A., Segura, B., Serradell, M., Abos, A., Uribe, C., et al. (2020). Cortical gray matter progression in idiopathic REM sleep behavior disorder and its relation to cognitive decline. NeuroImage: Clinical, 28, 102421. 10.1016/j.nicl.2020.102421. [DOI] [PMC free article] [PubMed] [Google Scholar]
- Campo, P., & Morales, M. (2003). Reliability and normative data for the Benton Visual Form Discrimination Test. The Clinical Neuropsychologist, 17 (2), 220–225. 10.1076/clin.17.2.220.16504. [DOI] [PubMed] [Google Scholar]
- Caparelli-Dáquer, E. M., Oliveira-Souza, R., & Filho, P. M. (2009). Judgment of line orientation depends on gender, education, and type of error. Brain and Cognition, 69 (1), 116–120. 10.1016/j.bandc.2008.06.001. [DOI] [PubMed] [Google Scholar]
- Caplan, B., & Caffery, D. (1992). Development of a normative data base for the Benton Visual Retention Test-multiple choice version. Journal of Clinical and Experimental Neuropsychology, 14, 46. [Google Scholar]
- Caplan, B., & Schultheis, M. T. (1998). An interpretative table for the Visual Form Discrimination Test. Perceptual & Motor Skills, 87 (Suppl. 3), 1203–1207. 10.2466/pms.1998.87.3f.1203. [DOI] [PubMed] [Google Scholar]
- Chan, E., Khan, S., Oliver, R., Gill, S. K., Werring, D. J., & Cipolotti, L. (2014). Underestimation of cognitive impairments by the Montreal Cognitive Assessment (MoCA) in an acute stroke unit population. Journal of the Neurological Sciences, 343 (1–2), 176–179. 10.1016/j.jns.2014.05.005. [DOI] [PubMed] [Google Scholar]
- Fang, C. W., Lin, C. H., Liu, Y. C., & Ou, Y. K. (2018). Differences in road-crossing decisions between healthy older adults and patients with Alzheimer’s disease. Journal of Safety Research, 66, 81–88. 10.1016/j.jsr.2018.06.003. [DOI] [PubMed] [Google Scholar]
- Folstein, M. F., Folstein, S. E., & McHugh, P. R. (1975). “Mini-Mental State”. A practical method for grading the cognitive state of patients for the clinician. Journal of Psychiatric Research, 12 (3), 189–198. 10.1016/0022-3956(75)90026-6. [DOI] [PubMed] [Google Scholar]
- Garcia-Diaz, A. I., Segura, B., Baggio, H. C., Marti, M. J., Valldeoriola, F., Compta, Y., et al. (2018). Structural brain correlations of visuospatial and visuoperceptual tests in Parkinson’s disease. Journal of the International Neuropsychological Society, 24 (1), 33–44. 10.1017/S1355617717000583. [DOI] [PMC free article] [PubMed] [Google Scholar]
- Hamilton, J. M., Salmon, D. P., Galasko, D., Raman, R., Emond, J., Hansen, L. A., et al. (2008). Visuospatial deficits predict rate of cognitive decline in autopsy-verified dementia with Lewy bodies. Neuropsychology, 22 (6), 729–737. 10.1037/a0012949. [DOI] [PMC free article] [PubMed] [Google Scholar]
- Hoerster, K. D., Lehavot, K., Simpson, T., McFall, M., Reiber, G., & Nelson, K. M. (2012). Health and health behavior differences: US military, veteran, and civilian men. American Journal of Preventive Medicine, 43 (5), 483–489. 10.1016/j.amepre.2012.07.029. [DOI] [PubMed] [Google Scholar]
- Hultsch, D. F., MacDonald, S. S., Hunter, M. A., Levy-Bencheton, J., & Strauss, E. (2000). Intraindividual variability in cognitive performance in older adults: Comparison of adults with mild dementia, adults with arthritis, and healthy adults. Neuropsychology, 14 (4), 588–598. 10.1037/0894-4105.14.4.588. [DOI] [PubMed] [Google Scholar]
- Kasai, M., Ishizaki, J., Ishii, H., Yamaguchi, S., Yamadori, A., & Meguro, K. (2009). Normative data on Benton Visual Form Discrimination Test for older adults and impaired scores in Clinical Dementia Rating 0.5 participants: Community-based study. The Osaki-Tajiri Project. Psychiatry and Clinical Neurosciences, 63 (1), 9–16. 10.1111/j.1440-1819.2008.01901.x. [DOI] [PubMed] [Google Scholar]
- Kaskie, B., & Storandt, M. (1995). Visuospatial deficit in dementia of the Alzheimer type. Archives of Neurology, 52 (4), 422–425. 10.1001/archneur.1995.00540280120025. [DOI] [PubMed] [Google Scholar]
- Le Carret, N., Rainville, C., Lechevallier, N., Lafont, S., Letenneur, L., & Fabrigoule, C. (2003). Influence of education on the Benton Visual Retention Test performance as mediated by a strategic search component. Brain and Cognition, 53 (2), 408–411. 10.1016/S0278-2626(03)00155-6. [DOI] [PubMed] [Google Scholar]
- Li, J., Wu, L., Tang, Y., Zhou, A., Wang, F., Xing, Y., et al. (2018). Differentiation of neuropsychological features between posterior cortical atrophy and early onset Alzheimer’s disease. BMC Neurology, 18 (1), 65. 10.1186/s12883-018-1068-6. [DOI] [PMC free article] [PubMed] [Google Scholar]
- Lockwood, C. A., Mansoor, Y., Homer-Smith, E., & Moses, J. A., Jr. (2011). Factor structure of the Benton Visual Retention Tests: Dimensionalization of the Benton Visual Retention Test, Benton Visual Retention Test-Multiple Choice, and the Visual Form Discrimination Test. The Clinical Neuropsychologist, 25 (1), 90–107. 10.1080/13854046.2010.531053. [DOI] [PubMed] [Google Scholar]
- Lopez, F. V., Kenney, L. E., Ratajska, A., Jacobson, C. E., & Bowers, D. (2021). What does the Dementia Rating Scale-2 measure? The relationship of neuropsychological measures to DRS-2 total and subscale scores in non-demented individuals with Parkinson’s disease. The Clinical Neuropsychologist, 1–20. 10.1080/13854046.2021.1999505. [DOI] [PMC free article] [PubMed] [Google Scholar]
- Lopez, M. N., Charter, R. A., Oh, S., Lazar, M. D., & Imperio, S. M. (2005). Psychometric properties of the Benton Visual Form Discrimination Test. Applied Neuropsychology, 12 (1), 19–23. 10.1207/s15324826an1201_4. [DOI] [PubMed] [Google Scholar]
- Marmar, C. R., Schlenger, W., Henn-Haase, C., Qian, M., Purchia, E., Li, M., et al. (2015). Course of posttraumatic stress disorder 40 years after the Vietnam War: Findings from the National Vietnam Veterans Longitudinal Study. JAMA Psychiatry, 72 (9), 875–881. 10.1001/jamapsychiatry.2015.0803. [DOI] [PubMed] [Google Scholar]
- McGuire, C., Crawford, S., & Evans, J. J. (2019). Effort testing in dementia assessment: A systematic review. Archives of Clinical Neuropsyschology, 34 (1), 114–131. 10.1093/arclin/acy012. [DOI] [PubMed] [Google Scholar]
- Mitrushina, M., Boone, K. B., & D’Elia, L. F. (1999). Handbook of normative data for neuropsychological assessment. New York: Oxford University Press. [Google Scholar]
- Moses, J. A. (1986). Factor structure of Benton’s Tests of Visual Retention, Visual Construction, and Visual Form Discrimination. Archives of Clinical Neuropsychology, 1 (2), 147–156. 10.1093/arclin/1.2.147. [DOI] [PubMed] [Google Scholar]
- Nabors, N. A., Vangel, S. J., Jr., & Lichtenberg, P. A. (1996). Visual Form Discrimination Test with elderly medical inpatients. Clinical Gerontologist, 17 (1), 43–53. 10.1300/j018v17n01_04. [DOI] [Google Scholar]
- Postuma, R. B., Iranzo, A., Hu, M., Högl, B., Boeve, B. F., Manni, R., et al. (2019). Risk and predictors of dementia and parkinsonism in idiopathic REM sleep behaviour disorder: A multicentre study. Brain, 142 (3), 744–759. 10.1093/brain/awz030. [DOI] [PMC free article] [PubMed] [Google Scholar]
- Reger, M. A., Welsh, R. K., Watson, G., Cholerton, B., Baker, L. D., & Craft, S. (2004). The relationship between neuropsychological functioning and driving ability in dementia: A meta-analysis. Neuropsychology, 18 (1), 85. 10.1037/0894-4105.18.1.85. [DOI] [PubMed] [Google Scholar]
- Reppermund, S., Sachdev, P. S., Crawford, J., Kochan, N. A., Slavin, M. J., Kang, K., et al. (2011). The relationship of neuropsychological function to instrumental activities of daily living in mild cognitive impairment. International Journal of Geriatric Psychiatry, 26 (8), 843–852. 10.1002/gps.2612. [DOI] [PubMed] [Google Scholar]
- Robinson, A. C., McNamee, R., Davidson, Y. S., Horan, M. A., Snowden, J. S., McInnes, L., et al. (2018). Scores obtained from a simple cognitive test of visuospatial episodic memory performed decades before death are associated with the ultimate presence of Alzheimer disease pathology. Dementia and Geriatric Cognitive Disorders, 45 (1–2), 79–90. 10.1159/000486827. [DOI] [PubMed] [Google Scholar]
- Salimi, S., Irish, M., Foxe, D., Hodges, J. R., Piguet, O., & Burrell, J. R. (2018). Can visuospatial measures improve the diagnosis of Alzheimer's disease? Alzheimer's & Dementia: Diagnosis, Assessment & Disease Monitoring, 10 (1), 66–74. 10.1016/j.dadm.2017.10.004. [DOI] [PMC free article] [PubMed] [Google Scholar]
- Salimi, S., Irish, M., Foxe, D., Hodges, J. R., Piguet, O., & Burrell, J. R. (2019). Visuospatial dysfunction in Alzheimer's disease and behavioural variant frontotemporal dementia. Journal of the Neurological Sciences, 402, 74–80. 10.1016/j.jns.2019.04.019. [DOI] [PubMed] [Google Scholar]
- SAS Institute Inc. (2013). SAS® 9.4 [Computer Software]. Cary, NC: SAS Institute Inc. [Google Scholar]
- Schwarz, L., Penna, S., & Novack, T. (2009). Factors contributing to performance on the Rey Complex Figure Test in individuals with traumatic brain injury. The Clinical Neuropsychologist, 23(2), 255–267. [DOI] [PubMed] [Google Scholar]
- Sengupta, P., Ganguly, J., Pal, S., & Ghosal, M. (2019). Pattern of cognitive deficits in vascular dementia. The Indian Journal of Medical Research, 149 (4), 503–507. 10.4103/ijmr.IJMR_1336_17. [DOI] [PMC free article] [PubMed] [Google Scholar]
- Temple, R. O., Davis, J. D., Silverman, I., & Tremont, G. (2006). Differential impact of executive function on visual memory tasks. The Clinical Neuropsychologist, 20(3), 480–490. [DOI] [PubMed] [Google Scholar]
- Watson, P. A., Gignac, G. E., Weinborn, M., Green, S., & Pestell, C. (2020). A meta-analysis of neuropsychological predictors of outcome following stroke and other non-traumatic acquired brain injuries in adults. Neuropsychological Review, 30 (2), 194–223. 10.1007/s11065-020-09433-9. [DOI] [PubMed] [Google Scholar]
- WHO Guidelines Approved by the Guidelines Review Committee (2019). Risk reduction of cognitive decline and dementia: WHO guidelines (p. 96). Geneva: World Health Organization. [PubMed] [Google Scholar]