

Abstract
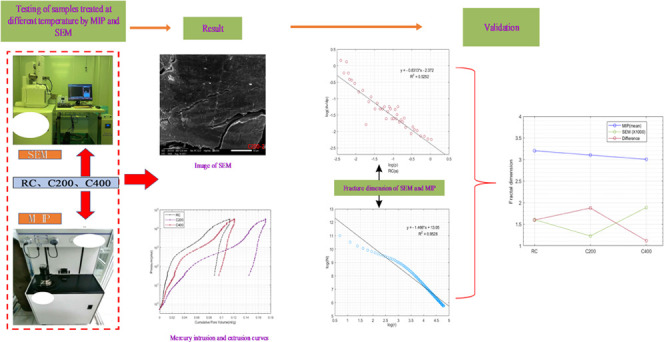
In order to understand the influence of underground coal fires on coal fractures and pores, mercury intrusion porosimetry (MIP) and scanning electron microscopy (SEM) are combined to study the development of coal pore and fracture under high-temperature treatment and calculate the fractal dimension to analyze the relationship between the development of coal pore and fracture and the fractal dimension. The results show that the volume of pores and fractures of the coal sample (C200) treated at 200 °C (0.1715 mL/g) is greater than that of the coal sample (C400) treated at 400 °C (0.1209 mL/g), and both are greater than the original coal sample (RC) (0.1135 mL/g). The volume increase is mainly due to mesopores and macropores, and the proportions of mesopores and macropores in C200 were 70.15 and 59.97% in C400. The MIP fractal dimension shows a decreasing trend with the increase of temperature, and the connectivity of coal samples improved with the increase of temperature. The changes in volume and three-dimensional fractal dimension of C200 and C400 showed the opposite trend and are related to the different stress of coal matrix at different temperatures. The experimental SEM images confirm that the connectivity of coal fractures and pores improves with the increase of temperature. Based on the SEM experiment, the larger the fractal dimension, the more complex the surface is. The SEM surface fractal dimensions indicate that the surface fractal dimension of C200 is the smallest and that of C400 is the largest, which is consistent with the observations made by SEM. The combination of the two fractal dimensions is used to characterize the self-similarity of coal using the fractal dimension difference. When the temperature increased to 200 °C, the unordered expansion of the coal sample resulted in the largest fractal dimension difference and the lowest self-similarity. When heated to 400 °C, the fractal dimension difference of the coal sample is the smallest, and the microstructure of coal shows a regular groove-like development.
1. Introduction
China’s coal industry is seriously affected by underground coal fires. There are still over 200 coal fire areas in the northwest region of China, among which the RuJi Gou mining area in Helan Mountain, Ningxia, has been burning for over 300 years, causing an annual loss of about 1 billion yuan. The world’s largest Xinjiang coalfield still has a fire area of 9.92 × 10⁶ m2, and the Uda mining area in Inner Mongolia still has coal reserves with an extreme self-ignition threat of 5.087 × 10⁷ t. Currently, coal spontaneous combustion is based on the hypothesis of the coal–oxygen combination, as coal is a porous medium and high temperatures during coal fires affect the development of its pore and fracture structure. The development of these pores and fractures allows air to infiltrate into the coal fire area, affecting the trend of coal fire spreading.
There are several experimental methods for analyzing the structure of coal fractures and pores, including mercury intrusion porosimetry (MIP), scanning electron microscopy (SEM), computed tomography layered scanning method (CT), and nuclear magnetic resonance (NMR).1−6 Since the establishment of fractal theory by Mandelbrot,7−9 many scholars10−15 have attempted to combine experiments with fractal theory to analyze the fractal characteristics of rock pores and fractures. Fu16 and Yao17 used MIP measurement to obtain the surface fractal dimension of coal-permeable pores and concluded that the nonuniformity of the pores is mainly determined by the coal rank, composition, and pore size distribution. However, Li18 thought that the pore compression effect during the high-pressure mercury intrusion stage could not accurately obtain small pores through MIP, especially when the pressure is greater than 10 MPa. Based on coal surface images, Alekseev19 used the box-counting method to obtain the surface heterogeneity and pore structure distribution characteristics. Through this fractal construction method, denoised grayscale images can be obtained, which can effectively distinguish between the pore and solid structures. On this basis, Yang20 proposed a theoretical model that can measure the fractal dimension of solid structures. In this process, the physical meaning of the fractal dimension of the fracture spatial structure measured by SEM and MIP was proposed. In terms of the complexity of the spatial structure, Liu21 used nuclear magnetic resonance technology and on-site coal seam water injection experiments to obtain fractal parameters such as the water-injected fractal dimension and theoretical fractal dimension of coal pores and measured the structural changes of coal specimens under different stresses and pore water pressures. Naveen22 used two-dimensional FE-SEM data and three-dimensional tomographic interface Amira software to reconstruct a three-dimensional model of pore structure and connectivity and quantitatively analyzed the pore area to obtain the real pore connectivity. The results showed that the higher the fractal dimension of the matrix, the more complex the pore structure is. Jin23 proposed an open mathematical framework to describe the complexity assembly in the microstructure, which provides a new theoretical approach to describe the complex structure of porous media. Liu24 considered the fractal theory of porous media and the multifield model of coal seams. Taking into account the influence of the fracture-pore structure, a multifield coupled mechanics model was established to study the evolution mechanism of coal seam physical and mechanical parameters. Pan25 tested six coal samples with different metamorphic grades using scanning electron microscopy and quantitatively characterized the surface fracture porosity using fractal geometry theory. The research showed that the metamorphic grade is positively correlated with the surface density of fractures. Cardott26 used scanning electron microscopy to observe primary micropores and found that due to deep burial compaction and metamorphic strength, the primary micropores of low-rank coal are higher than those of medium-rank coal. Roslin27 used micro-CT and SEM techniques to analyze the fractal structure of coal samples and simulate permeability. The results showed that the simulated permeability was approximately equal to the analytical approximation. Tripathy28 improved the watershed segmentation of SEM images and plotted three-dimensional and two-dimensional surface strength maps. The fractal dimension D of the LPN (2) GA was between 2.55 and 2.78, indicating a high degree of complexity in its fractal pattern. The three-dimensional surface strength map is useful for understanding the anisotropy of shale brought by preferred orientation of clay minerals in cinematography. The research results can be extended to understand the gas flow behavior within the complex pore system exhibited by shale. Wang29 used a three-dimensional reconstruction model and the three-dimensional box-counting method to calculate the fractal dimensions of the total pore structure (Df), solid structure (Ds), and connected pore structure (Dc). Through research, it was found that the three fractal dimensions have different degrees of correlation with permeability. Liu30 tested the internal microstructure of braided coal with different degrees of metamorphism using three methods, namely, MIP, SEM, and NMR, and calculated the fractal dimensions. The larger the three-dimensional fractal dimension, the higher the degree of metamorphism, and the difference between the three-dimensional fractal dimension tested by MIP and the two-dimensional fractal dimension tested by SEM was 1. Liu31 tested the pore structure and fractal characteristics of coal under liquid nitrogen cold soaking for different coal qualities, which indicate that the average pore size and fractal dimension D1 of each coal sample increase linearly with the increase of liquid nitrogen cold soaking times.
Yang32 studied fracture propagation at high temperatures. The results showed that the volume of pores and fractures increase with temperatures rose. The thermal fracturing temperature threshold for anthracite is 300 °C. Sun33 analyzed the influence of thermal damage on the evolution of the pore structure by SEM and NMR (the highest treatment temperature was 300 °C). The results showed that the connectivity of the pore is growing, and the fracture is expanded and improved with increasing temperature. The fractal dimension micropores, medium-sized pores, and big-sized pores decreased with the increase of treatment temperature. Su34 deeply investigated the effect of high temperature on the structure. The results showed that the total porosity of coal samples increases with the increase of heating temperature. Tang35 researched pore evolution at different scales during the spontaneous combustion of coal (the highest treatment temperature was 230 °C). The results showed that the total porosity of coal samples increases with the process of the spontaneous combustion of coal.
In summary, it has been found that various experimental and fractal calculations can effectively characterize the microstructure of coal. However, research on the changes in the surface and internal microstructure of coal under high-temperature conditions, as well as quantitative characterization of fractal dimension based on experiments, is rarely seen. Therefore, based on the research background of underground coal fires and the work of numerous scholars, this paper proposes a method for quantitatively characterizing changes in porosity and fractures and fractal dimensions of coal at different temperatures.
In order to study the development of porosity and fractures in coal at different temperatures, this paper used MIP to calculate the volume changes of coal fractures and pores and the fractal dimension of MIP. The paper also discussed the relationship between the fractal dimension of MIP and the volume changes, as well as the reasons for these changes. Additionally, SEM was used to observe the changes in the surface microstructure of coal with different temperatures, and the surface fractal dimension was calculated to characterize the surface roughness. The relationship between the fractal dimensions of MIP and SEM was also discussed. Through this research, theoretical basis and fractal characterization methods were provided for the development of fractures and porosity in coal affected by underground coal fires.
2. Experiments
2.1. Coal Sample Selection
The experimental coal samples were collected from the Sulphur Gully mine area in Xinjiang Uygur Autonomous Region, which is located in an area of high risk for coal mine fires in China. The coal samples were taken from the Yan shan Formation of the Middle Jurassic period and belong to the bituminous coal category. Due to the difficulty of obtaining coal samples from the fire zone, the samples used in this study were collected from freshly exposed coal on the working face36−38 underground. They were quickly wrapped in plastic film and transported to the laboratory. After removing the outer layers in a nitrogen atmosphere, the inner coal core was obtained by cutting, grinding, and sieving. Using coal samples from this region in the experiment could better characterize the development of porosity and fractures in coal under high temperatures caused by underground coal fires. Five grams of coal with a particle size of 80–200 mesh was used in the experiment. The results of industrial analysis and elemental analysis for the experimental coal sample are shown in Table 1.
Table 1. Proximate and Ultimate Analyses for the Experimental Coal.
| industrial
analysis (%) |
elemental
analysis (%) |
|||||||
|---|---|---|---|---|---|---|---|---|
| Mad | Aad | Vad | FCdaf | Cdaf | Hdaf | Ndaf | Sdaf | Odaf |
| 3.86 | 6.65 | 25.61 | 63.88 | 70.86 | 5.44 | 0.69 | 0.37 | 7.81 |
2.2. Coal Sample Preparation
The present study applied a muffle furnace to heat the coal samples to 200 and 400 °C.
-
(1)
The coal samples were placed in the muffle furnace and heated to the desired temperatures (200 and 400 °C) for 90 min.
-
(2)
After the high-temperature treatment, the coal samples were wrapped in high-temperature asbestos and placed in a vacuum-sealed bag under nitrogen gas in order to prevent the coal from oxidizing completely in air.
-
(3)
The original coal, 200 °C treated coal, and 400 °C treated coal were labeled as RC, C200, and C400, respectively.
2.3. Experimental System
Figure 1 shows the JSM-IT500HR scanning electron microscope. It has a maximum magnification of 200,000 times. The experimental coal samples treated with different temperatures were scanned after gold spraying, and the evolution characteristics of pores and cracks were observed from the visual images with different multiples.
Figure 1.

JSM-IT500HR Scanning Electron Microscope.
The type of Mercury Porosimeter is AUTOPORE-IV 9500 and it enables pore sizes above 3.0 nm. The amount is shown in Figure 2.
Figure 2.

AUTOPORE-IV Mercury Porosimeter.
2.4. Experimental Process
2.4.1. SEM
-
(1)
After the high-temperature treatment, coal samples were lightly tapped to obtain specimens with dimensions of length, width, and height less than or equal to 0.5 cm.
-
(2)
These experimental coal samples were then subjected to gold spraying to improve their electrical conductivity.
-
(3)
The morphology of the coal samples was scanned after being treated at different temperatures to capture the morphological features of the damage caused by porosity and fractures in the coal sample due to temperature.
2.4.2. MIP
-
(1)
The coal samples treated at different high temperatures were cooled to room temperature under a nitrogen atmosphere and then dried in a vacuum oven for 2 h to remove any moisture interference.
-
(2)
Approximately 3 ± 0.1 g of each coal sample from each temperature group was placed into a pycnometer and sealed, and then mercury was introduced into the pycnometer. First, the macropore structure was measured at a low-pressure station, and then the mesopores and micropores were measured at a high-pressure station. The initial pressure of mercury was set at 0.5 psia. Liquid mercury entered the pores in sequence as the pressure increased, entering the larger pores first and then smaller pores.
-
(3)
The liquid mercury would infiltrate all types of pores before reaching saturation pressure. Finally, the mercury retreated after reaching the saturation pressure, and the instrument automatically analyzed the pore volume, pore area, porosity parameters, etc.
3. Theory
3.1. Fractal Dimension Theory and Numerical Calculation in MIP
The MIP method uses pressure to overcome surface tension between pores to measure the pore size. Different pressures can fill pores of varying sizes. According to Washburn39
| 1 |
where σ is the surface tension and θ is the contact angle between mercury and the solid, which is typically assumed to be 140°. In fact, the MIP measures the inverse relationship between p and r. As shown by Friesen40
| 2 |
In eq 2, v represents the pore volume, and D is the fractal dimension, which can be determined by measuring the pore volume as a function of pore radius.
The total pore volume at a given pressure in the laboratory is obtained from the volume of mercury intruded into the pores. Equations 1 and 2 could be combined as follows
| 3 |
In eq 3, p is the pressure of the mercury intrusion; dvp(cm3/g) represents the volume increase per unit mass at each incremental pressure increase, dp; D represents the surface fractal dimension; k = D – 4 is the slope of eq 3 (D ≤ 3), and k is generally negative.
Based on the experimental values of pressure (p) and intrusion volume (vp), directly using eq 3 for calculations based on experimental values of pressure (p) and intrusion volume (vp) is not possible, and numerical processing is needed. Assuming that in a certain pressure range [pi, pi + 1], the corresponding volume change is [vi, vi + 1]
| 4 |
| 5 |
| 6 |
Combining eqs 3–6 and using a custom
program, we can obtain a  curve, and the fractal dimension of the
MIP can be determined by performing a linear fitting on the obtained
curve.
curve, and the fractal dimension of the
MIP can be determined by performing a linear fitting on the obtained
curve.
According to the principle of mercury intrusion porosimetry, we can analyze the mathematical meaning of fractal dimension. When the pressure change interval is fixed, the larger the volume change, the larger the value of k and the corresponding fractal dimension value D, indicating that under the same pressure, the larger the fractal dimension, the easier it is for mercury to enter the microfractures in coal samples. This can reflect the ease of mercury intrusion into coal samples and can be used in conjunction with the data relationship between the pressure and pore size obtained from mercury intrusion measurements for analysis purposes.
3.2. Box-Counting Method and Image Processing
According to fractal theory
| 7 |
where r is the fractal division size, which can be the length of the sides of a 2D plane or a 3D model, or the radius of a sphere. N is the number of small squares (2D) or cubes (3D) when dividing the edge length r, and S is the calculated area (2D) or volume (3D), which is usually a constant value. D is the fractal dimension when the edge length is r. As r → + ∞
| 8 |
The box-counting method was proposed by Bouligand41 in 1929, and the concept of box dimension was defined by Falconer,42 which provided us with a calculation method. The method involves dividing a geometric object into boxes with different sizes r counting the number of boxes containing all calculated elements, and obtaining a series of N and r data points by performing a linear fitting on these data points using eq 7, we can obtain a slope of ‘–D’. This method is simple and fast, and is currently the most widely used method for calculating fractal dimension.
SEM scanning images need to be processed before using the box-counting method to calculate fractal dimension. The image processing workflow is as following.
-
(1)
Grayscale conversion: Convert the scanned JPG-format RGB image to a grayscale image.
-
(2)
Denoising: Wavelet method can be used to effectively denoise the image. The image is decomposed into two levels using a wavelet function. First, the low-frequency signal of the first level is extracted to obtain the denoised image of the first level, and then the low-frequency signal of the second level is extracted to obtain the denoised image of the second level. Finally, the two denoised images are reconstructed. Essentially, it performs low-frequency denoising twice on an image.
-
(3)
Convert the denoised image into a binary image: By setting different thresholds, obtain a binary image that conforms to the original image.
-
(4)
Calculate the fractal dimension: After processing the binary image, which contains only two types of pixels, 0 and 1, finding the number of boxes N containing pixel 1 for a fixed side length r, and continuously changing the side length r to obtain different values of N.
-
(5)
Linear fitting: By using the least-squares method to fit the values of N and r obtained for different fractal dimensions, we can obtain a straight line with a slope of ‘– D ’.
By using the box-counting method, we can analyze the mathematical meaning of fractal dimension. Suppose the area is constant (i.e., S is a fixed value), when the side length r takes a certain value, the larger the value of N, the smaller the slope and the larger the fractal dimension D. This indicates that the surface distribution becomes more uneven. In this case, the fractal dimension can characterize the complexity or roughness of the surface. The larger the fractal dimension, the more complex the surface.
4. Results and Discussion
4.1. Development of the Coal Microstructure and Its Characterization with Fractal Dimension Based on the MIP Method
4.1.1. MIP Experimental Results
According to the relationship between hysteresis loops and gas flow in the pore morphology model, the classification method proposed by XOJIOT43 is adopted to classify the pores, as shown in Table 2.
Table 2. Classification of Pore Types.
| pore type | pore diameter (nm) | closure type |
|---|---|---|
| micropore | <10 | closed and semiclosed pores |
| minipore | 10–100 | closed and semiclosed pores |
| mesopore | 102–103 | closed and semiclosed pores |
| macropore | 103–105 | open pores |
| visible pores and fractures | >105 | open pores |
Based on the MIP test results, we draw the mercury intrusion and extrusion curves for coal samples treated at different temperatures, as shown in Figure 3.
Figure 3.

Mercury intrusion and extrusion curves of coal samples treated at different temperatures.
The trends of mercury intrusion and extrusion curves of the RC coal sample at different temperatures are roughly the same. Also, hysteresis loops are observed during both the complete mercury intrusion and extrusion processes, indicating a significant number of pores with the pore size larger than 1000 nm existing in the coal sample and mostly open pores. The closed pores cannot exist but only a small fraction of semiclosed pores may exist. Comparing the increasing trends of mercury intrusion curves for coal samples treated at different temperatures, it can be seen that the volumes of mesopore, macropore, visible pores, and fractures contribute significantly to the total volume of the pore structure in C200 and C400 samples as the temperature increases. This is because under the same pressure range, the mercury intrusion volume of the coal sample treated at a higher temperature is higher, and the total mercury intrusion volume of the coal sample treated at a higher temperature is greater than that of the RC raw coal when reaching the turning point pressure. Comparing the mercury intrusion and extrusion curves of C200 and C400 samples reveals that the intrusion volume of C200 is higher than that of C400, and the turning point pressure of C200 is smaller than that of C400 (and the volume proportion of C200 is also greater than that of C400). The reason for this can be attributed to the fact that the C400 coal sample is influenced by a higher temperature, resulting in an increase in vitrinite, particles, cementing materials, and minerals. After undergoing thermal consumption, these substances are clearly observed to exist in pores and fractures from SEM images.
MIP can be used to analyze the correlation between pore size and cumulative pore volume, as well as the stage pore volume of coal samples with pore size above 3 nm treated at different temperatures and to analyze the changes in curve data trends, thereby the pore volume distribution of coal samples treated at different temperatures studied.
From Figure 4, it can be seen that the total pore volume of the coal sample treated at a high temperature of 200 °C is significantly larger than that of the raw coal sample, and the change trends of cumulative pore volume at each stage are similar. There is a significant difference in pore volume in the mesopore range, indicating that the increase in temperature to 200 °C affects the pore volume of all types of pores in the coal, with a greater impact on mesopores. From Figure 5, it can be observed that the C400 coal sample has a pore volume trend and value that is very close to that of the RC coal sample, with almost identical micropore volume, indicating that the pore volume and distribution of RC and C400 coal samples are very similar. To quantitatively study the effect of temperature on pore volume, a list of pore volumes occupied by different pore types is presented in Table 3.
Figure 4.

Pore volume distribution and pore size distribution of the RC coal sample and C200.
Figure 5.

Pore volume distribution and pore size distribution of the RC coal sample and C400.
Table 3. Pore Volumes of Coal Samples Treated at Different Temperatures.
| pore
volume distribution at each pore size stage (mL/g) |
||||||
|---|---|---|---|---|---|---|
| coal sample type | total pore and fracture volume | micropore | minipore | mesopore | macropore | visible pores and fractures |
| RC | 0.1135 | 0.0187 | 0.0382 | 0.0373 | 0.0149 | 0.0044 |
| C200 | 0.1715 | 0.0146 | 0.0281 | 0.0668 | 0.0535 | 0.0085 |
| C400 | 0.1209 | 0.0126 | 0.0299 | 0.0459 | 0.0266 | 0.0059 |
Based on the combination of Table 3 and Figures 4–6, it can be concluded that the total pore volume of the coal samples after high-temperature treatment is larger than that of the RC. The largest pore volume is observed in the C200 sample, which was 0.1715 mL/g, while the pore volume of the C400 sample was 0.1209 mL/g, which is not significantly different from that of RC (0.1135 mL/g).
Figure 6.

Proportion of pore volume for each pore type.
Analysis of the pore volume and proportion for each pore type revealed: In the RC sample, minipores and mesopores occupy the main pore volume, minipores with a volume of 0.0382 mL/g (33.66% of the total pore volume), followed by mesopores with 0.0373 mL/g (32.86% of the total pore volume). After temperature increase, mesopores and macropores become the main contributors to the increased pore volume. In the C200 sample, the volume of mesopores is 0.0668 mL/g (38.95% of the total pore volume), and the volume of macropores is 0.0535 mL/g (31.20% of the total pore volume). Although the volume of micropores decreases, in comparison to RC, the volume of micropores in the C200 sample is also significant at 0.0281 mL/g (16.38% of the total pore volume) and in the C400 sample it is 0.0299 mL/g (24.73% of the total pore volume). The volumes of macropores and visible fractures show a trend of first increasing and then decreasing as the temperature increases. In the RC sample, the volume of visible fractures is 0.0044 mL/g (3.88% of the total pore volume), while in the C200 sample, it is 0.0085 mL/g (4.96% of the total pore volume), and in the C400 sample, it is 0.0059 mL/g (4.88% of the total pore volume). From the perspective of volume changes, the total pore volume of the RC is 0.1135 mL/g, and after high-temperature treatment, it increases by 0.058 mL/g at 200 °C and 0.0074 mL/g at 400 °C. The difference in volume is mainly reflected in minipores, mesopores, and macropores. The decrease in minipores is not significant, whereas the increase in mesopores and macropores is the main reason for the increase in total pore volume for both C200 and C400 samples. The difference in total pore volume between C200 and C400 samples is mainly due to the difference in mesopores and macropores. The difference in the volume proportion of macropores is greater (9.2%), whereas that of mesopores is smaller (0.08%). This suggests that different high-temperature treatments yield different results in pore volume, with higher temperatures leading to different effects. The C200 and C400 samples perfectly illustrate this phenomenon.
4.1.2. Calculation and Analysis of Fractal Dimension Based on the MIP Method
Based on the MIP data, the relationship between mercury intrusion pressure (p) and pore diameter (r) can be observed from Figure 7 and Table 3. Figure 7 shows the pore diameters measured at different mercury intrusion pressures. Based on the curve in Figure 7 and on Friesen,40 we calculate the fractal dimension of the MIP data for different pressure ranges. The pressure ranges are divided into three categories: low-pressure range (p < 1.0 MPa), medium-pressure range (1.0 MPa < p < 10 MPa), and high-pressure range (p > 10 MPa).
Figure 7.

Curves of mercury intrusion pressure and pore diameter.
Based on eqs 3–6, the  curves are obtained, and the MIP fractal
dimension is calculated by linear fitting using the least-squares
method. The fitting curves of the coal samples in different pressure
ranges under different temperatures are shown in Figure 8.
curves are obtained, and the MIP fractal
dimension is calculated by linear fitting using the least-squares
method. The fitting curves of the coal samples in different pressure
ranges under different temperatures are shown in Figure 8.
Figure 8.

Fractal dimension in different pressure ranges of coal samples treated at different temperatures (a, b, c represent low-, medium-, and high-pressure ranges, respectively).
Table 5 summarizes the results of fractal dimension calculation. It can be seen that the fractal dimension is in the interval of [2.89,3.3], which does not conform to the definition of three-dimensional fractal dimension. The main reason for this may be the uneven distribution of fractures and pores in the coal, which affects the uniformity of mercury intrusion and results in measurement volume deviations. From Table 4, it can be seen that under the same pressure range, the fractal dimension of coal samples treated at higher temperatures is smaller. The fractal dimension of C400 is smaller than that of C200 for pore diameters less than 200 nm, indicating that higher temperatures make mercury intrusion easier and the internal structure more interconnected. This result is inconsistent with the MIP pore and fracture volume results. Although the total pore and fracture volume, as well as the medium and large pore volume of C200 are larger than those of C400, the fractal dimension of low- and medium-pressure ranges for C400 is smaller than that of C200, which is inconsistent with normal logical thinking.
Table 5. Result of MIP Fractal Dimension Calculation.
| pressure ranges (MPa) | pore type | RC | C200 | C400 |
|---|---|---|---|---|
| P < 1 | macropore and above | 3.1687 | 3.1203 | 3.0825 |
| 1 < P < 10 | mesopore | 3.1832 | 2.9170 | 2.8920 |
| P > 10 | minipore and below | 3.2571 | 3.2198 | 3.0367 |
| mean | 3.2030 | 3.1026 | 3.0037 |
Table 4. Pore Diameter Ranges for Different Mercury Intrusion Pressure Ranges.
| mercury intrusion pressure (MPa) | pore diameter (nm) | pore types |
|---|---|---|
| 0.03–0.125 (0.3–18 psia) | >105 | visible pores and fractures |
| 0.13–1.184 (18.98–171.56 psia) | 103–105 | macropore |
| 1.5–10.1 (217–1679 psia) | 102–103 | mesopore |
| 13–123 (1897–17956 psia) | 10–100 | minipore |
| 137–217.1412 (19959–31488 psia) | <10 | micropore |
This article analyzes and discusses the issue. According to the results of pore and fracture volume analysis in Section 4.1.1, the increase in the volumes of macropores and mesopores is much greater than the decrease in other pores (the relative increase in the volumes of macropores and mesopores in C200 compared to RC is 0.0681 mL/g, while the decrease in small pores is 0.0101 mL/g). This indicates that the increase in pore and fracture volume in coal samples from C200 is mainly due to the generation of new fractures and pores, which is the result of the combined effects of coal matrix shrinkage and thermal stress expansion,44 when C200 coal samples are treated at high temperature, the thermal expansion force exceeds the shrinkage force, making it easy for fractures and pores to form due to the uneven distribution of forces in porous media. The expansion of the coal sample creates new fractures and pores quickly, and some small pores are also easily broken under pressure to form macropores, mesopores, and even fractures. For C400, the coal samples are first subjected to a temperature increase treatment, and when they reach 200 °C, the growth of fractures and pores is similar to that of C200. However, as the temperature continues to increase, the thermal expansion force of the coal samples reaches its maximum, and the generation of fractures and pores reaches its peak. The coal matrix shrinkage force will have the opposite effect on the already generated fractures and pores, causing them to contract. According to the mechanical properties of fractures and pores, they are prone to become stress concentration zones when subjected to forces again. At this time, the fractures and pores begin to break and interconnect with each other, making the distribution of pores and fractures in the coal sample more uniform, and the connectivity between pores and fractures more developed. The difference between the macropore and mesopore volumes of C200 and C400 indicates that the shrinkage of pores and fractures mainly occurs in the macropores and mesopores; visible pores and fractures should also be calculated, which makes the distribution of pores and fractures in C400 more uniform than those in C200. The connectivity between pores and fractures of different sizes is also more silky and smooth in C400. This is further confirmed by Wang’s work45 that the average pore size of the C400 coal sample is larger than that of C200. Since C200 experienced rapid expansion in the early stages, the interconnectivity between pores and fractures is poorer than that in C400, resulting in a fractal dimension greater than that of C400 for C200 despite its small dimension compared with RC due to its rapid development in the early stage. Additionally, although the fractures and pores generated by C200 at a high temperature have poor connectivity, they develop faster inside C200, making it more porous than C400. As the pressure of injecting mercury gradually increases, the fractures and pores that are inherently poorly connected will be opened up by the pressure. This may be another key reason why the pore and fracture volume and fractal dimension are both greater for C200 than for C400. The processing time may also be an important factor.
Through analysis, it is found that the simple volume change cannot fully reflect the complexity of internal fracture changes in coal samples after high-temperature treatment. By introducing fractal dimension and combining volume changes at different temperatures, it is demonstrated that the changes in coal sample internal fractures and the complexity of coal internal structure are affected by the volume change and connectivity of pores and fractures. Based on Tables 5 and 3 and the aforementioned analysis, it is shown that the fractures and pores of coal samples subjected to high-temperature treatment have developed in terms of volume and connectivity. As the temperature increases, the fractal dimension decreases and the connectivity of fractures and pores improves. The distribution of pores and fractures of different sizes in the coal sample is relatively uniform. This fractal dimension result is consistent with the conclusion drawn by Li.
4.2. Characterization of the Coal Microstructure and Fractal Dimension Based on SEM
4.2.1. Results of SEM
Different temperature effects on the structural characteristics of coal pores, such as the size, shape, and connectivity, can be directly compared through scanning electron microscopy (SEM) observation. The magnifications used are 6000, 8000, and 10 000 times, respectively, as shown in Figure 9.
Figure 9.

SEM images of pores of coal samples at different temperatures (the magnifications from left to right were X6000, X8000, and X10000).
The surface of the RC original coal sample is tight and covered with small mineral particles, with small primary fractures and poor connectivity between pores and fractures. After baking at 200 °C, it is observed that high temperature causes roughness on the surface of the C200 coal sample, with increased presence of fractures and collapse fractures, as well as the appearance of layered vitreous bodies. The surface of the fractures is smoother, and connectivity between pores and fractures began to form. The size of the pores is comparable to that of the RC coal sample. As the temperature continued to increase to 400 °C, as seen in panel (c), the surface of the C400 coal sample became extremely rough. Numerous gas pore clusters appeared on the coal surface, with many vitreous bodies attached, indicating that the coal surface is consumed by high temperature. The primary pores are destroyed, and fewer formed pores are observed. Layering became more apparent, with higher permeability characteristics. The pore size is significantly larger than that of the C200 coal sample.
After high-temperature treatment, coal is subject to thermal stress
and expands, causing primary fractures to continuously expand and
extend, which significantly impacts the mechanical properties and
permeability characteristics of coal. In this section, SEM magnification
is adjusted sequentially at 300, 500, and 1000 times to observe the
development of fractures in coal samples at different temperatures. Figure 10 shows the development
of fractures under different temperatures. The surface fractures of
coal samples are observed after exposure to different temperature
treatments. The RC original coal sample itself has few primary fractures,
with a few mineral particles attached to the surface of the coal body.
The fractures present a “ ” shape, and the main
fracture length is close to 0.25 mm, with no obvious new fractures
near the fracture and a smooth edge. It can be inferred that this
fracture is the primary fracture of the coal sample. After baking
at 200 °C, as seen in panel (b), the surface of the coal sample
appears smoother. From the contrast between the shadow and light of
the image, it can be seen that the C200 coal sample in the center
of the image exhibited expansion and outward bulging. The fractures
are mostly present in the darker bulged shadow areas, with uneven
width and length throughout the entire image. The fracture surface
is rough, with many tiny fractures budding near the main fracture
and connected to it, forming a “T” shape. The width
of the parallel fractures is smaller than that of the perpendicular
fractures, and according to panel (b) C200, the perpendicular fracture
is the primary fracture, while the parallel fracture is a tiny fracture
associated with the main fracture. With increasing temperature, thermal
stress widens these fractures, and all of the fracture surfaces are
rough, with a stepped layer structure. When the temperature continued
to increase to 400 °C, as shown in panel (c), the surface of
the C400 coal sample became extremely rough, with many vitreous bodies
and layer structures visible on the surface, with regular grooves.
The fractures are complex and diverse, interconnect with pores, and
contain many mineral particles. From C400 in panel (c), it can be
seen that the width and length of the fractures are significantly
enhanced compared to RC and C200 coal samples, and obvious pore-like
structures appear on the walls of wide fractures.
” shape, and the main
fracture length is close to 0.25 mm, with no obvious new fractures
near the fracture and a smooth edge. It can be inferred that this
fracture is the primary fracture of the coal sample. After baking
at 200 °C, as seen in panel (b), the surface of the coal sample
appears smoother. From the contrast between the shadow and light of
the image, it can be seen that the C200 coal sample in the center
of the image exhibited expansion and outward bulging. The fractures
are mostly present in the darker bulged shadow areas, with uneven
width and length throughout the entire image. The fracture surface
is rough, with many tiny fractures budding near the main fracture
and connected to it, forming a “T” shape. The width
of the parallel fractures is smaller than that of the perpendicular
fractures, and according to panel (b) C200, the perpendicular fracture
is the primary fracture, while the parallel fracture is a tiny fracture
associated with the main fracture. With increasing temperature, thermal
stress widens these fractures, and all of the fracture surfaces are
rough, with a stepped layer structure. When the temperature continued
to increase to 400 °C, as shown in panel (c), the surface of
the C400 coal sample became extremely rough, with many vitreous bodies
and layer structures visible on the surface, with regular grooves.
The fractures are complex and diverse, interconnect with pores, and
contain many mineral particles. From C400 in panel (c), it can be
seen that the width and length of the fractures are significantly
enhanced compared to RC and C200 coal samples, and obvious pore-like
structures appear on the walls of wide fractures.
Figure 10.

SEM images of coal sample fractures at different temperatures (the magnifications from left to right were X300, X500, and X1000).
The results of SEM analysis show that the degree of complexity of the coal sample surface is reflected differently at different temperatures. Furthermore, a higher temperature results in better connectivity of the pores and fractures, which is consistent with a smaller fractal dimension in the MIP analysis.
4.2.2. Fractal Dimension and Analysis of SEM
To quantitatively characterize the surface roughness of coal samples, SEM images at magnifications of 300, 500, and 1000 times are used to calculate the fractal dimension. The fractures and pores on the SEM image surface are used as calculation values, and the original scanned image is subjected to binary processing. The processed binary image is shown in Figure 11.
Figure 11.

Denoised binary image ((a, b, c) represent magnifications of X300, X500, and X1000, respectively).
The fractures and pores appear as white areas, while the black areas represent the coal matrix. The number of boxes (N) and box side length (r) are obtained by calculating the pixel values of the SEM images with a value of 1, using eq 7, which is then used to generate a linear fitting curve of log(N) against log(r) using the least-squares method. Figure 12 shows the linear fitting curve for the SEM fractal dimension.
Figure 12.

Linear fitting results of the box dimension ((a, b, c) represent magnifications of X300, X500, and X1000, respectively).
From Figure 12, we can observe that the SEM two-dimensional fractal dimension is distributed between 1.2 and 1.9, which is consistent with the defined value range of the two-dimensional fractal dimension [2,3]. The fractal dimension results are summarized in Table 6.
Table 6. Fractal Dimension Results of SEM.
| magnification | RC | C200 | C400 |
|---|---|---|---|
| X300 | 1.536 | 1.499 | 1.806 |
| X500 | 1.512 | 1.466 | 1.885 |
| X1000 | 1.606 | 1.226 | 1.887 |
From Table 6 and Figure 12, it can be observed that at the same magnification, the lowest fractal dimension is obtained for C200, while the highest fractal dimension of 1.8 or above is achieved for C400. This is consistent with the complexity of the surface morphology observed in the SEM images.
The fractal dimensions show different variations under different magnifications for the same coal sample. For the RC coal sample, the fractal dimension decreases first and then increases, which may be attributed to the influence of the microscopic particles attached to the surface of the RC during image processing. The fractal dimension of C200 decreases overall, which may be due to the chemical reaction of the high-temperature-treated surface substances that result in the attachment on the surface being cleaned, leading to a relatively accurate calculation of the fractal dimension. Compared with C200, there are many vitrinite and lamellar structures on the surface of C400, and the fractures and pores are complex and diverse, and connect with each other, with a large number of minerals in the fractures and pores. This makes the fractal dimension of C400 the largest among all coal samples at the same magnification and gradually increased under different magnifications, indicating that the surface of C400 is more complex. A larger fractal dimension indicates a more complex surface of the coal sample. Calculating the fractal dimension of SEM images can effectively characterize the complexity of the coal surface. However, the two-dimensional fractal dimension can only calculate the surface complexity and cannot quantitatively characterize the connectivity and regularity of the surface.
4.3. Correlation Analysis between the Three-Dimensional Fractal Dimension from MIP and the Two-Dimensional Fractal Dimension from SEM
The MIP can only measure the pores that connect to the channels corresponding to the maximum mercury injection pressure. The pore structure is complex, and MIP cannot accurately show the connectivity between pores and fractures. On the other hand, SEM can only observe surface fractures and pores without accurately quantifying internal structural changes. Therefore, a comprehensive analysis of MIP and SEM results is required to characterize the changes in coal fractures and pores.
As the coal samples tested by MIP and SEM are taken from the same coal sample, the two observation results are consistent. The fractal dimension relationship obtained based on two test results is shown in Figure 13 and Table 7.
Figure 13.

Fractal dimensions of SEM, MIP, and their difference.
Table 7. Fractal Dimensions of SEM, MIP, and Their Difference.
| RC | C200 | C400 | |
|---|---|---|---|
| MIP (mean) | 3.2030 | 3.1026 | 3.0037 |
| SEM (X1000) | 1.6060 | 1.2270 | 1.8870 |
| difference | 1.5970 | 1.8756 | 1.1167 |
The three-dimensional fractal dimension obtained from MIP falls in the range of [2.89, 3.3], with a fractal dimension close to but greater than 3. The two-dimensional surface fractal dimension of the coal sample measured by SEM falls in the range of [1.4, 1.9]. There is a certain correlation between their respective fractal dimensions. The fractal dimension obtained from MIP is used to characterize the connectivity between internal pore fractures, where a higher fractal dimension indicates poorer connectivity, reflecting the greater complexity of microstructures inside the coal. The larger the surface fractal dimension obtained from SEM, the more pixels occupied by the fractures and pores on the SEM image, but it cannot reflect the connectivity between surface pore fractures. This article analyzes the correlation between the two using the difference in fractal dimensions.
In mathematical terms, a smaller difference in fractal dimension indicates a more homogeneous internal structure of coal samples and smoother connection between different types of pore fractures. The largest difference in fractal dimension for C200 suggests incomplete connection between different types of pore fractures in its internal structure, which may cause incomplete penetrability for pores of different sizes and make the internal structure more heterogeneous compared to the RC sample. On the other hand, although the pore and fracture surfaces of C400 are quite complex, it exhibits a regular step-like laminated structure, resulting in some regularity in the development of pore and fracture in C400 coal samples, and therefore has the smallest difference in fractal dimension. The significance of fractal dimension lies in characterizing the self-similarity of objects, and a better difference in fractal dimension indicates that the microstructure of coal samples under different temperature treatments presents different degrees of self-similarity. RC is in the middle of self-similarity, but after being subjected to high-temperature treatment at 200 degrees, the surface of the coal sample becomes relatively smooth but shows disordered expansion with the internal structure, resulting in the maximum fractal dimension difference. When the temperature reaches 400 degrees, both the surface and internal structure of the coal sample exhibit regular changes. The distribution of internal pore fractures is relatively uniform and connected smoothly. Moreover, the surface also exhibits a regular step-like groove, indicating strong self-similarity of C400 coal samples.
5. Conclusions
Based on the impact of the underground coal fires on the development of coal pores/fractures, the study primarily focuses on the microstructural changes of coal samples under high-temperature treatment. By utilizing MIP and SEM, the data of the coal microscopic changes is obtained, and the fractal dimension is calculated accordingly. The relationship between the microstructure of coal samples and the fractal dimension is thoroughly analyzed, leading to the following conclusions.
-
(1)
The total pores and fractures volume of C200 is the smallest, and C400 is slightly larger than RC. The pores and fractures volumes of high-temperature-treated coal samples appeared to increase first and then decrease. The main volume changes after high-temperature treatment are reflected in the mesopores and macropores. The average fractal dimensions of MIP for RC, C200, and C400 are 3.2030, 3.1026, and 3.0037, respectively, which indicates better connectivity among coal pores and fractures at higher temperatures. This is contrary to the microstructural volume results obtained from MIP for C200 and C400.
-
(2)
The SEM results indicate that the surface of C200 is relatively smooth, whereas the surface of C400 is the roughest but shows a regular lamellar structure. Using the image analysis method, the fractal dimension is calculated at different magnifications for each coal sample. Table 5 shows that the higher the fractal dimension, the more complex the surface is.
-
(3)
A correlation analysis is conducted between MIP and SEM by studying the fractal dimension difference. There is the highest fractal dimension difference for C200, as the lowest one for C400. C200 has the largest fractal dimension difference, which indicates a relatively disordered development compared to RC, and the smallest self-similarity. C400 has the smallest fractal dimension difference, indicating a certain regularity and order in the development of its microstructure, showing the highest self-similarity. RC reflects a certain self-similarity in the coal’s inherent structure, but it can easily change under the influence of external environmental factors.
Acknowledgments
The authors acknowledge the financial support of the research funding provided by the National Natural Science Foundation of China (Nos. 52074108 and 52274189), the Henan Science and Technology Research Project (No. 212102310007), the Science and Technology Innovation Talent Support Program of Henan University (No. 22HASTIT012), the Key Scientific Research Projects of Henan Colleges and Universities (No. 22A620001), and the World first-class universities and world first-class disciplines founding project of Henan Polytechnic University (Nos. AQ20230206 and AQ20230762). The authors also appreciate all of the reviewers and editors for their professional and constructive comments.
Author Contributions
∥ Y.-l.X. and X.-w.H. contributed equally to this paper.
The authors declare no competing financial interest.
References
- Clarkson C. R.; Bustin R. M. The effect of pore structure and gas pressure upon the transport properties of coal: a laboratory and modeling study. 1. Isotherms and pore volume distributions. Fuel 1999, 78, 1333–1344. 10.1016/S0016-2361(99)00055-1. [DOI] [Google Scholar]
- Harmer J.; Callcott T.; Maeder M.; Smith B. E. A novel approach for coal characterization by NMR spectroscopy: global analysis of proton T 1 and T 2 relaxations. Fuel 2001, 80, 417–425. 10.1016/S0016-2361(00)00103-4. [DOI] [Google Scholar]
- Nie B. S.; Liu X. F.; Yang L. L.; Meng J. Q.; Li X. Pore structure characterization of different rank coals using gas adsorption and scanning electron microscopy. Fuel 2015, 158, 908–917. 10.1016/j.fuel.2015.06.050. [DOI] [Google Scholar]
- Okolo G. N.; Everson R. C.; Neomagus H. W. J. P.; Roberts M. J.; Sakurovs R. Comparing the porosity and surface areas of coal as measured by gas adsorption, mercury intrusion and SAXS techniques. Fuel 2015, 141, 293–304. 10.1016/j.fuel.2014.10.046. [DOI] [Google Scholar]
- Chu Y. P.; Sun H. T.; Zhang D. M.; Yu G. Nuclear magnetic resonance study of the influence of the liquid nitrogen freeze-thaw process on the pore structure of anthracite coal. Energy Sci. Eng. 2020, 8, 1681–1692. 10.1002/ese3.624. [DOI] [Google Scholar]
- Liu S.; Li X. L. Experimental study on the effect of cold soaking with liquid nitrogen on the coal chemical and microstructural characteristics. Environ. Sci. Pollut. Res. Int. 2023, 30, 36080–36097. 10.1007/s11356-022-24821-9. [DOI] [PubMed] [Google Scholar]
- Mandelbrot B. B. How Long Is the Coast of Britain? Statistical Self-Similarity and Fractional Dimension. Science 1967, 156, 636–638. 10.1126/science.156.3775.636. [DOI] [PubMed] [Google Scholar]
- Mandelbrot B. B.; Wheeler J. A. The Fractal Geometry of Nature. Am. J. Phys. 1983, 51, 286–287. 10.1119/1.13295. [DOI] [Google Scholar]
- Chakerian D.; Mandelbrot B. B. The Fractal Geometry of Nature. Coll. Math. J. 1984, 15, 175. 10.2307/2686529. [DOI] [Google Scholar]
- Watanabe K.; Takahashi H. Parametric study of the energy extraction from hot dry rock based on fractal fracture network model. Geothermics 1995, 24, 223–236. 10.1016/0375-6505(94)00049-I. [DOI] [Google Scholar]
- Yu B.; LI J. Some Fractal Characters of Porous Media. Fractals 2001, 09, 365–372. 10.1142/S0218348X01000804. [DOI] [Google Scholar]
- Sun W. J.; Feng Y. Y.; Jiang C. F.; Chu W. Fractal characterization and methane adsorption features of coal particles taken from shallow and deep coalmine layers. Fuel 2015, 155, 7–13. 10.1016/j.fuel.2015.03.083. [DOI] [Google Scholar]
- Li A.; Ding W. L.; He J. H.; Dai P.; Yin S.; Xie F. Investigation of pore structure and fractal characteristics of organic-rich shale reservoirs: A case study of Lower Cambrian Qiongzhusi formation in Malong block of eastern Yunnan Province, South China. Mar. Pet. Geol. 2016, 70, 46–57. 10.1016/j.marpetgeo.2015.11.004. [DOI] [Google Scholar]
- Li Z. T.; Liu D. M.; Cai Y. D.; Wang Y. P.; Si G. Y. Evaluation of coal petrophysics incorporating fractal characteristics by mercury intrusion porosimetry and low-field NMR. Fuel 2020, 263, 116802 10.1016/j.fuel.2019.116802. [DOI] [Google Scholar]
- Mangi H. N.; Detian Y.; Hameed N.; Ashraf U.; Rajper R. H. Pore structure characteristics and fractal dimension analysis of low rank coal in the Lower Indus Basin, SE Pakistan. J. Nat. Gas Sci. Eng. 2020, 77, 103231 10.1016/j.jngse.2020.103231. [DOI] [Google Scholar]
- Fu Hj.; Tang D. Z.; Xu T.; Xu H.; Tao S.; Li S.; Yin Z. Y.; Chen B. L.; Zhang C.; Wang L. L. Characteristics of pore structure and fractal dimension of low-rank coal: A case study of Lower Jurassic Xishanyao coal in the southern Junggar Basin, NW China. Fuel 2017, 193, 254–264. 10.1016/j.fuel.2016.11.069. [DOI] [Google Scholar]
- Yao Y. B.; Liu D. M.; Tang D. Z.; Tang S. H.; Huang W. H.; Liu Z. H.; Che Y. Fractal characterization of seepage-pores of coals from China: An investigation on permeability of coals. Comput. Geosci. 2009, 35, 1159–1166. 10.1016/j.cageo.2008.09.005. [DOI] [Google Scholar]
- Li Z. T.; Liu D. M.; Cai Y. D.; Yao Y. B.; Wang H. Pore Structure and Compressibility of Coal Matrix with Elevated Temperatures by Mercury Intrusion Porosimetry. Energy Explor. Exploit. 2015, 33, 809–826. 10.1260/0144-5987.33.6.809. [DOI] [Google Scholar]
- Alekseev A. D.; Vasilenko T. A.; Kirillov A. K. Fractal analysis of the hierarchic structure of fossil coal surface. J. Min. Sci. 2008, 44, 235–244. 10.1007/s10913-008-0013-2. [DOI] [Google Scholar]
- He Y.; Liu Z.; Wang S. Y.; Zhu M. Y.; Cheng W. M.; Yu Z. H. Study on Fractal Characteristis of Fracture Space Structure and Tight Solid Structure of Coal. Fractals 2023, 31, 2350015 10.1142/S0218348X23500159. [DOI] [Google Scholar]
- Liu Z.; He Y.; Wang W. Y.; Cheng W. M.; Xin L. Experimental Study on the Pore Structure Fractals and Seepage Characteristics of a Coal Sample Around a Borehole in Coal Seam Water Infusion. Transp. Porous Media 2018, 125, 289–309. 10.1007/s11242-018-1119-x. [DOI] [Google Scholar]
- Naveen P.; Asif M.; Ojha K. Integrated fractal description of nanopore structure and its effect on CH 4 adsorption on Jharia coals, India. Fuel 2018, 232, 190–204. 10.1016/j.fuel.2018.05.124. [DOI] [Google Scholar]
- JIN Y.; Wang C.; Liu S. X.; Quan W. Z.; Liu X. K. Systematic Definition of Complexity Assembly in Fractal Porous Media. Fractals 2020, 28, 2050079 10.1142/S0218348X20500796. [DOI] [Google Scholar]
- Liu G. N.; Yu B. M.; Ye D. Y.; Gao F.; Liu J. S. Study on Evolution of Fractal Dimension for Fractured Coal Seam Under Multi-Field Coupling. Fractals 2020, 28, 20050072 10.1142/S0218348X20500723. [DOI] [Google Scholar]
- Pan J. N.; Wang K.; Hou Q. L.; Niu Q. H.; Wang H. C.; Ji Z. M. Micro-pores and fractures of coals analysed by field emission scanning electron microscopy and fractal theory. Fuel 2016, 164, 277–285. 10.1016/j.fuel.2015.10.011. [DOI] [Google Scholar]
- Cardott B. J.; Curtis M. E. Identification and nanoporosity of macerals in coal by scanning electron microscopy. Int. J. Coal Geol. 2018, 190, 205–217. 10.1016/j.coal.2017.07.003. [DOI] [Google Scholar]
- Roslin A.; Pokrajac D.; Zhou Y. F. Cleat structure analysis and permeability simulation of coal samples based on micro-computed tomography (micro-CT) and scan electron microscopy (SEM) technology. Fuel 2019, 254, 115579 10.1016/j.fuel.2019.05.162. [DOI] [Google Scholar]
- Tripathy A.; Kumar A.; Srinivasan V.; Singh K. H.; Singh T. N. Fractal analysis and spatial disposition of porosity in major indian gas shales using low-pressure nitrogen adsorption and advanced image segmentation. J. Nat. Gas Sci. Eng. 2019, 72, 103009 10.1016/j.jngse.2019.103009. [DOI] [Google Scholar]
- Wang G.; Qin X. J.; Shen J. N.; Zhang Z. Y.; Han D. Y.; Jiang C. H. Quantitative analysis of microscopic structure and gas seepage characteristics of low-rank coal based on CT three-dimensional reconstruction of CT images and fractal theory. Fuel 2019, 256, 115900 10.1016/j.fuel.2019.115900. [DOI] [Google Scholar]
- Liu Z.; Zhu D. L.; Hang H.; Wang W. D.; Yang W. Z. Experimental research on different metamorphic grades of coal bodies with macro–mesoscopic structure fractal characteristics. Geomech. Energy Environ. 2022, 32, 100337 10.1016/j.gete.2022.100337. [DOI] [Google Scholar]
- Liu S. M.; Sun H. T.; Zhang D. M.; Yang K.; Li X. L.; Wang D. K.; Li Y. N. Experimental study of effect of liquid nitrogen cold soaking on coal pore structure and fractal characteristics. Energy 2023, 275, 127470 10.1016/j.energy.2023.127470. [DOI] [Google Scholar]
- Xiao Y.; Lu J. H.; Wang C. P.; Deng J. Experimental Study of High-Temperature Fracture Propagation in Anthracite and Destruction of Mudstone from Coalfield Using High-Resolution Microfocus X-ray Computed Tomography. Rock Mech. Rock Eng. 2016, 49, 3723–3734. 10.1007/s00603-016-1006-0. [DOI] [Google Scholar]
- Sun L. T.Study on the Mechanism of Thermal Damage and Numerical Simulation for Evolution of Coalfield Fire Area; China University of Mining and Technology, 2018. [Google Scholar]
- Su C. D.; Qiu J. D.; Wu Q. H.; Weng L. Effects of high temperature on the microstructure and mechanical behavior of hard coal. Int. J. Min. Sci. Technol. 2020, 30, 643–650. 10.1016/j.ijmst.2020.05.021. [DOI] [Google Scholar]
- Tang Z. Q.Pore Evolution during Coal Spontaneous Combustion: Mechanism and Its Effect on Multi-gas Adsorption Characteristics; China University of Mining and Technology, 2020. [Google Scholar]
- Zhang J. C.; Li X. L.; Qin Q. Z.; Wang Y. B.; Gao X. Study on overlying strata movement patterns and mechanisms in super-large mining height stopes. Bull. Eng. Geol. Environ. 2023, 82, 107320 10.1007/s10064-023-03185-5. [DOI] [Google Scholar]
- Li X. L.; Zhang X. Y.; Shen W. L.; Zeng Q. D.; Chen P.; Qin Q. Z.; Li Z. Research on the Mechanism and Control Technology of Coal Wall Sloughing in the Ultra-Large Mining Height Working Face. Int. J. Environ. Res. Public Health 2023, 20, 868 10.3390/ijerph20010868. [DOI] [PMC free article] [PubMed] [Google Scholar]
- Zhang L. B.; Shen W. L.; Li X. L.; Wang Y. B.; Qin Q. Z.; Lu X. T.; Xue T. X. Abutment Pressure Distribution Law and Support Analysis of Super Large Mining Height Face. Int. J. Environ. Res. Public Health 2023, 20, 227 10.3390/ijerph20010227. [DOI] [PMC free article] [PubMed] [Google Scholar]
- Washburn E. W. The Dynamics of Capillary Flow. Phys. Rev. 1921, 17, 273. 10.1103/PhysRev.17.273. [DOI] [Google Scholar]
- Friesen W. I.; Mikula R. J. Fractal dimensions of coal particles. J. Colloid Interface Sci. 1987, 120, 263–271. 10.1016/0021-9797(87)90348-1. [DOI] [Google Scholar]
- Bouligand G. Sur les trajectoires orthogonales d’une famille de droites. Bulletin de la Société Mathématique de France 1929, 57, 204–209. 10.24033/bsmf.1152. [DOI] [Google Scholar]
- Falconer K. Review:Fractal Geometry: Mathematical Foundations and Applications. Biometrics 1990, 46, 886–887. 10.2307/2532125. [DOI] [Google Scholar]
- Cheng Y. P.; Hu B. A new pore classification method based on the methane occurrence and migration characteristic in coal. J. China Coal Soc. 2023, 48, 212–225. [Google Scholar]
- Su X. Y.; Feng Z. C.; Cai T. T.; Shen Y. X. Coal Permeability Variation during the Heating Process considering Thermal Expansion and Desorption Shrinkage. Adsorpt. Sci. Technol. 2022, 2022, 7848388 10.1155/2022/7848388. [DOI] [Google Scholar]
- Wang H. Y.; Li J. L.; Dong Z. H. Z.; Fan C.; Zhang Y. W.; Chen X. Effect of thermal damage on the pore–fracture system during coal spontaneous combustion. Fuel 2023, 339, 127439 10.1016/J.FUEL.2023.127439. [DOI] [Google Scholar]