

Abstract
Background:
Intracortical microstimulation (ICMS) of the somatosensory cortex can restore sensation to people with neurological diseases. However, many aspects of ICMS are poorly understood, including the effect of stimulation on percept intensity over time.
Objective:
Here, we evaluate how tactile percepts, evoked by ICMS in the somatosensory cortex of a human participant adapt over time.
Methods:
We delivered continuous and intermittent ICMS to the somatosensory cortex and assessed the reported intensity of tactile percepts over time in a human participant. Experiments were conducted over approximately one year and linear mixed effects models were used to assess significance.
Results:
Continuous stimulation at high frequencies led to rapid decreases in intensity, while low frequency stimulation maintained percept intensity for longer periods. Burst-modulated stimulation extended the time before the intensity began to decrease, but all protocols ultimately resulted in complete sensation loss within one minute. Intermittent stimulation paradigms with several seconds between stimulus trains evoked intermittent percepts and also led to decreases in intensity on many electrodes, but never resulted in extinction of the sensation after over three minutes of stimulation. Longer breaks between each pulse train resulted in some recovery in the intensity of the stimulus-evoked percepts. For several electrodes, intermittent stimulation had almost no effect on the perceived intensity.
Conclusions:
Intermittent ICMS paradigms were more effective at maintaining percepts. Given that transient neural activity dominates the response in somatosensory cortex during mechanical contact onsets and offsets, providing brief stimulation trains at these times may more closely represent natural cortical activity and have the additional benefit of prolonging the ability to evoke sensations over longer time periods.
Keywords: Intracortical microstimulation, sensory restoration, somatosensory cortex, adaptation, brain-computer interfaces, microelectrode arrays
INTRODUCTION
Intracortical microstimulation (ICMS) of the somatosensory cortex can elicit tactile percepts, even many years after spinal cord injury [1–3]. This can be useful for restoring sensation to people with neurological disease, particularly in the context of a bidirectional brain-computer interface (BCI) [4,5]. The sensations evoked by ICMS can improve robotic arm control by decreasing the time it takes for a person to successfully grasp objects [6] and tend to range in quality from less natural (tingle, warm, buzzing) to more natural (pressure, touch, tapping) on an electrode and parameter specific basis [1,7]. Additionally, ICMS can evoke detectable percepts over many years and stimulation itself does not appear to cause damage that affects neural recordings or increase ICMS detection thresholds [8]. While these factors address the long-term stability and functionality of ICMS, other phenomena may be relevant over short time scales.
One potential issue for sensory feedback via ICMS is percept adaptation. We use the term intensity adaptation to mean a reduction in percept intensity that occurs over time, and detection adaptation to mean a reduction in the ability to detect stimulation over time. Both intensity and detection adaptation have been documented for ICMS in the visual cortex [9], intra and extraneural stimulation of peripheral nerves [10–12], as well as cutaneous stimulation for sensory substitution [13–15]. Additionally, detection adaptation has been observed for vibrotactile stimulation [16–20]; higher frequencies resulted in larger and faster changes in detection thresholds as well as decreases in the ability to discriminate stimuli. In the peripheral nerve, continuous stimulation increased the amount of charge required to evoke detectable sensations over time and decreased the perceived intensity [10–12] and this effect occurred more rapidly at higher stimulation frequencies [11]. However, intermittent stimulation paradigms reduced the effects of intensity adaptation for cutaneous stimulation [14], and in the visual cortex, longer breaks between successive stimulation trains improved the recovery rate of the intensity of ICMS-evoked percepts [9].
For clinical applications, ICMS will need to provide reliable and continuous sensory feedback in order to be useful for users. Intensity and detection adaptation therefore present a barrier to clinically useful sensory feedback. Here, we studied ICMS-evoked intensity and detection adaptation in the somatosensory cortex to understand the effects of stimulation parameter choices on perceived intensity with the goal of designing better encoding algorithms for bidirectional BCIs.
MATERIALS AND METHODS
Regulatory and participant information
This study was conducted under an Investigational Device Exemption from the U.S. Food and Drug Administration, approved by the Institutional Review Boards at the University of Pittsburgh (Pittsburgh, PA) and the Space and Naval Warfare Systems Center Pacific (San Diego, CA), and registered at ClinicalTrials.gov (NCT0189-4802). Informed consent was obtained before any study procedures were conducted.
A single 28-year-old male subject with a C5 motor/C6 sensory ASIA B spinal cord injury was implanted with two microelectrode arrays (Blackrock Microsystems, Salt Lake City, UT) in the somatosensory cortex. Data from this participant have been reported previously, including implantation details and initial perceptual effects of ICMS [1], the long-term stability of these devices [8]. the effect of ICMS parameters on perception [7,21], and how including ICMS can improve robotic arm control [6]. Each electrode array consisted of 32 wired electrodes arranged on a 6 x 10 grid with a 400 μm interelectrode spacing, resulting in a device with an overall footprint of 2.4 x 4 mm. The remaining 28 electrodes in the grid were not wired due to technical constraints related to the total number of electrical contacts on the percutaneous connector. Electrode tips were coated with a sputtered iridium oxide film (SIROF). Additional details on these implants have been published elsewhere [1].
Stimulation protocol
Stimulation was delivered using a CereStim C96 multichannel microstimulation system (Blackrock Microsystems, Salt Lake City, UT). Pulse trains consisted of cathodal phase first, current-controlled, charge-balanced pulses which were delivered at frequencies from 20-300 Hz and at amplitudes from 2-100 μA. The cathodal phase was 200 μs long, the anodal phase was 400 μs long, and the anodal phase was set to half the amplitude of the cathodal phase. The phases were separated by a 100 μs interphase period. The maximum stimulus train duration for continuous stimulation was 15 s at 100 Hz or 5 s at 300 Hz. Previous studies have demonstrated that even small amounts of charge injection can be deleterious when delivered continuously for long periods of time [22]. Therefore, we limited stimulus train length to a duration that was previously demonstrated to be safe in non-human primates with similar implants [23]. Amplitude and frequency limits (100 μA and 300 Hz) were similarly selected based on this previous study in non-human primates. Following any stimulation lasting 15 s, an equal amount of time was spent without stimulation (50 % duty cycle, 15 s on followed by 15 s off). We have previously established that these stimulation parameters can result in safe and effective stimulation for over 1500 days in a human participant [8]. Initial experiments used 300 Hz as the maximum frequency while later experiments used 250 Hz as the maximum frequency. Above 280 Hz, the stimulator occasionally dropped individual pulses resulting in variable stimulation frequencies. This difference is minimal and we do not expect any impact on the presented results or conclusions.
Electrode selection
These experiments were conducted across several years in a single participant. Electrodes were selected for each series of experiments that were clearly perceptible to the participant on the first presentation and that also spanned both arrays. While there were some common electrodes between the different experiments, there was also some variability. Electrodes used in each experiment are listed in supplementary table 1. While perceptual qualities were not measured for the specific stimulation parameters used in these experiments, we did document the cutaneous percepts evoked in this time period using a fixed set of stimulation parameters as a part of the ongoing study and found that they were similar to those reported previously [1,7]. Further, we did not note any irregular qualities using the stimulation trains presented here, nor did the participant volunteer any information about experiencing different percepts.
Stimulation adaptation protocols
In the first experiment, the participant used an analog slider to indicate changes in intensity over time while they received continuous stimulation. Even though the participant had no hand function due to the spinal cord injury, he had intact shoulder movement as well as elbow flexion. The participant was able to place their hand around the lever and control the slider movement with this remaining ability. Analog slider values were scaled from 0-1, representing the minimum and maximum positions of the slider. We considered the intensity to have changed from baseline when the participant moved the slider below 0.95 and the sensation to be completely extinguished when the slider value was less than 0.05. We used these values to account for noise in the analog slider signal. Recordings were taken up to 15 s after stimulation ceased to measure changes in intensity following cessation of stimulation.
We first tested continuous stimulation and delivered pulse trains at 20, 100, and 300 Hz and 60 μA to single electrodes (Fig. 1A). We delivered 15 s of stimulation at 20 and 100 Hz and 5 s of stimulation at 300 Hz on 5 electrodes for one trial each.
Figure 1. Continuous stimulation at higher frequencies resulted in faster adaptation.
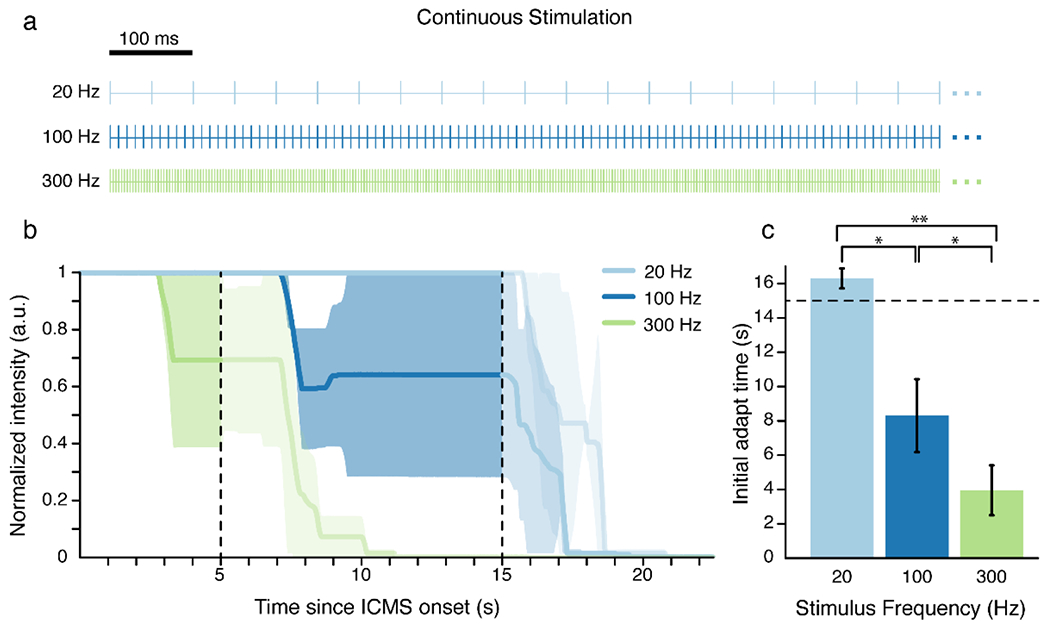
A) Continuous frequency trains. Each line represents an individual pulse. B) The participant reported the perceived intensity of the ICMS-evoked sensations using an analog slider. The slider always started at a value of 1 and the participant moved the slider to indicate changes in perceived intensity. Each colored line represents the median intensity for 5 electrodes at a given frequency. The shaded regions represent the median absolute deviation. The vertical dotted lines indicate the end of stimulation for the 300 Hz train at 5 s and the end of stimulation for the 20 and 100 Hz trains at 15 s. Slider values after stimulation stopped are shown in a lighter shade to emphasize the effects during stimulation. C) Time at which the perceived intensity began to decrease for the mean response at each stimulus frequency. Error bars show the standard error and the dotted line indicates the maximum stimulation time of 15 s. * indicates p < 0.05 and ** indicates p < 0.001.
For burst-modulated stimulation, we delivered pulse trains at 100 Hz and 60 μA to single electrodes. To maintain stimulation over longer periods of time, we used a burst modulation scheme with three different burst modulation paradigms: 100 ms, 200 ms, and 500 ms (Fig. 2A). Each of these burst modulation protocols consisted of a burst of stimulation followed by a period of no stimulation of equal length. We delivered 60 s of stimulation for each of these burst parameters on 10 different electrodes for one trial each.
Figure 2. Burst-modulated stimulation extinguished all percepts within 60 s.
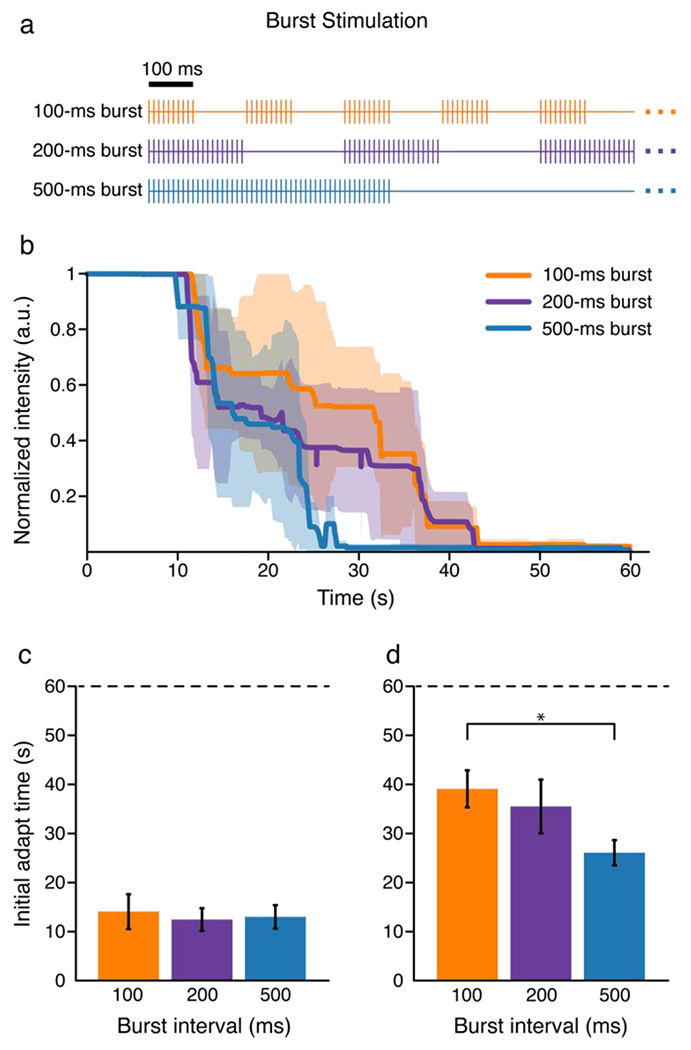
A) Burst modulated trains. Each line represents an individual pulse. B) The participant indicated the perceived intensity of ICMS with an analog slider. The slider always started at a value of 1 and the participant moved the slider to indicate changes in perceived intensity. Each line represents the median intensity value across 10 tested electrodes for a given burst duration. The shaded regions represent the median absolute deviation. C-D) Bar plots showing C) the mean time at which the percept intensity began to decrease and D) the mean time at which the percept became undetectable. Error bars show the standard error. The dotted line indicates the maximum stimulation time of 60 s. * indicates p < 0.05.
For intermittent stimulation trials, there was an initial adaptation period followed by a recovery period. In the adaptation period, the participant received 1 s of stimulation at 60 μA followed by 5 s of no stimulation for 50 repetitions to measure changes in intensity over time (Fig. 3A). After each 1 s pulse train, the participant verbally reported the perceived intensity on a self-selected scale, similar to previous studies evaluating changes in intensity over time [9,10]. The participant had performed similar magnitude estimation tasks in previous studies, and used consistent ratings for the same parameters and electrodes across sessions [7]. We had the participant use a self-selected scale rather than normalizing to the first value because we were interested in whether the magnitude of the initial perceived intensity on different electrodes related to the change in intensity over time. After the adaptation period, the participant received 1 s of stimulation followed by 61 s without stimulation for another 5 repetitions. We used this period to assess any recovery in the perceived intensity over time.
Figure 3. Intermittent stimulation caused less adaptation, which partially recovered over time.
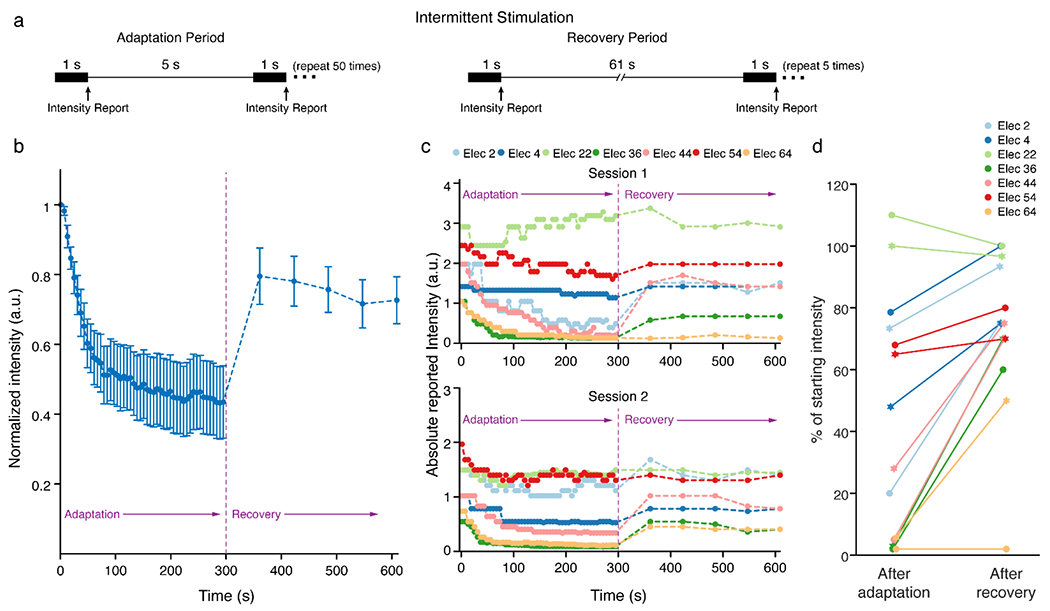
A) Intermittent adaptation and recovery paradigms. The participant reported the perceived intensity on a self-selected scale immediately after each 1-s stimulus train. Each stimulus train was perceived as a distinct event. B) Mean normalized intensity reports over time. The perceived intensity values for each electrode were normalized to the value reported after the first train so that the data could be combined across all electrodes. Blue dots represent the median intensity value measured at each time point across all electrodes. Error bars show the standard error. (C) The raw (not normalized) intensity values reported for each electrode in two sessions during the adaptation and recovery periods. The participant used a self-selected scale so the reported values were not constrained to fall within a particular range. Data were not normalized so that differences in the initial intensity of different electrodes are highlighted. (D) The percent change in intensity for each electrode after the adaptation and recovery periods. The change in intensity is calculated from each electrode’s initial intensity. Circular markers indicate the first session while star markers indicate the second session.
We performed two different experiments with intermittent stimulation. In the first experiment we tested seven electrodes at 100 Hz to measure differences in adaptation over time between electrodes. These tests were repeated twice. In a second experiment we wanted to examine any impact of stimulus frequency on intensity adaptation during intermittent stimulation. Four electrodes were also tested four times at 20, 100, and 250 Hz.
For continuous and burst-modulated stimulation, the participant perceived the stimulus trains as being continuous over time. However, because of the large breaks between pulse trains in the intermittent stimulation protocol, the participant perceived each pulse train as a separate event. Therefore, different protocols were used for each of these tasks (continuous evaluation of intensity with an analog slider or discrete evaluation of intensity for each event).
Detection threshold adaptation protocol
We measured detection thresholds using a two-alternative forced choice task. Two intervals were presented and the participant was asked to report which interval contained the stimulus. Amplitude was modulated using a one-up three-down staircase method [24,25]. The initial current amplitude was 10 μA and it was increased or decreased by a factor of 2 dB with a constant frequency of 100 Hz. After five changes in the direction of the current amplitude (increasing to decreasing, or decreasing to increasing), the trial was stopped. The detection thresholds were calculated by averaging the five stimulation amplitude values that were presented immediately before each of the five direction changes. Following the first detection task, the participant received stimulation using a 15 s on 15 s off protocol – the maximum time we can stimulate continuously – at 60 μA and 100 Hz for 240 s. The detection task was then repeated. We conducted this task on 12 different electrodes each with one trial.
Statistics
All statistical analyses were conducted in MATLAB (MathWorks, Natick, MA). We used linear mixed effects (LME) models to test for relationships amongst the variables of interest (fixed effects) while excluding the impact of variables that were not of interest (random effects). Throughout the text we present the p-values of the LME model along with the estimate of the slope (estimate), the standard error of the estimate (SE), the degrees of freedom of the model (DF), and the standard deviation of the random effects in the model (RESD).
For the continuous and burst stimulation paradigms, we defined the time at which the intensity fell below 0.95 to be the initial adaptation time. We compared this initial adaptation time across stimulation parameters for significant differences using LME models in which the parameter (frequencies or burst modulations) was a fixed effect and electrode number was a random effect.
To understand how intensity decreased as a function of frequency for the intermittent stimulation paradigm, we compared the intensity after the first stimulus train of the adaptation period to the intensity after the last stimulus train of the adaptation period. We repeated this analysis for the recovery period by comparing the intensity of the last repetition of the adaptation period to the last repetition of the recovery period. To test if there were significant differences in adaptation or recovery times across frequencies for the four tested electrodes, we used LME models, in which the stimulation frequency was a fixed effect and session number was a random effect. For Fig. 3B, we normalized the intensity to compare across electrodes by dividing the reported intensities by the first reported intensity value in the trial. For Fig. 3C, we plotted the raw reported intensity values.
To determine if the ability to detect stimulation changed after long periods of stimulation, we compared the detection thresholds measured before and after continuous stimulation with LME models, in which the condition (“before” or “after” stimulation) was treated as a fixed effect and the electrode was treated as a random effect.
Mean values are reported the with standard error (± SE) while median values are reported with median absolute deviation (± MAD). Reported p-values are for the coefficient of the fixed effect and were considered to be significant at α < 0.05. In the figures, we have specified significant differences with * for p < 0.05 and ** for p < 0.001.
The analog slider values are plotted as the median and the median absolute deviations because the time series data was found to be non-normal using the Anderson-Darling test. For all other illustrations, we plotted the mean and standard error of the mean.
RESULTS
Continuous stimulation at higher frequencies results in faster adaptation
We delivered continuous stimulation for 15 seconds at 20 and 100 Hz and for 5 seconds at 300 Hz on 5 electrodes (Fig. 1A). 300 Hz stimulation resulted in the fastest change from baseline, with the median intensity falling to 69±30% of the baseline intensity after 5 s of stimulation. The median intensity remained unchanged from baseline after 5 s of stimulation at both 20 Hz and 100 Hz. However, starting 7 s after stimulation onset, 100 Hz stimulation caused changes in percept intensity that fell to 64±36% after 15 s of stimulation. Stimulation at 20 Hz had no effect on intensity during the 15 s stimulation window. The time at which the intensity began to decrease was significantly different between different stimulus frequencies (p = 8.1e-5, estimate = −0.04, SE = 0.007, DF = 13, RESD = 1.5e-14, Fig. 1B,C, Supp. Fig. 1A–C). Additional post-hoc pairwise comparisons revealed that the initial drop time at all three stimulus frequencies were significantly different from each other (20 Hz vs 100 Hz: p = 0.001, estimate = −0.1, SE = 0.02, DF = 8, RESD = 0.04; 20 Hz vs 300 Hz: p = 2e-6, estimate = −0.04, SE = 0.0037, DF = 8, RESD = 0.0082; 100 vs 300 Hz: p = 0.0043, estimate = −0.02, SE = 0.0055, DF = 8, RESD = 9.68e-11). Ultimately, higher stimulation frequencies caused faster intensity adaptation (Fig. 1C).
One important point to note is that after stimulation stopped, the participant did not immediately move the slider to the bottom position. This is despite the fact that with most stimulus trains, they verbally report that sensations stop immediately when stimulation stops. Rather, they began to move the slider within two seconds (mean 20 Hz = 1.37±0.54 s, mean 100 Hz = 1.07±0.28 s, mean 300 Hz = 1.94±0.72 s) and took several more seconds to move the slider to the bottom position (mean 20 Hz = 6.9±2.6 s, mean 100 Hz = 2.45±0.64 s, mean 300 Hz = 5.79±1.5 s). Given these delays in motor responsiveness, these times may overestimate the actual time it takes for adaptation to start occurring.
Burst stimulation extinguishes sensation over short periods
To potentially extend the time ICMS could be provided, we tested burst-modulated ICMS using 100 Hz pulse trains for 60 seconds. Burst modulation stimulus trains with a 50% duty cycle and burst durations of 100 ms, 200 ms, and 500 ms were tested (Fig. 2A). All burst modulation schemes delivered the same number of pulses in 60 s. Stimulation for 60 s caused a complete extinction of the evoked sensation on 26 of the 30 trials (Fig. 2B, Supp. Fig. 1D–F) and there was no difference in the time at which the perceived intensity began to decrease between burst paradigms with a mean drop time of 13.2±1.6 s across paradigms (p = 0.76, estimate = −0.0017, SE = 0.0054, DF = 28, RESD = 3.27e-12, Fig. 2C). However, there was a difference in the time required for the sensations to become undetectable between the three burst stimulation paradigms, with the 500 ms paradigm causing the fastest extinction at 26.1±2.6 s, while the 100 ms paradigm caused extinction at 39.1±3.8 s and the 200 ms paradigm caused extinction at 35.5±5.5 s (p = 0.016, estimate = −0.065, SE = 0.025, DF = 28, RESD = 8.9e-11, Fig. 2D). We found with post-hoc pairwise comparisons that 100-ms and 500-ms were significantly different (p = 0.0014, estimate = −0.03, SE = 0.009, DF = 18, RESD = 2.3e-14) while no other comparisons were significantly different (100-ms vs 200-ms: p = 0.52, estimate = −3.6, SE = 5.5, DF = 18, RESD = 11.9; 200-ms vs 500-ms: p = 0.12, estimate = −9.4, SE = 5.7, DF = 18, RESD = 2.16e-8). Ultimately, decreasing the burst duration extended the useful perceptual window, but the intensity always decreased over time, and regardless of the burst duration, sensations were completely extinguished over relatively short periods of time (Fig. 2B,D, Supp. Fig. 1D–F).
Increasing time between stimulus trains preserves evoked percepts
Based on results of continuous and burst stimulation, we asked whether increasing the time between stimulation pulses or pulse trains could extend the ability to evoke perceptible sensations. Therefore, we tested an intermittent stimulation protocol with larger gaps between stimulation trains. In contrast to continuous and burst-modulated stimulation which were perceived as continuous sensations, the gap between pulse trains in the intermittent paradigm were large enough for each stimulus train to be perceived as separate events. This protocol was divided into an adaptation period and a recovery period. In both periods the stimulus trains were 1 s long, but the gap between trains was increased from 5 s in the adaptation period to 61 s in the recovery period (Fig. 3A) to allow us to measure whether percept intensity recovered. With this protocol, the mean percept intensity still decreased during the adaptation period, however the percepts were not completely extinguished and also increased in intensity during the recovery period (Fig. 3B,C). Considering all the electrodes together, the mean intensity decreased to 43.5±10% of the initial intensity during the adaptation period and recovered back to 72.6±7% of the initial intensity by the end of the recovery period (Fig. 3B). Additionally, while the percepts became very weak on some electrodes during the adaptation period, the participant still reported feeling them and no electrodes ever became imperceptible (Fig. 3C).
There was considerable variability between the electrodes in how much the percept intensity adapted and recovered (Fig. 3C). In both sessions, the sensations on two electrodes were nearly extinguished – the perceived intensity decreased to less than 6% of the initial intensity – during the adaptation period (Fig. 3C,D, Elec 36 and Elec 64) with varying amounts of recovery. On the other hand, the intensity on two electrodes decreased to 48-79% (Fig. 3C,D, Elec 4 and 54), while one electrode showed a slight increase in intensity (Fig. 3C,D, Elec 22).
Decreases in intensity of intermittent stimulation are consistent across frequencies
We repeated the intermittent stimulation paradigm on four electrodes at 20 Hz, 100 Hz, and 250 Hz (Fig. 4) to see if increasing the stimulation frequency caused more adaptation like in the continuous stimulation protocols. From prior work, we know that stimulation frequency can have variable effects on intensity [7], which we also observed here; stimulation on one electrode elicited the highest intensity at the lowest frequency (Fig. 4A, Elec 54) while stimulation on the other three electrodes elicited the highest intensity at the highest frequency (Fig. 4A, Elec 4, 22 and 36). In this latter group of electrodes, the effect of frequency on intensity changes during the adaptation period were minimal (Fig. 4B, Elec 4, 22 and 36). However, on electrode 54, stimulation at higher frequencies led to more adaptation (Fig. 4B), although the intensity decreases during the adaptation period and increases during the recovery period were not significantly different across frequencies for any electrode (p >= 0.05, Fig. 4B). Despite the different initial intensities at different frequencies, which can be seen especially clearly in electrodes 4 and 22 (Fig. 4A), the magnitude of the intensity changes during the adaptation and recovery periods were the same.
Figure 4. Stimulation frequency did not affect adaptation and recovery to intermittent stimulation on individual electrodes.
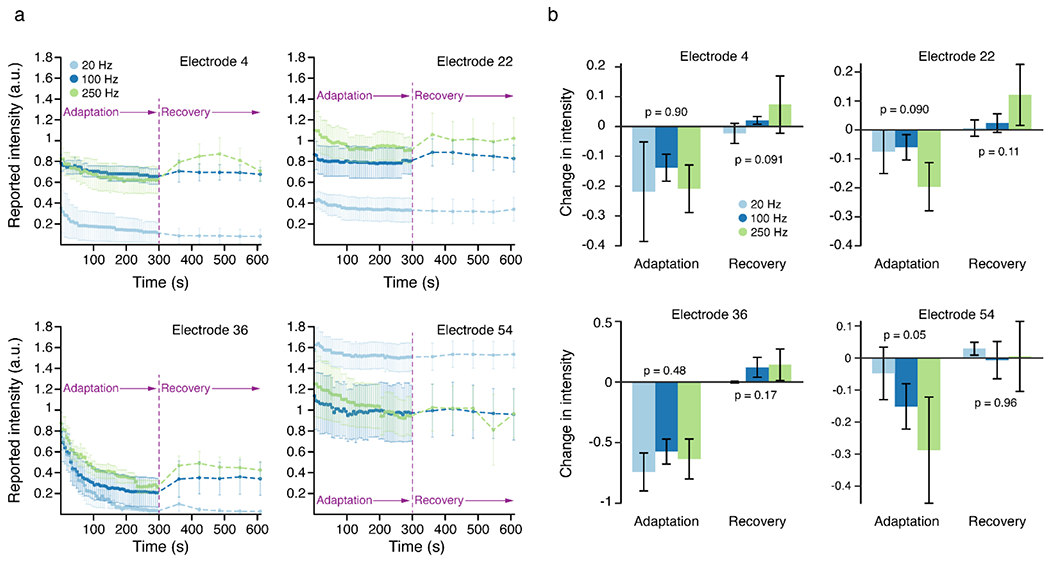
A) Using the intermittent stimulation protocol, four different electrodes were stimulated at 20, 100, and 250 Hz. Colored dots represent the mean intensity value measured at each time point across 4 test sessions. Error bars show the standard error. Different colors indicate the different stimulation frequencies. The dashed lines represent that each stimulus train was perceived as a discrete event. B) Intensity changes during adaptation and recovery at the three different frequencies. The raw change in intensity for the adaptation period was measured between the beginning and end of the adaptation period while the change for the recovery period was measured between the end of the adaptation period and end of the recovery period. Each bar shows the mean difference across four test sessions. Error bars show the standard error.
Detection thresholds increased slightly after continuous stimulation
We also measured the detection threshold before and after long periods of stimulation. We measured the detection threshold and then delivered 4 minutes of stimulation using 15 s of stimulation followed by a 15 s break, which was the maximal length of time we could continuously deliver stimulation. We then remeasured the detection thresholds. Using this protocol, we found a significant difference in the thresholds measured before and immediately after stimulation across 12 electrodes (p = 0.027, estimate = 2.43, SE = 1.03, DF = 22, RESD = 3.658, Fig. 5) with a mean threshold increase of 2.4±1.1 μA following continuous stimulation.
Figure 5. Long periods of stimulation resulted in a slight increase in detection thresholds.
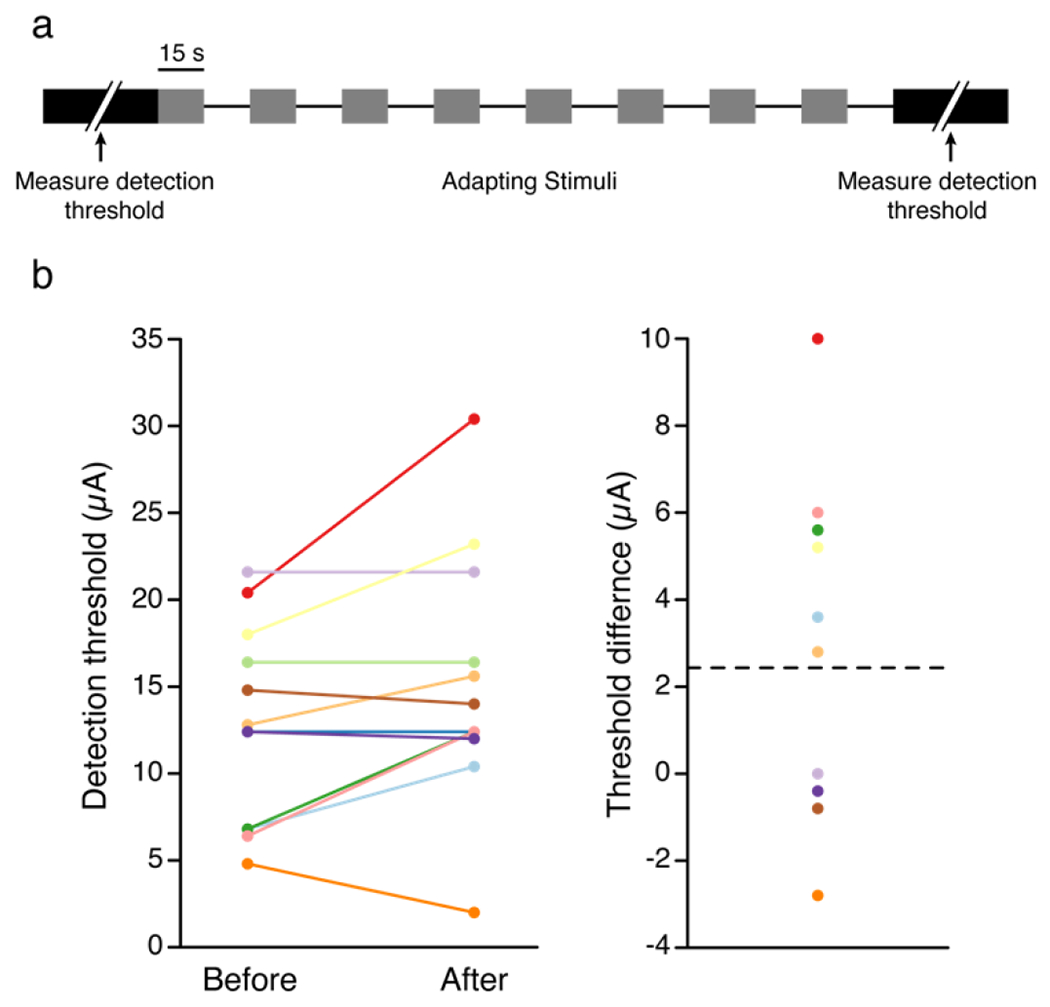
A) We measured the detection threshold and then applied stimulation for 15 s at 100 Hz followed by 15 s of no stimulation for four minutes and then measured the detection threshold. B) Detection thresholds before and after adaptation protocol. Each color represents a different electrode. C) The difference in detection thresholds before and after the adaptation paradigm. Colors are the same as in panel b. The dotted line represents the mean threshold difference.
DISCUSSION
Effect of stimulation frequency on adaptation
Continuous stimulation at high frequencies as well as burst-modulated stimulation protocols caused adaptation of the perceived intensity, and eventually extinction of the sensations for burst-modulated paradigms. However, at the lowest stimulation frequency there was no change in the perceived intensity over 15 s of stimulation (Fig. 1B). This is analogous to observations in the peripheral nervous system in which lower frequencies increased the time before intensity decreases occurred [11], although this has not been true for all studies [10]. Higher stimulation frequencies have also caused more rapid changes in detection thresholds with electrocutaneous stimulation [13,15] as well as for vibrotactile stimulation [16–20,26,27] where higher frequencies resulted in larger and faster changes in detection thresholds as well as decreases in the ability to discriminate stimuli. For electrocutaneous stimulation, stimulus rates over 1000 Hz led to sensation extinction within seconds [15], while lower frequencies and burst paradigms allowed sensations to be evoked for many minutes [13].
Here, the only stimulus paradigm that that did not cause adaptation was continuous stimulation at 20 Hz for 15 s. Due to protocol limitations, driven by concerns about stimulation-driven tissue damage [22], we do not stimulate continuously for periods longer than this, so we cannot know if these low frequencies would have caused adaptation over longer periods of time. While this is encouraging, there are limitations using low frequency stimulation. Low frequency stimulation typically evokes qualities of “tapping” or “sparkle” that could be undesirable for object grasping, and on some electrodes low frequencies are unable to drive sensation at all [17]. Therefore, low frequency stimulation itself will not provide a practical means to provide reliable sensations for all electrodes and qualities.
Intermittent stimulation reduced adaptation
Intermittent stimulation allowed sensations to be evoked over much longer periods of time than continuous stimulation, similar to electrocutaneous stimulation [14]. While intensity adaptation still occurred with intermittent stimulation, the magnitude and duration were electrode dependent, similar to the effects of ICMS in the visual cortex [9]. Interestingly, these electrode-dependent effects ranged from stimulation nearly eliminating the percepts, to having no effect at all (Fig. 3C). Importantly, intermittent stimulation never completely extinguished the sensations over 200 s using 100 Hz stimulus trains. Intermittent stimulation is more conceptually similar to the transient neural activity of many cortical neurons during touch than constant stimulation [28] and could provide stimulation during important task-dependent intervals, evoking more reliable sensations over longer periods of time.
Detection thresholds increased slightly after long periods of stimulation
We found that continuous stimulation resulted in a small but statistically significant increases in detection thresholds measured before and after stimulation. This conceptually agrees with results for peripheral nerve and electrocutaneous stimulation, where detection thresholds increased significantly after continuous stimulation [10,13,15]. However, the magnitude of this change may be different between paradigms. For electrocutaneous stimulation, an increase in threshold of 60-270% was found depending on the parameters used. For peripheral stimulation, results appear to show a mean increase of 20-40%. In our results, we found a mean threshold elevation of 16%. The reason for the difference in magnitudes between these paradigms is difficult to assess but may be related to different mechanisms of action for each stimulation method.
Additionally, this result conceptually agrees with our other results involving intensity adaptation, in which continuous stimulation resulted in decreases in perceived intensity. The magnitude of the change agrees most closely with the change in intensity observed during intermittent stimulation. This may be because the stimulation method used for detection adaptation, which involves delivering 1 s stimulus trains followed by a delay of 5-10 seconds for 2-5 minutes, bears a resemblance to the method used for intermittent intensity adaptation. In fact, we found that changes in percept intensity driven by intermittent stimulation stabilized after approximately 100 s (Fig. 4).
Physiological mechanisms of adaptation
Adaptation of the perceived intensity and changes in the ability to both discriminate and detect tactile stimuli occur in normal touch [16–20,26,27,29] and are most likely driven by central mechanisms [30,31]. This adaptation occurs in multiple sensory cortices, where a constant stimulus typically results in rapidly decreasing neural responses [31,32]. Additionally, adaptation of neural responses has been observed for ICMS in mouse cortex, where high-frequency stimulation led to rapid adaptation of neurons away from the electrode [33]. One possible mechanism, short-term depression, has previously been implicated in adaptation, specifically for thalamocortical projections [34]. Short-term depression at thalamocortical synapses was purported to play a strong role in rapid adaptation to brief stimuli provided to the whisker or electrical stimulation (adaptation and recovery within seconds), but separate mechanisms were suggested for slow adaptation (adaptation for minutes or longer). Another possible mechanism is inhibitory neuron drive [35–37]. Two specific types of inhibitory interneurons, parvalbumin and somatostatin neurons, play important roles in adaptation in the auditory cortex [38,39], with parvalbumin neurons providing continuous inhibition throughout the stimulus and somatostatin neurons providing dynamic inhibitory drive based on the number of repetitions.
Taken together, the literature suggests that adaptation occurs as a normal part of cortical processing of sensory information. Slow adaptation may depend more on the activity of different neuronal subtypes while rapid adaptation depends more on short-term depression at synapses. This could explain why continuous ICMS led to consistent decreases in intensity while intermittent ICMS had more electrode specific effects. Electrode specific effects may be related to the density of different neuronal subtypes recruited by ICMS. Because ICMS bypasses subcortical inputs, adaptation that occurs from ICMS may look different than normal sensory adaptation and may depend on the targeted area and stimulated electrode. Normal tactile input leads to changes in intensity, but not extinction of perception. Continuous ICMS leads to extinction, implying that adaptation driven by ICMS is not identical to adaptation driven in normal sensory processing.
Limitations
This study represents the first study of adaptation to ICMS in human somatosensory cortex. However, there are several limitations that should be considered. First, these experiments were only conducted in one participant. Additional data in other participants will be needed to understand if there are participant or implant location specific effects. Additionally, there is a very large parameter space (electrode, amplitude, frequency, burst intervals, etc.) and only a few specific parameter combinations were considered here. One reason for this is that there is typically limited experimental time available with human participants, making it difficult to explore comprehensive parameter sets. Further, we were not able to change pulse width because of limitations in our protocols. Data collected in more participants with additional parameter variations will provide further insights into the nature of adaptation. Finally, developing a mechanistic understanding of adaptation in humans is challenging because of hardware limitations and the current use of electrical stimulation and recording techniques. Simultaneous neural recording and stimulation is a challenging problem due to stimulation artifacts, and the hardware presently approved for use in humans does not enable these experiments. While optical stimulation or recording may allow novel experiments without the complications of electrical artifacts, these techniques are limited to small animal models.
Implications for bidirectional brain-computer interfaces
There are at least two approaches to encoding sensory information in stimulus trains: biomimetic [40–42] and engineered [6,43,44] encoding. Biomimetic approaches aim to create patterns of stimulation that mimic the neural activity that occurs during natural touch, while engineered approaches aim to provide informative stimulation that can be learned to represent specific inputs. Both approaches have met with success in applications in the peripheral nervous system for improving robotic arm control [40,41]. Biomimetic feedback in the peripheral nervous system evoked more natural sensations and improved performance on some motor tasks [41]. In the cortex, a simple encoding in which force was linearly transformed to amplitude improved neuroprosthesis control [6]. However, if contact is maintained for long periods of time with this paradigm, the percepts will become undetectable after just a few seconds (Fig 2). Burst stimulation and lower frequencies could help extend the percept time, but with limitations. Recently a more biomimetic method for ICMS was used in an object discrimination task [45]. While task performance did not improve, less stimulus charge was required for equivalent task performance, which is promising for clinical applications.
Biomimetic encoding may drive more natural adaptation processes. Biomimetic pulse trains can be built from computational models that predict neural activity based on tactile input [46–48]. These models predict that during object contact, large populations of neurons become active with high firing rates. During maintained contact, the number of active neurons and their firing rates are significantly reduced, which aligns with recorded neural activity in the cortex during touch [28]. Biomimetic stimulus trains would naturally resemble the intermittent stimulation protocols tested here (Fig. 3), allowing sensations to persist over longer periods of time without extinction. We suggest that biomimetic approaches may provide a reliable way to provide sensory feedback for bidirectional BCI applications and may align more directly with typical cortical activation and adaptation.
Supplementary Material
ACKNOWLEDGEMENTS
We would like to thank N. Copeland for his extraordinary commitment to this study, as well as Debbie Harrington (Physical Medicine and Rehabilitation) for regulatory management of the study.
FUNDING
This work was supported by the Defense Advanced Research Projects Agency (DARPA) and Space and Naval Warfare Systems Center Pacific (SSC Pacific) under Contract N66001-16-C4051 and the National Institute of Neurological Disorders and Stroke of the National Institutes of Health under Award Numbers UH3NS107714 and U01NS108922. SNF was supported by an NSF Graduate Research Fellowship under grant number DGE-1247842. Any opinions, findings and conclusions or recommendations expressed here are those of the authors and do not necessarily reflect the views of DARPA, SSC Pacific, or the National Institutes of Health. The funders had no role in the study design, data collection, interpretation of the results, or the decision to submit this work for publication.
Footnotes
DATA STATEMENT
Data and code are available upon reasonable request.
CREDIT AUTHORSHIP CONTRIBUTION STATEMENT
Christopher L. Hughes: Conceptualization, Methodology, Software, Formal Analysis, Investigation, Writing-Original Draft, Writing-Review & Editing, Visualization. Sharlene N. Flesher: Conceptualization, Methodology, Software, Investigation, Writing-Review & Editing. Robert A. Gaunt: Conceptualization, Methodology, Writing-Review & Editing, Visualization, Supervision.
DECLARATION OF COMPETING INTEREST
R.A.G. is a paid consultant for Blackrock Microsystems and serves on the scientific advisory board of Braingrade.
REFERENCES
- [1].Flesher SN, Collinger JL, Foldes ST, Weiss JM, Downey JE, Tyler-Kabara EC, et al. Intracortical microstimulation of human somatosensory cortex. Science Translational Medicine 2016;8:1–11. 10.1126/scitranslmed.aaf8083. [DOI] [PubMed] [Google Scholar]
- [2].Armenta Salas M, Bashford L, Kellis S, Jafari M, Jo H, Kramer D, et al. Proprioceptive and cutaneous sensations in humans elicited by intracortical microstimulation. Elife 2018:e32904. 10.7554/eLife.32904. [DOI] [PMC free article] [PubMed] [Google Scholar]
- [3].Fifer MS, McMullen DP, Thomas TM, Osborn LE, Nickl R, Candrea D, et al. Intracortical microstimulation of human fingertip sensations. MedRxiv 2020. 10.1101/2020.05.29.20117374. [DOI] [Google Scholar]
- [4].Flesher S, Downey J, Collinger J, Foldes S, Weiss J, Tyler-Kabara E, et al. Intracortical Microstimulation as a Feedback Source for Brain-Computer Interface Users. Proceedings of the 6th International Brain-Computer Interface Meeting, 2017, p. 43–54. 10.1007/978-3-319-64373-1_5. [DOI] [Google Scholar]
- [5].Hughes CL, Herrera A, Gaunt R, Collinger J. Bidirectional brain-computer interfaces. Handbook of Clinical Neurology 2020;168:163–81. [DOI] [PubMed] [Google Scholar]
- [6].Flesher SN, Downey JE, Weiss JM, Hughes CL, Herrera AJ, Tyler-Kabara EC, et al. A brain-computer interface that evokes tactile sensations improves robotic arm control. 2021. [DOI] [PMC free article] [PubMed]
- [7].Hughes CL, Flesher SN, Weiss JM, Boninger ML, Collinger J, Gaunt R. Perception of microstimulation frequency in human somatosensory cortex. Elife 2021;10. 10.7554/ELIFE.65128. [DOI] [PMC free article] [PubMed] [Google Scholar]
- [8].Hughes C, Flesher SN, Weiss JM, Downey J, Boninger ML, Collinger J, et al. Neural stimulation and recording performance in human sensorimotor cortex over 1500 days. Journal of Neural Engineering 2021;7. 10.1088/1741-2552/AC18AD. [DOI] [PMC free article] [PubMed] [Google Scholar]
- [9].Schmidt EM, Bak MJ, Hambrecht FT, Kufta C v., O’Rourke DK, Vallabhanath P. Feasibility of a visual prosthesis for the blind based on intracortical micro stimulation of the visual cortex. Brain 1996;119:507–22. 10.1093/brain/119.2.507. [DOI] [PubMed] [Google Scholar]
- [10].Graczyk EL, Delhaye BP, Schiefer MA, Bensmaia SJ, Tyler DJ. Sensory adaptation to electrical stimulation of the somatosensory nerves. Journal of Neural Engineering 2018;15:046002. 10.1088/1741-2552/aab790. [DOI] [PMC free article] [PubMed] [Google Scholar]
- [11].Valle G, Petrini FM, Strauss I, Iberite F, D’Anna E, Granata G, et al. Comparison of linear frequency and amplitude modulation for intraneural sensory feedback in bidirectional hand prostheses. Scientific Reports 2018;8. 10.1038/s41598-018-34910-w. [DOI] [PMC free article] [PubMed] [Google Scholar]
- [12].Kljajic J, Valle G, Raspopovic S. Modeling sensory adaptation to peripheral nerve stimulation. International IEEE/EMBS Conference on Neural Engineering, NER, vol. 2021- May, 2021, p. 788–91. 10.1109/NER49283.2021.9441349. [DOI] [Google Scholar]
- [13].Kaczmarek KA. Electrotactile adaptation on the abdomen: Preliminary results. IEEE Transactions on Rehabilitation Engineering 2000;8:499–505. 10.1109/86.895953. [DOI] [PubMed] [Google Scholar]
- [14].Buma DG, Buitenweg JR, Veltink PH. Intermittent stimulation delays adaptation to electrocutaneous sensory feedback. IEEE Transactions on Neural Systems and Rehabilitation Engineering 2007;15:435–41. 10.1109/TNSRE.2007.903942. [DOI] [PubMed] [Google Scholar]
- [15].Szeto AYJ, Saunders FA. Electrocutaneous Stimulation for Sensory Communication in Rehabilitation Engineering. IEEE Transactions on Biomedical Engineering 1982;BME-29:300–8. 10.1109/TBME.1982.324948. [DOI] [PubMed] [Google Scholar]
- [16].Hollins Sliman J. Bensmaïa, Sean WM. Vibrotactile adaptation impairs discrimination of fine, but not coarse, textures. Somatosensory & Motor Research 2001;18:253–62. 10.1080/01421590120089640. [DOI] [PubMed] [Google Scholar]
- [17].Goble AK, Hollins M. Vibrotactile adaptation enhances amplitude discrimination. J Acoust Soc Am 1993;93:418–24. 10.1121/1.405621. [DOI] [PubMed] [Google Scholar]
- [18].Goble AK, Hollins M. Vibrotactile adaptation enhances frequency discrimination. J Acoust Soc Am 1994;96:771–80. 10.1121/1.410314. [DOI] [PubMed] [Google Scholar]
- [19].Hollins M, Delemos KA, Goble AK. Vibrotactile adaptation on the face. Perception & Psychophysics 1991;49:21–30. 10.3758/BF03211612. [DOI] [PubMed] [Google Scholar]
- [20].Hollins M, Goble AK, Whitsel BL, Tommerdahl M. Time course and action spectrum of vibrotactile adaptation. Somatosensory & Motor Research 1990;7:205–21. 10.3109/08990229009144707. [DOI] [PubMed] [Google Scholar]
- [21].Hughes CL, Gaunt RA. Changes in interpulse spacing changes tactile perception of microstimulation in human somatosensory cortex. 10th International IEEE EMBS Conference on Neural Engineering, 2021, p. 1–4. [Google Scholar]
- [22].McCreery D, Pikov V, Troyk PR. Neuronal loss due to prolonged controlled-current stimulation with chronically implanted microelectrodes in the cat cerebral cortex. Journal of Neural Engineering 2010;7:036005. 10.1088/1741-2560/7/3/036005. [DOI] [PMC free article] [PubMed] [Google Scholar]
- [23].Chen KH, Dammann JF, Boback JL, Tenore F v, Otto KJ, Gaunt RA, et al. The effect of chronic intracortical microstimulation on the electrode–tissue interface. Journal of Neural Engineering 2014;11:026004. 10.1088/1741-2560/11/2/026004. [DOI] [PMC free article] [PubMed] [Google Scholar]
- [24].Leek MR. Adaptive procedures in psychophysical research. Perception and Psychophysics 2001;63:1279–92. 10.3758/BF03194543. [DOI] [PubMed] [Google Scholar]
- [25].Levitt H Transformed Up‐Down Methods in Psychoacoustics. J Acoust Soc Am 1971;49:467–77. 10.1121/1.1912375. [DOI] [PubMed] [Google Scholar]
- [26].O’Mara S, Rowe MJ, Tarvin RPC. Neural mechanisms in vibrotactile adaptation. Journal of Neurophysiology 1988;59:607–22. 10.1152/JN.1988.59.2.607. [DOI] [PubMed] [Google Scholar]
- [27].Berglund U, Berglund B. Adaption and recovery in vibrotactile perception. Percept Mot Skills 1970;30:843–53. 10.2466/pms.1970.30.3.843. [DOI] [PubMed] [Google Scholar]
- [28].Callier T, Suresh AK, Bensmaia SJ. Neural Coding of Contact Events in Somatosensory Cortex. Cerebral Cortex 2018. 10.1093/cercor/bhy337. [DOI] [PMC free article] [PubMed] [Google Scholar]
- [29].Hollins M, Roy EA. Perceived Intensity of Vibrotactile Stimuli: The Role of Mechanoreceptive Channels. Somatosensory & Motor Research 1996;13:273–86. 10.3109/08990229609052583. [DOI] [PubMed] [Google Scholar]
- [30].Wark B, Lundstrom BN, Fairhall A. Sensory adaptation. Current Opinion in Neurobiology 2007;17:423–9. 10.1016/j.conb.2007.07.001. [DOI] [PMC free article] [PubMed] [Google Scholar]
- [31].Kohn A, Whitsel BL. Sensory cortical dynamics. Behavioural Brain Research 2002;135:119–26. 10.1016/S0166-4328(02)00139-0. [DOI] [PubMed] [Google Scholar]
- [32].Cannestra AF, Pouratian N, Shomer MH, Toga AW. Refractory periods observed by intrinsic signal and fluorescent dye imaging. Journal of Neurophysiology 1998;80:1522–32. 10.1152/JN.1998.80.3.1522. [DOI] [PubMed] [Google Scholar]
- [33].Michelson NJ, Eles JR, Vazquez AL, Ludwig KA, Kozai TDY. Calcium activation of cortical neurons by continuous electrical stimulation: Frequency dependence, temporal fidelity, and activation density. Journal of Neuroscience Research 2019;97:620–38. 10.1002/jnr.24370. [DOI] [PMC free article] [PubMed] [Google Scholar]
- [34].Chung S, Li X, Nelson SB. Short-Term Depression at Thalamocortical Synapses Contributes to Rapid Adaptation of Cortical Sensory Responses In Vivo. Neuron 2002;34:437–46. 10.1016/S0896-6273(02)00659-1. [DOI] [PubMed] [Google Scholar]
- [35].Swanson OK, Maffei A. From hiring to firing: Activation of inhibitory neurons and their recruitment in behavior. Frontiers in Molecular Neuroscience 2019;12. [DOI] [PMC free article] [PubMed] [Google Scholar]
- [36].Richter L, Gjorgjieva J. Interneuron subtypes enable independent modulation of excitatory and inhibitory firing rates after sensory deprivation. BioRxiv 2021:2021.05.25.445562. 10.1101/2021.05.25.445562. [DOI] [PMC free article] [PubMed] [Google Scholar]
- [37].Large AM, Vogler NW, Canto-Bustos M, Friason FK, Schick P, Oswald AMM. Differential inhibition of pyramidal cells and inhibitory interneurons along the rostrocaudal axis of anterior piriform cortex. Proc Natl Acad Sci U S A 2018;115:E8067–E8076A. 10.1073/pnas.1802428115. [DOI] [PMC free article] [PubMed] [Google Scholar]
- [38].Natan RG, Rao W, Geffen MN. Cortical Interneurons Differentially Shape Frequency Tuning following Adaptation. Cell Reports 2017;21:878–90. 10.1016/j.celrep.2017.10.012. [DOI] [PMC free article] [PubMed] [Google Scholar]
- [39].Natan RG, Briguglio JJ, Mwilambwe-Tshilobo L, Jones SI, Aizenberg M, Goldberg EM, et al. Complementary control of sensory adaptation by two types of cortical interneurons. Elife 2015;4. 10.7554/eLife.09868. [DOI] [PMC free article] [PubMed] [Google Scholar]
- [40].George JA, Kluger DT, Davis TS, Wendelken SM, Okorokova E v., He Q, et al. Biomimetic sensory feedback through peripheral nerve stimulation improves dexterous use of a bionic hand. Science Robotics 2019;4. 10.1126/scirobotics.aax2352. [DOI] [PubMed] [Google Scholar]
- [41].Valle G, Mazzoni A, Iberite F, D’Anna E, Strauss I, Granata G, et al. Biomimetic Intraneural Sensory Feedback Enhances Sensation Naturalness, Tactile Sensitivity, and Manual Dexterity in a Bidirectional Prosthesis. Neuron 2018;100:37–45. 10.1016/j.neuron.2018.08.033. [DOI] [PubMed] [Google Scholar]
- [42].Saal HP, Bensmaia SJ. Biomimetic approaches to bionic touch through a peripheral nerve interface. Neuropsychologia 2015;79:344–53. 10.1016/j.neuropsychologia.2015.06.010. [DOI] [PubMed] [Google Scholar]
- [43].Dadarlat MC, O’Doherty JE, Sabes PN. A learning-based approach to artificial sensory feedback leads to optimal integration. Nature Neuroscience 2014;18:138–44. 10.1038/nn.3883. [DOI] [PMC free article] [PubMed] [Google Scholar]
- [44].Raspopovic S, Capogrosso M, Petrini FM, Bonizzato M, Rigosa J, di Pino G, et al. Restoring natural sensory feedback in real-time bidirectional hand prostheses. Science Translational Medicine 2014;6:222ra19. 10.1126/scitranslmed.3006820. [DOI] [PubMed] [Google Scholar]
- [45].Osborn LE, Christie BP, McMullen DP, Nickl RW, Thompson MC, Pawar AS, et al. Intracortical microstimulation of somatosensory cortex enables object identification through perceived sensations. 2021 43rd Annual International Conference of the IEEE Engineering in Medicine & Biology Society (EMBC), IEEE; 2021, p. 6259–62. 10.1109/EMBC46164.2021.9630450. [DOI] [PubMed] [Google Scholar]
- [46].Saal HP, Delhaye BP, Rayhaun BC, Bensmaia SJ. Simulating tactile signals from the whole hand with millisecond precision. Proc Natl Acad Sci U S A 2017;114:E5693–702. 10.1073/pnas.1704856114. [DOI] [PMC free article] [PubMed] [Google Scholar]
- [47].Okorokova EV, He Q, Bensmaia SJ. Biomimetic encoding model for restoring touch in bionic hands through a nerve interface. Journal of Neural Engineering 2018;15. 10.1088/1741-2552/aae398. [DOI] [PMC free article] [PubMed] [Google Scholar]
- [48].Kumaravelu K, Tomlinson T, Callier T, Sombeck J, Bensmaia SJ, Miller LE, et al. A comprehensive model-based framework for optimal design of biomimetic patterns of electrical stimulation for prosthetic sensation. Journal of Neural Engineering 2020;17:46045. 10.1088/1741-2552/abacd8. [DOI] [PMC free article] [PubMed] [Google Scholar]
Associated Data
This section collects any data citations, data availability statements, or supplementary materials included in this article.