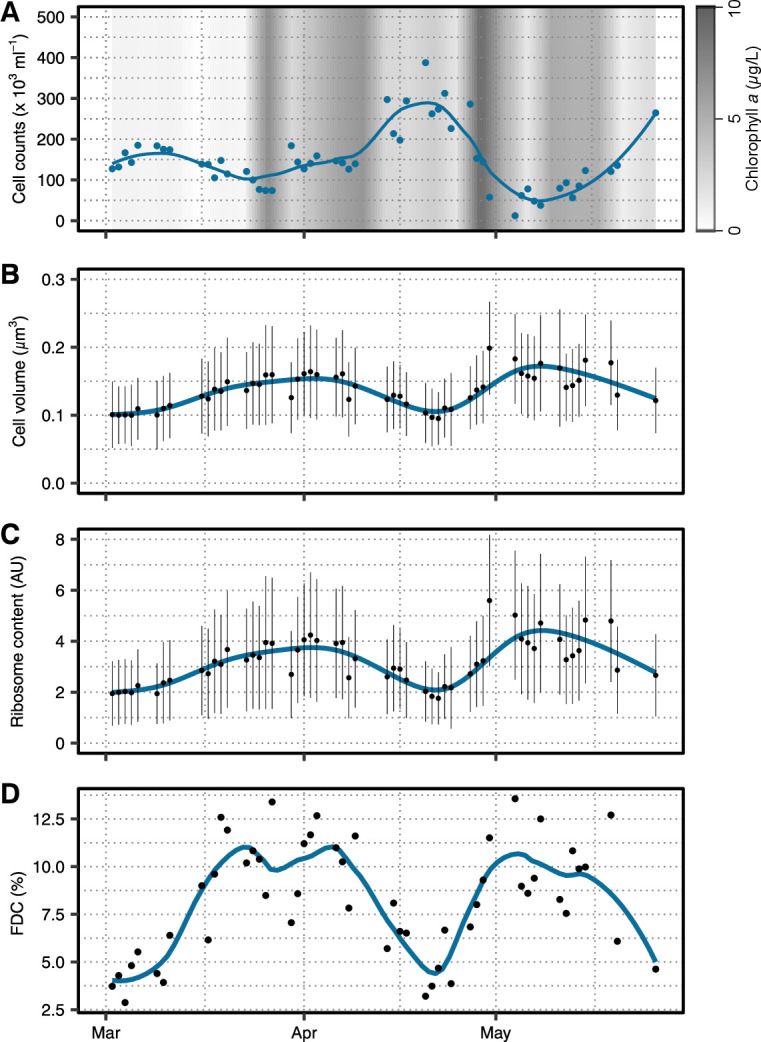
Fig 1.

Cellular parameters of SAR11 during the spring bloom in 2020. (A) Cell abundances in blue and chlorophyll a concentration as gray background. (B) Cell volumes and (C) ribosome contents were calculated from CARD-FISH signals and plotted as means per day (black points) ± SD (black lines). A loess smoothing of all data is depicted in blue. (D) The FDC, as a measure of cell division, was determined from cells with two intracellular local DAPI maxima. An FDC per sampling day is shown as black points and loess smoothing as blue line.
