

Abstract
PURPOSE
Accurately distinguishing renal cell carcinoma (RCC) from normal kidney tissue is critical for identifying positive surgical margins (PSMs) during partial and radical nephrectomy, which remains the primary intervention for localized RCC. Techniques that detect PSM with higher accuracy and faster turnaround time than intraoperative frozen section (IFS) analysis can help decrease reoperation rates, relieve patient anxiety and costs, and potentially improve patient outcomes.
MATERIALS AND METHODS
Here, we extended our combined desorption electrospray ionization mass spectrometry imaging (DESI-MSI) and machine learning methodology to identify metabolite and lipid species from tissue surfaces that can distinguish normal tissues from clear cell RCC (ccRCC), papillary RCC (pRCC), and chromophobe RCC (chRCC) tissues.
RESULTS
From 24 normal and 40 renal cancer (23 ccRCC, 13 pRCC, and 4 chRCC) tissues, we developed a multinomial lasso classifier that selects 281 total analytes from over 27,000 detected molecular species that distinguishes all histological subtypes of RCC from normal kidney tissues with 84.5% accuracy. On the basis of independent test data reflecting distinct patient populations, the classifier achieves 85.4% and 91.2% accuracy on a Stanford test set (20 normal and 28 RCC) and a Baylor-UT Austin test set (16 normal and 41 RCC), respectively. The majority of the model's selected features show consistent trends across data sets affirming its stable performance, where the suppression of arachidonic acid metabolism is identified as a shared molecular feature of ccRCC and pRCC.
CONCLUSION
Together, these results indicate that signatures derived from DESI-MSI combined with machine learning may be used to rapidly determine surgical margin status with accuracies that meet or exceed those reported for IFS.
Combining mass spectrometry imaging and machine learning enables successful diagnosis of renal cell carcinoma from normal kidney tissues.
INTRODUCTION
The standard treatment for localized renal cell carcinoma (RCC) is surgical resection including partial and radical nephrectomy. However, 30%-60% of the patients will experience tumor recurrence.1 The finding of positive surgical margins (PSMs) on surgical pathological analysis, ranging from 0.1% to 18% for patients with small renal masses and 18% to 32% for patients with advanced RCC,2 has been associated with increased rate of local relapse3 and worse overall survival independent of other predictors.4 Patients with PSM either undergo an immediate second surgery or are actively monitored for tumor progression by imaging.5,6 Avoiding PSM will help decrease reoperation rates, relieve patient anxiety and costs, and improve patient outcomes. However, the most common technique for minimizing the risk of PSM, that is, intraoperative frozen section (IFS),7,8 has low accuracy9,10 caused by multiple factors, including artifacts of frozen tissue sections.11 Another problem with IFS is the long turnaround time, requiring surgeries to be paused for 20-60 minutes while tissue margins are analyzed histologically, which subjects patients to increased risk related to extended anesthesia, and underscores the need for better techniques to accurately detect PSM with fast turnabout time.
CONTEXT
Key Objective
Accurately distinguishing renal cell carcinoma (RCC) from normal kidney tissue is critical for identifying positive surgical margins (PSMs) during partial and radical nephrectomy, which remains the primary intervention for localized RCC.
Knowledge Generated
Using the combination of desorption electrospray ionization mass spectrometry imaging (DESI-MSI) and statistical lasso modeling approaches, we report the development of a multinomial classifier (>84% accuracy), evaluated on three data sets reflecting different patient populations from different institutions, for distinguishing all histological subtypes of RCC from normal tissues with high sensitivity and specificity.
Relevance
Our proof-of-concept work lays the groundwork for implementing DESI-MSI–based PSM detection in RCC with higher accuracy and faster turnaround time than the current standard of care, intraoperative frozen section, which could decrease reoperation rates, relieve patient anxiety and costs, and potentially improve patient outcomes.
We and others have demonstrated that the application of desorption electrospray ionization mass spectrometric imaging (DESI-MSI), an ambient ionization mass spectrometry technique that enables spatially mapping the abundances of metabolite and lipid species on tissue surfaces,12,13 can distinguish normal from malignant tissues in several organs including pancreas, brain, breast, stomach, kidney, and prostate.14-19 DESI-MSI can classify PSM versus negative surgical margins with high sensitivity and specificity in several cohorts of prospectively collected surgical specimens. For example, >98% agreement with histopathology was achieved by DESI-MSI in 32 pancreatectomies.18 Along these lines, agreement with histopathology was also achieved for 86%, 89%, and 80% breast, gastric, and brain tissue specimens, respectively,14,15,17 highlighting the potential value of DESI-MSI in providing accurate and rapid assessment of surgical margin for intraoperative use. Because DESI-MSI is such a well-established technique, details of its implementation in the present studies are relegated to the supporting information.
RCC lends itself to detection by metabolomic approaches because many initiating mutations affect metabolism (eg, Von Hippel-Lindau mutations induce tumor switch to glycolytic metabolism).20 In clear cell RCC (ccRCC), the major RCC subtype encompassing 70%-80% of RCCs, lipidomic profiling of 49 paired normal versus cancer tissues showed that >70% of the detected lipids were significantly different in cancer compared with normal kidney cortex.21 In addition, DESI-MSI analysis of tissues from two separate ccRCC cohorts (15 ccRCC v 13 normal and nine ccRCC v nine paired normal) identified analytes that separate ccRCC from noncancerous kidney tissues.19,22 Recently, we evaluated the feasibility of using DESI-MSI in distinguishing ccRCC versus noncancerous kidney tissues in 40 normal tumor pairs of patient specimens and reported a predictive model with 85% accuracy validated in an independent test set of 17 pairs.23 These results demonstrated the utility of DESI-MSI–derived metabolite-based signatures in distinguishing ccRCC from normal kidney tissues. However, whether such metabolite-based signatures can distinguish normal kidney tissues from other histological subtypes of RCC including papillary RCC (pRCC) and chromophobe RCC (chRCC) remain to be investigated.
In this study, we extended our methodology24 to incorporate other histological subtypes of RCC including pRCC (10%-15% of RCC) and chRCC (4%-5% of RCC). We built a multinomial lasso classifier on 24 normal, 23 ccRCC, 13 pRCC, and four chRCC tissues to distinguish all histological subtypes of RCC from normal kidney tissues. To assess model generalizability, we also evaluated this classifier's performance on two independent test sets comprised of 48 tissues (20 normal and 28 cancer) from Stanford and 57 tissues (16 normal and 41 cancer) from Baylor-UT Austin.25 In addition, we characterized the multinomial model features and evaluated its performance in classifying RCC histological subtypes, that is, ccRCC, pRCC, and chRCC. Beyond its performance in classifying RCC subtypes, we also detect a conserved signature of arachidonic acid suppression in ccRCC and pRCC tissues. The differences are detected for several eicosanoid metabolic pathway products. This result indicates that lipid reprogramming is an important feature of RCC tumorigenesis, as previously reported,21,26 and that our methodology can more broadly identify specific pathways that contribute to RCC progression.
MATERIALS AND METHODS
Tissue Samples
A total of 112 banked frozen human tissue samples including 44 normal kidney tissues with cortex and/or medullar and 68 RCC samples including 41 ccRCC (40 ccRCCs from previous study),23 21 pRCC, and six chRCC samples were harvested from both benign and cancerous areas in subjects undergoing nephrectomy for kidney cancer under an IRB-approved protocol that allowed association of clinical data with specimens (IRB-13828), as previously described.23 For each case, a 5-μm formalin-fixed, paraffin-embedded tissue section was stained with hematoxylin and eosin (H&E) and evaluated by a genitourinary pathologist (C.-S. K.) to confirm histology. In addition, a 5-μm frozen section of each tissue sample was stained with H&E and evaluated to exclude necrotic tissues, and then, a 10-μm section was obtained immediately adjacent to the H&E section using a Leica CM1950 cryostat (Leica Biosystems, Deer Park, IL) for DESI-MSI analysis. All tissues were harvested from radical nephrectomy specimens after patients had signed an informed consent under an Institutional Review Board–approved protocol (IRB-13828).
DESI-MSI Analysis
Information on the conditions for which DESI-MSI was operated, how molecular identifications were made, and how two-dimensional chemical maps were created can be found in the experimental section of the Data Supplement.
Statistical Analysis
To identify the key metabolic signatures with highest classification accuracy between RCC and normal tissues, we trained a pixel-based multinomial model, as described previously.23,24,27 Additional details on how raw data were processed to a training matrix are found in Refs 16, 23, 24, and the Data Supplement (Statistical Methods Description S7). A training matrix was assembled with 52,886 rows and 27,523 columns,24 where each row corresponds to a unique pixel and column to a detected m/z peak. All tissues were processed uniformly, including Stanford training, test, and Baylor-UT Austin test sets.25 Several pixel-based lasso models that predict the probability of a given pixel being cancerous or normal were compared using five-fold cross-validation (CV; Data Supplement [Table 1]). If the class with maximum predicted probability belongs to cancer (clear cell, papillary, or chromophobe), the pixel is predicted to be cancerous. The best performing multinomial model was selected for additional evaluation on independent test sets. Tissue-level performance was assessed by using a majority-wise rule, namely if over half the pixels were predicted to be cancerous regardless of subtype, the entire tissue is predicted to be cancerous.
RESULTS
DESI-MSI Enables Molecular Characterization of Metabolites in All Histological Subtypes of RCC
Using DESI-MSI analysis, we obtained a spatial map of small metabolites and lipids (m/z 50-1,000) across normal, ccRCC, pRCC, and chRCC core biopsy postnephrectomy tissue specimens. DESI-MSI analysis revealed rich metabolite information (Fig 1) characterized by molecular ions such as small metabolites in the m/z 50-200 range; free fatty acids (FFAs), eicosanoids, and monoacylglycerides lipids in the m/z 200-400 range; fatty acid dimers and ceramides (Cer) in the m/z 400-700 range; and glycerophospholipids within the m/z 700-1,000 range in core biopsy tissue from normal kidney (Fig 1A) and pRCC (Fig 1B). Molecular fragmentation MS/MS analysis identified >15 tentative peaks from small metabolites (Data Supplement [Figs 1-4]), such as lactate (m/z 89.0247), succinate (m/z 117.0195), taurine (m/z 124.0077), glutamic acid (m/z 146.0463) glucose + Cl− adduct (m/z 215.0326), and FFAs. Identified FFA peaks include palmitic acid FA(16:0) (m/z 255.2327), oleic acid FA(18:1) (m/z 281.2484), arachidonic acid FA(20:4) (m/z 303.2327), and docosanoic acid FA(22:0) (m/z 339.2092). Using delta nomenclature for the FFAs, we have denoted the total number of carbon atoms to the number of carbon-carbon double bonds (eg, FA(18:1) oleic acid is 18 carbon chain fatty acid with one carbon-carbon double bond). In addition, several eicosanoid pathway metabolites, including prostaglandins, thromboxanes, leukotrienes, and lipoxins, were detected. These metabolites include 12S-hydroxy-5Z,8Z,10E,14Z,17Z-eicosapentaenoic acid (12S-HEPE) FA(20:5,O) (m/z 317.2249), 5S,12R-dihydroxy-6Z,8E,10E,14Z-eicosatetraene-1,20-dioic acid (20-carboxy-leukotriene-B4) LTB4 FA(20:5,O4), (m/z 365.2460), and 9S,15S-dihydroxy-11-oxo-thromboxa-5Z,13E-dien-1-oic acid-d4 (11-dehydro-TXB2-d4) FA(20:2,O4) (m/z 371.2799).
FIG 1.

DESI-MS analysis of normal kidney and RCC tissues, specifically pRCC, shows that normal tissues have higher abundance of m/z 317.2249 (12S-HEPE) compared with RCC tissues. (A) Representative DESI mass spectra of normal kidney tissue and the respective DESI-MS ion images of metabolites m/z 317.2249 (12S-HEPE) and m/z 281.2484 (oleic acid). (B) Representative DESI mass spectra of pRCC tissues and the respective DESI-MS ion images of 12S-HEPE and oleic acid. DESI-MS, desorption electrospray ionization mass spectrometry; FA, fatty acid; NL, normalization; PG, glycerophosphoglycerol; pRCC, papillary RCC; RCC, renal cell carcinoma; 12S-HEPE, 12S-hydroxy-5Z,8Z,10E,14Z,17Z-eicosapentaenoic acid.
Moreover, we observed monoacylglycerides such as MG (18:0) (m/z 393.2642), and fatty acid dimers such as FA(16:0)+FA(16:0) (m/z 511.4728), FA(16:0)+FA(18:1) (m/z 537.4883), FA(18:1)+FA(18:1) (m/z 563.5046), FA(18:1)+FA(20:4) (m/z 585.4890), FA(20:4)+FA(20:4) (m/z 607.4727). Within the 600-1,000 m/z region, ceramides m/z 631.4737, Cer(d40:1) (m/z 655.45920), Cer(d42:2) (m/z 682.5917), and glycerophospholipids such as glycerophosphoglycerol PG(34:1) (m/z 747.5175), PG(36:2) (m/z 773.5335), PG(36:2) (m/z 797.5342) and glycerophosphoinositol PI(38:4) (m/z 885.5482) were detected.
Multinomial Lasso Classifier Stably Distinguishes All Histological Subtypes of RCC From Normal Tissues
We developed a multinomial lasso classifier to find specific m/z peaks that distinguish all histological subtypes of RCC from normal kidney tissues using MassExplorer, a computational pipeline for processing and analyzing raw DESI-MSI data.24 Among an initial training set of 64 tissues (24 normal and 40 cancer including 23 ccRCC, 13 pRCC, and four chRCC), DESI-MSI detects 27,523 m/z peaks in at least a single pixel across 52,886 total pixels. Several models were trained and compared using CV accuracy, sensitivity, and specificity. Sensitivity and specificity are defined as how well the model can identify true positives (cancer) and true negatives (noncancer), respectively. The multinomial lasso classifier, which selects a sparse subset of analytes for each class (normal, clear cell, papillary, and chromophobe; Data Supplement [Fig 5]), picked 281 total m/z coefficients (Data Supplement [Fig 6]) and achieved the best CV accuracy (84.3%), sensitivity (86.8%), and specificity (82.6%; the Data Supplement [Table 1] shows pixel-level performances). The multinomial lasso selected peaks for each class are included in the Data Supplement ([Table 2]). Notably, the multinomial model outperformed the binary logistic regression lasso model, which achieved 72.6% accuracy and selected 572 m/z coefficients (Data Supplement [Table 1]).
We evaluated the multinomial model CV performance on independent test sets, including 48 Stanford tissues (20 normal and 28 cancer) termed Stanford test set and 57 Baylor-UT Austin tissues from Zhang et al25 termed Baylor-UT Austin test set. Table 1 presents the performances of the multinomial model. Importantly, the overall performances appear stable, corresponding to 84.3% accuracy in CV (79.2% specificity and 87.5% sensitivity), 85.4% accuracy on the Stanford test set (100% specificity and 75% sensitivity), and 91.2% accuracy on the Baylor-UT Austin test set (81.3% specificity and 95.1% sensitivity). Additional area under the curve (AUC)-receiver operating characteristic analysis (Fig 2A) estimates the multinomial model achieves AUC 0.807, 0.865, and 0.854 on the Stanford training CV, Stanford test, and Baylor-UT Austin test sets, respectively, affirming the stability of the model performance.
TABLE 1.
Multinomial Lasso Prediction Results (m/z 50-1,000) for 64 Renal Tissue Specimens in the Stanford Training Set, 48 in Stanford Test Set, and 57 in the Baylor-UT Austin Test Set25 in Comparison With Histopathological Analysis

FIG 2.

(A) AUC-ROC analysis compares the performance of the multinomial lasso model across training and test sets and finds stable performance. (B) Comparison of lasso selected m/z peaks from Stanford training to both Stanford and Baylor-UT Austin test data sets indicates that the majority of peaks either associated with normal or cancer tissues maintain consistent trends. (C) Comparison of the arachidonic acid (m/z 303.23) relative intensity across normal, ccRCC, pRCC, and chRCC finds this metabolite is elevated in normal tissues compared with ccRCC and pRCC but lower in normal tissues compared with chRCC levels. AUC-ROC, area under the curve-receiver operating characteristic curve; ccRCC, clear cell RCC; chRCC, chromophobe RCC; CV, cross-validation; pRCC, papillary RCC; RCC, renal cell carcinoma.
Our previously published model23 that distinguishes ccRCC from normal kidney tissues achieved 68.1% accuracy on distinguishing non-cRCC tissues in the Stanford training set (59.8% sensitivity and 96.7% specificity), highlighting the strength of the new model in predicting non-ccRCC subtypes that were not covered by the previous model. Although both Stanford tissues in this study and Baylor-UT Austin tissues in the study by Zhang et al25 were imaged using DESI-MSI, some important methodological differences are worth mentioning. Within the Stanford tissues, the relative abundances were measured for metabolites ranging from m/z 50-1,000, while the Baylor-UT Austin tissue data reflect relative abundances for metabolites ranging from m/z 100-1,500. Additionally, our mass spectrometry measurements used in this study focused on detecting and identifying small metabolites and lipids (m/z 50-400), while Baylor-UT Austin data emphasized complex lipids (m/z 600-1,500). Despite these methodological differences, which limit a direct one-to-one comparison with the published model,25 the consistency of our model performance in detecting RCC from normal tissues across different patient populations more broadly suggests that DESI-MSI–derived metabolic signatures can be used to diagnose RCC.
We further investigated whether the model features (ie, selected m/z peaks) are consistent across data sets. Among analytes selected by the lasso model on the Stanford training set, we evaluated if the selected analytes with higher mean relative abundances in cancer tissues (elevated in cancer, Fig 3B) were also elevated on average in the Stanford test and Baylor-UT Austin test cancer tissues compared with normal tissues. Among selected m/z peaks elevated in normal tissues within the Stanford training set, 63.0% and 52.8% of these peaks are also elevated in Stanford test and Baylor-UT Austin test sets, respectively (Fig 2B). Similarly, for peaks upregulated in training cancer tissues, 74.6% and 54.3% of these peaks are also upregulated in Stanford test and Baylor-UT Austin test sets, respectively. For example, N-acetyl aspartic acid (m/z 174.04) remains upregulated in normal tissues and taurine (m/z 124.00) in pRCC tissues (Data Supplement [Fig 7]). Additionally, arachidonic acid (m/z 303.23) as a feature elevated in normal tissues (Fig 3C) is consistently upregulated in normal tissues compared with ccRCC and pRCC tissues in Stanford training, test, and Baylor-UT Austin test sets by 1.6-, 3.3-, and 2.3-fold, respectively. These results show that the majority (>50%) of peaks that are either associated with normal or cancer tissues maintain the same trend across test sets and demonstrate the capability of our DESI-MSI and statistical analysis in identifying consistent signatures for RCC diagnosis.
FIG 3.
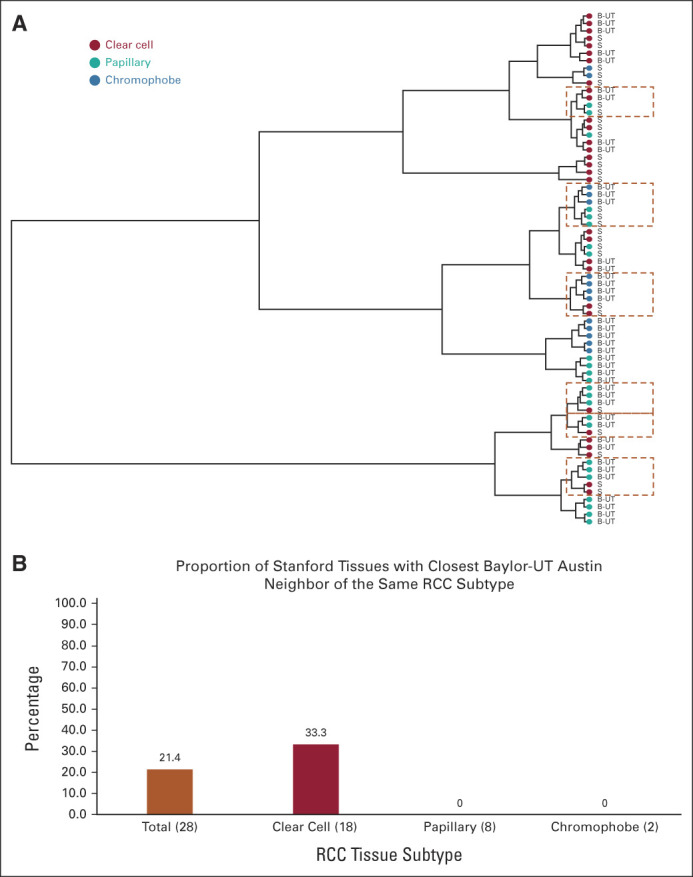
(A) Dendogram from hierarchical clustering of Stanford test (S) and Baylor-UT Austin test tissues (B-UT) is shown. Dot colors correspond to RCC subtype, and perforated boxes are drawn around leaves where tissues of distinct RCC histological subtypes cluster together. (B) Comparison across tissues of what proportion of Stanford test tissues is most similar to a Baylor-UT Austin test tissue of the same subtype. The number of tissues is shown in parentheses, where 28 total tissues from the Stanford test set were evaluated (18 clear cell, eight papillary, and two chromophobe). RCC, renal cell carcinoma.
Multinomial Lasso Classifier Does Not Distinguish Histological Subtypes of RCC
When only considering RCC tissues, the accuracy of our multinomial lasso classifier in distinguishing particular histological subtypes in Stanford CV training set, Stanford test set, and Baylor-UT Austin test set is 82.5%, 60.7%, and 38%, respectively (Data Supplement [Table 3]). The decline in classifier performance can be ascribed to frequently misclassifying one RCC subtype for another, specifically assigning chRCC as ccRCC or pRCC. Additional characterization of the multinomial model performance in classifying RCC subtypes is included in the Data Supplement ([Statistical Methods section S7-S10]).
Furthermore, we investigated DESI-MSI metabolite profiles of RCC tissues between the Stanford test set and Baylor-UT Austin test set using the 27,523 detected m/z peaks. After the relative abundances across pixels were averaged for each tissue, samples were hierarchically clustered based on Euclidean distance. Figure 3A presents the resulting dendrogram, where each leaf corresponds to a sample from one of the test sets.
Clustering analysis revealed that tissues of the same RCC subtype, even within the same data set, do not readily congregate together. To quantify how frequently RCC tissue histological subtypes across different patient populations of the same histology class cluster together, we determined for each Stanford test tissue which RCC tissue within the Baylor-UT Austin tissue data has the closest molecular signature. Surprisingly, we found that only six of the 28 (21.4%) RCC tissues in the Stanford test data are closest to tissues with the matching subtype within the Baylor-UT Austin test data, with all matching cases corresponding to ccRCC tissues (6/18 = 33.3%; Fig 3B). Of the 10 pRCC and chRCC in the Stanford test data, none cluster closest to tissues of the same subtype in the B-UT test data (Fig 3B). Together, these results suggest that the DESI-MSI profile for the same RCC tissue subtype from different institutions is largely inconsistent and likely explains the poor model test set performance in classifying RCC subtypes.
DESI-MSI Imaging Identifies Suppression of Arachidonic Acid Metabolism Is Conserved Between ccRCC and pRCC Subtypes
Representative spectra across normal tissue and each RCC subtype whose histology was confirmed by H&E staining shows the spatial distribution of arachidonic acid FA(20:4) (303.23 m/z), which appears significantly suppressed in pRCC and ccRCC tissues (Figs 2C and 4). Additionally, 11-dehydro-TXB2-d4 (m/z 371.2791), which is formed from thromboxane A2 species that are derived from arachidonic acid lipids, also appears slightly elevated in the normal tissues compared with RCC histological subtypes (Fig 4), consistent with previous studies of ours and other groups demonstrating suppression of arachidonic acid FA(20:4) as a potential marker in ccRCC tissue diagnosis.21,23 These results demonstrated that suppression of arachidonic acid metabolism is an important shared molecular feature of ccRCC and pRCC.
FIG 4.

DESI-MS analysis shows representative spectra from normal, pRCC, ccRCC, and chRCC tissues. Spatial maps corresponding to arachidonic acid (m/z 303.23) and 11-dehydro-TXB2-d4 (m/z 371.28) suggest elevation of these metabolites in normal compared with RCC tissues. Histology of RCC subtypes was confirmed by H&E staining tissue section from the same cases (shown on right at 40× magnification). ccRCC, clear cell RCC; chRCC, chromophobe RCC; DESI-MS, desorption electrospray ionization mass spectrometry; H&E, hematoxylin and eosin; NL, normalization; pRCC, papillary RCC; RCC, renal cell carcinoma.
DISCUSSION
Our previous work provided the first proof of concept for use of DESI-MSI to determine surgical margin status in ccRCC and revealed key metabolic differences between ccRCC and normal tissue consistent with the metabolic rewiring in ccRCC.23 This study demonstrates that metabolic signatures derived from DESI-MSI can stably distinguish all RCC histological subtypes, including ccRCC, pRCC, and chRCC from normal kidney tissues across different patient populations, adding to a growing body of literature supporting the use of DESI-MSI for cancer diagnosis and surgical margin evaluation.16,22,23,28-32 The multinomial lasso classifier showed excellent performance characteristics with high sensitivity and specificity in distinguishing RCC versus normal tissues in diverse patient populations, matching or exceeding those reported for frozen sections, and providing strong rationale for developing a rapid and reproducible DESI-MSI–based method of assessing cancer margins during surgical resection of RCC to potentially lower the risk of tumor recurrence. Our study also identifies suppression of arachidonic acid metabolism as an important shared molecular feature of ccRCC and pRCC, shedding light on the metabolic changes conserved between these RCC histological subtypes, which will help us better understand the biology of RCC metabolism.
As DESI-MSI is performed at room temperature and in open air, can handle crude sample very easily with minimal sample preparation, and provides a comprehensive chemical map of metabolites, it is an ideal technique for rapid identification and characterization of biological tissue specimens for real-time clinical applications.12,13 The development of nondestructive, histologically compatible solvents has enabled molecular imaging and standard H&E histology to be performed on the same tissue section.12,13 Our study is the first to identify a robust universal DESI-MSI signature that separates all RCC histological subtypes from normal kidney tissue. The next step would be to compare the accuracy of the DESI-MSI model to IFS in determining tumor margins using fresh nephrectomy specimens. We expect DESI-MSI–based methods will be more sensitive and accurate than IFS since neoplastic foci of low-grade RCC are often misinterpreted as thickly cut, crushed benign tubules on IFS. This hypothesis is supported by our previous study using DESI-MSI to evaluate surgical margins in pancreatic cancer, in which margins were found to be positive by DESI-MSI/lasso, but negative by IFS, in eight of 32 patients.18 The median survival for these eight patients was only 10 months, similar to what one would expect for patients with PSM at the time of resection. This short survival time contrasted sharply with patients shown to have negative margins by both DESI-MSI and IFS where survival time was 26 months, suggesting DESI-MSI is more sensitive than IFS in detecting margin involvement by tumor in patients who experienced early recurrence and death. Additionally, as DESI-MSI–derived metabolic signatures cover multiple pathways, including lipid inflammatory signaling, the citric acid cycle, and protein biosynthesis, we envision that our methodology may better capture patient heterogeneity in the tumor margin. Although additional direct comparisons between DESI-MSI and IFS are needed, we anticipate that our combined methodology can provide a more accurate, faster, and affordable intraoperative technology in determining surgical margins in RCC compared with IFS.
Studies have shown that histological subtypes of RCC not only differ in pathophysiology, clinical course, response to treatment, and prognosis but also in molecular characteristics including gene mutations and copy number alterations, gene expression at transcript and protein levels, and DNA methylation status, even within the same histological subtype.33-37 For example, in 2018, Ricketts et al37 performed an integrated genomic analysis of all available histologically confirmed TCGA samples of ccRCC, pRCC, and chRCC and identified shared and subtype-specific molecular features in a cohort of 843 TCGA-RCC. These results indicate that histological subtypes of RCC may share molecular features, including metabolite profiles. However, most of the studies on RCC metabolism have focused on ccRCC, and little is known about changes in pRCC and chRCC metabolism.26,37,38 Our study is the first to show that histologically different RCC subtypes share similarities in their DESI-MSI metabolite profiles, which may shed light on metabolic reprogramming in RCC.
While the focus of our study was to apply DESI-MSI signatures for clinical renal cancer diagnosis, our results indicate that this methodology can be used to understand lipid metabolism reprogramming, one of the hallmarks of RCC.26 The implications of our findings in understanding RCC metabolic reprogramming have been described further in the Implications section of the supporting information. Within this context, we envision that our methodology can help define specific clinically relevant RCC subgroups with differential levels of lipid metabolites that may serve as novel targets for improved immunotherapy efficacy.36
Geoffrey A. Sonn
Consulting or Advisory Role: miR Scientific, Ethicon/Johnson & Johnson
Open Payments Link: https://openpaymentsdata.cms.gov/physician/685470
Livia S. Eberlin
Stock and Other Ownership Interests: MS Pen Technologies, Inc
Honoraria: Merck
Research Funding: Eli Lilly
Patents, Royalties, Other Intellectual Property: Co-inventor in patent from Purdue Research Foundation, Co-inventor in patents related to the MS Pen technology owned by University of Texas in Austin
Robert Tibshirani
Consulting or Advisory Role: Genentech/Roche
No other potential conflicts of interest were reported.
SUPPORT
Supported by the National Institutes of Health (Grant No. CA229933) and the Air Force Office of Scientific Research (AFOSR FA9550-21-1-0170). R.W. is supported by DoD Young Investigator Award (W81XWH2110195).
V.S. and K.V. contributed equally to this work.
DATA SHARING STATEMENT
The metabolic signatures used for diagnosis have been reported in the Data Supplement (Table 2).
AUTHOR CONTRIBUTIONS
Conception and design: Kanchustambham Vijayalakshmi, Geoffrey A. Sonn, Hongjuan Zhao, Richard N. Zare, James D. Brooks
Financial support: Richard N. Zare, James D. Brooks
Administrative support: James D. Brooks
Provision of study materials or patients: James D. Brooks
Collection and assembly of data: Vishnu Shankar, Kanchustambham Vijayalakshmi, Rosalie Nolley, Chia-Sui Kao, Ru Wen, Livia S. Eberlin
Data analysis and interpretation: Vishnu Shankar, Kanchustambham Vijayalakshmi, Chia-Sui Kao, Livia S. Eberlin, Robert Tibshirani, Richard N. Zare, James D. Brooks
Manuscript writing: All authors
Final approval of manuscript: All authors
Accountable for all aspects of the work: All authors
AUTHORS' DISCLOSURES OF POTENTIAL CONFLICTS OF INTEREST
The following represents disclosure information provided by authors of this manuscript. All relationships are considered compensated unless otherwise noted. Relationships are self-held unless noted. I = Immediate Family Member, Inst = My Institution. Relationships may not relate to the subject matter of this manuscript. For more information about ASCO's conflict of interest policy, please refer to www.asco.org/rwc or ascopubs.org/po/author-center.
Open Payments is a public database containing information reported by companies about payments made to US-licensed physicians (Open Payments).
Geoffrey A. Sonn
Consulting or Advisory Role: miR Scientific, Ethicon/Johnson & Johnson
Open Payments Link: https://openpaymentsdata.cms.gov/physician/685470
Livia S. Eberlin
Stock and Other Ownership Interests: MS Pen Technologies, Inc
Honoraria: Merck
Research Funding: Eli Lilly
Patents, Royalties, Other Intellectual Property: Co-inventor in patent from Purdue Research Foundation, Co-inventor in patents related to the MS Pen technology owned by University of Texas in Austin
Robert Tibshirani
Consulting or Advisory Role: Genentech/Roche
No other potential conflicts of interest were reported.
REFERENCES
- 1. Siska PJ, Beckermann KE, Rathmell WK, et al. Strategies to overcome therapeutic resistance in renal cell carcinoma. Urol Oncol. 2017;35:102–110. doi: 10.1016/j.urolonc.2016.12.002. [DOI] [PMC free article] [PubMed] [Google Scholar]
- 2. Laganosky DD, Filson CP, Master VA. Surgical margins in nephron-sparing surgery for renal cell carcinoma. Curr Urol Rep. 2017;18:8. doi: 10.1007/s11934-017-0651-5. [DOI] [PubMed] [Google Scholar]
- 3. Steinestel J, Steffens S, Steinestel K, et al. Positive surgical margins in nephron-sparing surgery: Risk factors and therapeutic consequences. World J Surg Oncol. 2014;12:252. doi: 10.1186/1477-7819-12-252. [DOI] [PMC free article] [PubMed] [Google Scholar]
- 4. Maurice MJ, Zhu H, Kim SP, et al. Reexamining the association between positive surgical margins and survival after partial nephrectomy in a large American cohort. J Endourol. 2016;30:698–703. doi: 10.1089/end.2016.0031. [DOI] [PubMed] [Google Scholar]
- 5. Borghesi M, Brunocilla E, Schiavina R, et al. Positive surgical margins after nephron-sparing surgery for renal cell carcinoma: Incidence, clinical impact, and management. Clin Genitourin Cancer. 2013;11:5–9. doi: 10.1016/j.clgc.2012.09.010. [DOI] [PubMed] [Google Scholar]
- 6. Alemozaffar M, Filson CP, Master VA. The importance of surgical margins in renal cell and urothelial carcinomas. J Surg Oncol. 2016;113:316–322. doi: 10.1002/jso.24121. [DOI] [PubMed] [Google Scholar]
- 7. Eroglu M, Ünsal A, Bakirtaş H, et al. Routine frozen-section biopsy from the surgical bed should be performed during nephron-sparing surgery for renal cell carcinoma. Scand J Urol Nephrol. 2005;39:222–225. doi: 10.1080/00365590510007757. [DOI] [PubMed] [Google Scholar]
- 8. Miyamoto H. Clinical benefits of frozen section assessment during urological surgery: Does it contribute to improving surgical margin status and patient outcomes as previously thought? Int J Urol. 2017;24:25–31. doi: 10.1111/iju.13247. [DOI] [PubMed] [Google Scholar]
- 9. Gordetsky J, Gorin MA, Canner J, et al. Frozen section during partial nephrectomy: Does it predict positive margins? BJU Int. 2015;116:868–872. doi: 10.1111/bju.13011. [DOI] [PubMed] [Google Scholar]
- 10. Bozzini G, Seveso M, Otero JR, et al. Is there a clinical role for frozen section analysis during partial nephrectomy? A multicenter experience over 10 years. Minerva Urol Nefrol. 2020;72:332–338. doi: 10.23736/S0393-2249.19.03110-2. [DOI] [PubMed] [Google Scholar]
- 11. McHale T, Malkowicz SB, Tomaszewski JE, et al. Potential pitfalls in the frozen section evaluation of parenchymal margins in nephron-sparing surgery. Am J Clin Pathol. 2002;118:903–910. doi: 10.1309/N55X-0T0E-DH37-J3UG. [DOI] [PubMed] [Google Scholar]
- 12. Takats Z, Strittmatter N, McKenzie JS. Ambient mass spectrometry in cancer Research. Adv Cancer Res. 2017;134:231–256. doi: 10.1016/bs.acr.2016.11.011. [DOI] [PubMed] [Google Scholar]
- 13. Eberlin LS, Ferreira CR, Dill AL, et al. Desorption electrospray ionization mass spectrometry for lipid characterization and biological tissue imaging. Biochim Biophys Acta. 2011;1811:946–960. doi: 10.1016/j.bbalip.2011.05.006. [DOI] [PMC free article] [PubMed] [Google Scholar]
- 14. Calligaris D, Caragacianu D, Liu X, et al. Application of desorption electrospray ionization mass spectrometry imaging in breast cancer margin analysis. Proc Natl Acad Sci U S A. 2014;111:15184–15189. doi: 10.1073/pnas.1408129111. [DOI] [PMC free article] [PubMed] [Google Scholar]
- 15. Eberlin LS, Norton I, Orringer D, et al. Ambient mass spectrometry for the intraoperative molecular diagnosis of human brain tumors. Proc Natl Acad Sci U S A. 2013;110:1611–1616. doi: 10.1073/pnas.1215687110. [DOI] [PMC free article] [PubMed] [Google Scholar]
- 16. Banerjee S, Zare RN, Tibshirani RJ, et al. Diagnosis of prostate cancer by desorption electrospray ionization mass spectrometric imaging of small metabolites and lipids. Proc Natl Acad Sci U S A. 2017;114:3334–3339. doi: 10.1073/pnas.1700677114. [DOI] [PMC free article] [PubMed] [Google Scholar]
- 17. Eberlin LS, Tibshirani RJ, Zhang J, et al. Molecular assessment of surgical-resection margins of gastric cancer by mass-spectrometric imaging. Proc Natl Acad Sci U S A. 2014;111:2436–2441. doi: 10.1073/pnas.1400274111. [DOI] [PMC free article] [PubMed] [Google Scholar]
- 18. Eberlin LS, Margulis K, Planell-Mendez I, et al. Pancreatic cancer surgical resection margins: Molecular assessment by mass spectrometry imaging. PLoS Med. 2016;13:e1002108. doi: 10.1371/journal.pmed.1002108. [DOI] [PMC free article] [PubMed] [Google Scholar]
- 19. Alfaro CM, Jarmusch AK, Pirro V, et al. Ambient ionization mass spectrometric analysis of human surgical specimens to distinguish renal cell carcinoma from healthy renal tissue. Anal Bioanal Chem. 2016;408:5407–5414. doi: 10.1007/s00216-016-9627-4. [DOI] [PMC free article] [PubMed] [Google Scholar]
- 20. Linehan WM, Bratslavsky G, Pinto PA, et al. Molecular diagnosis and therapy of kidney cancer. Annu Rev Med. 2010;61:329–343. doi: 10.1146/annurev.med.042808.171650. [DOI] [PMC free article] [PubMed] [Google Scholar]
- 21. Saito K, Arai E, Maekawa K, et al. Lipidomic signatures and associated transcriptomic profiles of clear cell renal cell carcinoma. Sci Rep. 2016;6:28932. doi: 10.1038/srep28932. [DOI] [PMC free article] [PubMed] [Google Scholar]
- 22. Dill AL, Eberlin LS, Zheng C, et al. Multivariate statistical differentiation of renal cell carcinomas based on lipidomic analysis by ambient ionization imaging mass spectrometry. Anal Bioanal Chem. 2010;398:2969–2978. doi: 10.1007/s00216-010-4259-6. [DOI] [PMC free article] [PubMed] [Google Scholar]
- 23. Vijayalakshmi K, Shankar V, Bain RM, et al. Identification of diagnostic metabolic signatures in clear cell renal cell carcinoma using mass spectrometry imaging. Int J Cancer. 2020;147:256–265. doi: 10.1002/ijc.32843. [DOI] [PMC free article] [PubMed] [Google Scholar]
- 24. Shankar V, Tibshirani R, Zare RN. MassExplorer: A computational tool for analyzing desorption electrospray ionization mass spectrometry data. Bioinformatics. 2021;37:3688–3690. doi: 10.1093/bioinformatics/btab282. [DOI] [PubMed] [Google Scholar]
- 25. Zhang J, Li SQ, Lin JQ, et al. Mass spectrometry imaging enables discrimination of renal oncocytoma from renal cell cancer subtypes and normal kidney tissues. Cancer Res. 2020;80:689–698. doi: 10.1158/0008-5472.CAN-19-2522. [DOI] [PMC free article] [PubMed] [Google Scholar]
- 26. Heravi G, Yazdanpanah O, Podgorski I, et al. Lipid metabolism reprogramming in renal cell carcinoma. Cancer Metastasis Rev. 2022;41:17–31. doi: 10.1007/s10555-021-09996-w. [DOI] [PMC free article] [PubMed] [Google Scholar]
- 27.Friedman JHT, Simon N, Tibshirani R.2013. https://cran.r-project.org/web/packages/glmnet/index.html glmnet: lasso and elastic-net regularized generalized linear models.
- 28. Calligaris D, Norton I, Feldman DR, et al. Mass spectrometry imaging as a tool for surgical decision-making. J Mass Spectrom. 2013;48:1178–1187. doi: 10.1002/jms.3295. [DOI] [PMC free article] [PubMed] [Google Scholar]
- 29. Balog J, Sasi-Szabó L, Kinross J, et al. Intraoperative tissue identification using rapid evaporative ionization mass spectrometry. Sci Transl Med. 2013;5:194ra93. doi: 10.1126/scitranslmed.3005623. [DOI] [PubMed] [Google Scholar]
- 30. Fatou B, Saudemont P, Leblanc E, et al. In vivo real-time mass spectrometry for guided surgery application. Sci Rep. 2016;6:25919. doi: 10.1038/srep25919. [DOI] [PMC free article] [PubMed] [Google Scholar]
- 31. Ifa DR, Eberlin LS. Ambient ionization mass spectrometry for cancer diagnosis and surgical margin evaluation. Clin Chem. 2016;62:111–123. doi: 10.1373/clinchem.2014.237172. [DOI] [PMC free article] [PubMed] [Google Scholar]
- 32. Alfaro CM, Jarmusch AK, Pirro V, et al. Ambient ionization mass spectrometric analysis of human surgical specimens to distinguish renal cell carcinoma from healthy renal tissue. Anal Bioanal Chem. 2016;408:5407–5414. doi: 10.1007/s00216-016-9627-4. [DOI] [PMC free article] [PubMed] [Google Scholar]
- 33. Büttner FA, Winter S, Stühler V, et al. A novel molecular signature identifies mixed subtypes in renal cell carcinoma with poor prognosis and independent response to immunotherapy. Genome Med. 2022;14:105. doi: 10.1186/s13073-022-01105-y. [DOI] [PMC free article] [PubMed] [Google Scholar]
- 34. Chen F, Zhang Y, Şenbabaoğlu Y, et al. Multilevel genomics-based taxonomy of renal cell carcinoma. Cell Rep. 2016;14:2476–2489. doi: 10.1016/j.celrep.2016.02.024. [DOI] [PMC free article] [PubMed] [Google Scholar]
- 35. Syed JS, Brito J, Pooli A, et al. Transcriptomics in RCC. Urol Oncol. 2020;38:742–754. doi: 10.1016/j.urolonc.2019.12.003. [DOI] [PubMed] [Google Scholar]
- 36. Dizman N, Philip EJ, Pal SK. Genomic profiling in renal cell carcinoma. Nat Rev Nephrol. 2020;16:435–451. doi: 10.1038/s41581-020-0301-x. [DOI] [PubMed] [Google Scholar]
- 37. Ricketts CJ, De Cubas AA, Fan H, et al. The cancer genome atlas comprehensive molecular characterization of renal cell carcinoma. Cell Rep. 2018;23:313–326.e5. doi: 10.1016/j.celrep.2018.03.075. [DOI] [PMC free article] [PubMed] [Google Scholar]
- 38. Aurilio G, Santoni M, Massari F, et al. Metabolomic profiling in renal cell carcinoma patients: News and views. Cancers. 2021;13:5229. doi: 10.3390/cancers13205229. [DOI] [PMC free article] [PubMed] [Google Scholar]
Associated Data
This section collects any data citations, data availability statements, or supplementary materials included in this article.
Data Availability Statement
The metabolic signatures used for diagnosis have been reported in the Data Supplement (Table 2).