PURPOSE
Genomic classification of melanoma has thus far focused on the mutational status of BRAF, NRAS, and NF1. The clinical utility of this classification remains limited, and the landscape of alterations in other oncogenic signaling pathways is underexplored.
METHODS
Using primary samples from the InterMEL study, a retrospective cohort of cases with specimens collected from an international consortium with participating institutions throughout the United States and Australia, with oversampling of cases who ultimately died of melanoma, we examined mutual exclusivity and co-occurrence of genomic alterations in 495 stage II/III primary melanomas across 11 cancer pathways. Somatic mutation and copy number alterations were analyzed from next-generation sequencing using a clinical sequencing panel.
RESULTS
Mutations in the RTK-RAS pathway were observed in 81% of cases. Other frequently occurring pathways were TP53 (31%), Cell Cycle (30%), and PI3K (18%). These frequencies are generally lower than was observed in The Cancer Genome Atlas, where the specimens analyzed were predominantly obtained from metastases. Overall, 81% of the cases had at least one targetable mutation. The RTK-RAS pathway was the only pathway that demonstrated strong and statistically significant mutual exclusivity. However, this strong mutual exclusivity signal was evident only for the three common genes in the pathway (BRAF, NRAS, and NF1). Analysis of co-occurrence of different pathways exhibited no positive significant trends. However, interestingly, a high frequency of cases with none of these pathways represented was observed, 8.4% of cases versus 4.0% expected (P < .001). A higher frequency of RTK-RAS singletons (with no other pathway alteration) was observed compared with The Cancer Genome Atlas. Clonality analyses suggest strongly that both the cell cycle and RTK-RAS pathways represent early events in melanogenesis.
CONCLUSION
Our results confirm the dominance of mutations in the RTK-RAS pathway. The presence of many mutations in several well-known, actionable pathways suggests potential avenues for targeted therapy in these early-stage cases.
INTRODUCTION
The pattern and timing of relapse in patients with stage II/III melanoma can be highly variable.1,2 The genetic heterogeneity of the tumor may underlie this variability in clinical behavior and treatment response. The Cancer Genome Atlas (TCGA) defined four mutational subtypes, defined by the presence of mutations in the driver genes BRAF, NRAS, and NF1, with the term triple wild type characterizing tumors without mutations in any of these genes. These three genes belong to the RTK-RAS-MAPK pathway (hereafter referred to as RTK-RAS for brevity) and are almost always mutually exclusive in melanomas.3 Shoushtari et al4 later refined this classification into nine MAPK driver groups.
CONTEXT
Key Objective
Knowledge of the genomic architecture of melanomas is largely derived from The Cancer Genome Atlas, a data set based primarily on the profiling of metastases. We use the resources of the InterMEL study, the goal of which was to examine the genomic architecture of early-stage primary melanoma samples, to investigate known cancer pathways, focusing specifically on mutual exclusivity of genes, a phenomenon that provides strong evidence of the role of the genes in tumor development.
Knowledge Generated
The results confirm the dominance of the RTK-RAS pathway. Alterations in this pathway are substantially more frequent than the other pathways and demonstrate strong mutual exclusivity. The results also show that 81% of these early-stage melanomas possess at least one targetable mutation but that more cases than expected had no mutations in any of the pathways examined.
Relevance
The results provide a framework for examining the potential for targeted therapy in early-stage melanoma.
Targeted BRAF and MEK inhibitors have proven efficacious for BRAF-mutant melanoma5-8 and are approved for adjuvant therapy for resected stage III disease.9 Immune checkpoint inhibitors, given as monotherapy or in combination, are now first-line treatments for non-BRAF–mutant melanomas in the adjuvant setting.10 However, challenges remain with current systemic therapies. For patients receiving BRAF/MEK inhibitors, most relapse after 6-9 months after developing drug resistance.11,12 In addition, approximately 50% of stage III patients treated with BRAF/MEK inhibitors will relapse at 5 years.9 Furthermore, 40%-60% of patients with melanoma have de novo or acquired resistance to immunotherapy leading to disease progression.13,14 New targets and strategies to overcome treatment resistance are needed. In tumors where no effective targeted treatments are yet available, alternative targets are needed. Examining co-occurring pathway alterations may provide insight into these directions.
Here, we report the frequency and pattern of alteration of 11 oncogenic signaling pathways in the InterMEL cohort, a large epidemiological series of stage II/III melanomas. Our analysis is designed to provide insights into developing approaches to guide surveillance and treatment decision making in early-stage melanoma. We focus primarily on mutual exclusivity, a well-known phenomenon among genes functionally linked within a biological pathway.15 Genes that are mutated in a mutually exclusive way within a pathway are expected to affect the same downstream effectors. The aberration of one gene is sufficient to functionally disrupt the pathway and thus eliminates the selective pressure for alteration of the others. The primary genes in the RTK/RAS pathway (BRAF, NRAS, and NF1) have long been known to occur in a mutually exclusive way, but there has been little attention to other pathways in the context of melanogenesis.
METHODS
The InterMEL Cohort
The InterMEL collaboration was created with the primary goal of investigating the genomic landscape of clinically localized primary melanomas. The tumors were sampled from various hospitals or treatment centers in the United States and Australia on the basis of the availability of tumor tissue in the pathology archives. Eligible tumors included primary cutaneous melanomas diagnosed on or after January 1, 1998, and before January 1, 2016, within stages IIA-IIID, restaged according to the American Joint Committee on Cancer, 8th edition.1 These dates were chosen to restrict the sample to tumors that were not treated with modern immunotherapies and thus represent the natural history of the disease in the absence of systemic treatment. The stages selected comprise tumors with a substantial probability of ultimately leading to relapse and death from melanoma. For this reason, cases with stage I melanomas were excluded. Tumors thus were at least 1.05-mm thick with sufficient tissue available to ensure the number of slides necessary for nucleic acid extraction. The patient must not have received adjuvant immunotherapy or targeted therapy before progression. Tumors from patients who ultimately died within 5 years were oversampled in an effort to seek an approximately equal number of cases who died versus those who survived 5 years without a relapse. In fact in the data presented herein, we have analyzed 219 tumors (44%) from patients who died within 5 years and 276 tumors from those who survived 5 years without a relapse. Nucleic acid was extracted in the form of DNA and RNA for three distinct omics panels: targeted panel DNA sequencing to detect mutations, DNA methylation profiling, and miRNA profiling. The current analyses are based on the 495 tumors with complete annotation of somatic mutation and copy number identified and analyzed to date. To identify somatic mutations, we used the targeted panel created at Memorial Sloan Kettering Cancer Center (MSK-IMPACT).16 MSK-IMPACT is an US Food and Drug Administration–approved hybridization capture-based next-generation sequencing panel capable of detecting all protein-coding mutations, copy number alterations, and selected promoter mutations and structural rearrangements in 468 cancer-associated genes. Further details of the InterMEL study are provided in the study by Luo et al.17 As a benchmark to our primarily descriptive results in these early-stage melanomas, we provide some comparative results from TCGA, by far the most prominent source of genomically studied tumors. However, TCGA is a very different source of tissue in that 80% of TCGA tumors were metastatic specimens while InterMEL involves entirely primaries. The sex distributions of the two populations are identical (62% female) although InterMEL cases were somewhat older at diagnosis (mean age 64 v 57 years for TCGA). To ensure meaningful benchmarking, we note that pathway frequencies we report from TCGA are limited to genes present in the MSK-IMPACT panel.
Definition of Pathway Alterations
We annotated somatic alterations in 10 oncogenic signaling pathways: RTK-RAS, p53, Cell Cycle, PI-3-Kinase/Akt, Hippo, Myc, Notch, Nrf2, TGF-β signaling, -catenin/Wnt.18 We additionally included the homologous recombination deficiency (HRD) pathway using the OncoKB19 annotation. Pathway alteration status was classified by either an activating event (including hotspot mutations or high-level focal amplifications) or an inactivating event (including loss-of-function mutations or homozygous deletions) in a pathway gene. Predicted functional events on the basis of computational approaches were also included.20 To determine the clonality of each mutation, we estimated the cancer cell fraction on the basis of the variant allele frequency, local copy number states, and tumor purity as previously described.21,22 Clonality of copy number alterations was estimated using the FACETS algorithm.21 We emphasize that the genes evaluated in these pathways are necessarily limited to those contained on the 468-gene MSK-IMPACT panel.
Mutual Exclusivity of Genes in a Pathway and Co-Occurrence of Pathways
To assess the degree of mutual exclusivity of genes in a pathway, we enumerate the number of cases where there is a solitary pathway mutation (denoted singletons herewith) and compare this with its expected value under the assumption that mutations occur independently. Excess mutual exclusivity implies that a single-pathway mutation enhances tumor growth and thus limits the opportunity time for additional pathway mutations to occur.15
Let be the total number of cases in the dataset, and let be the number of cases in the sample that are in the given pathway, that is, cases which have a mutation in at least one pathway gene, and let be the observed number of singletons. Suppose that there are g genes in the pathway. Let be the set of probabilities of mutations of the genes in the pathway, with empirical estimates determined from the empirical relative frequencies of the genes, where denotes the set of frequencies of occurrence of mutations in each gene. Then, the expected number of singletons is where A formal test for mutual exclusivity can be obtained using the z score .
To gauge the extent of mutual exclusivity, we have used the measure This captures the proportion of those cases expected to harbor more than one pathway alteration that are actually singletons and thus ranges from 0 (anticipated mutual exclusivity) to a maximum of 1. By calculating this term for different subsets of selected genes in the pathway, we can evaluate the subset that appears to exhibit mutual exclusivity most strongly.
For evaluating the relation of different pathways, we focused on co-occurrence, on the premise that if joint deactivation of specific pathways is important in melanogenesis there will be selective pressure in favor of co-occurrence. In these analyses, we focused on pairs of pathways. Thus to test co-occurrence of pathways i and j, we enumerated the number of cases represented by both pathways, comparing this with its expected value where is the proportion of cases in which mutations in pathway i occurred. Again, a statistical test can be constructed using the corresponding z score.
The pathway co-occurrence strategy was expanded to test the significance of an observed exclusive negative grouping, representing cases that have no mutations in any pathway. Here, the expected number of cases that are exclusive negative is given by: where is the number of pathways. To visualize the pattern of co-occurrence, a hierarchical clustering was performed on the pathway level data to sort tumors into subgroups on the basis of the co-occurrent pattern.
RESULTS
Pathway Alteration Frequency in Early-Stage Melanoma
Overall, the RTK-RAS pathway is the most frequently altered pathway, present in 81% of the InterMEL tumors (Fig 1A). The average cancer cell fractions of the RTK-RAS and Cell Cycle pathway alterations are close to 1 indicating mostly clonal events in these tumors (Fig 1B), consistent with the notion that RTK-RAS and Cell Cycle alterations are early drivers in tumor evolution (Appendix Table A1).23
FIG 1.
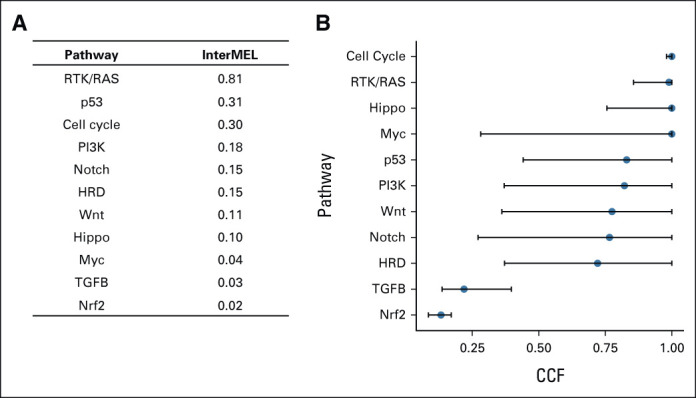
Oncogenic signaling pathway alteration in 495 stage II/III melanoma samples. (A) Pathway alteration frequency in the InterMEL cohort. (B) Pathway gene clonality. Median (blue dot) along with IQR (black line) of the estimated CCF across gene alterations within each pathway are plotted. CCF close to 1 indicates clonal events. CCF, cancer cell fraction; IQR, interquartile range.
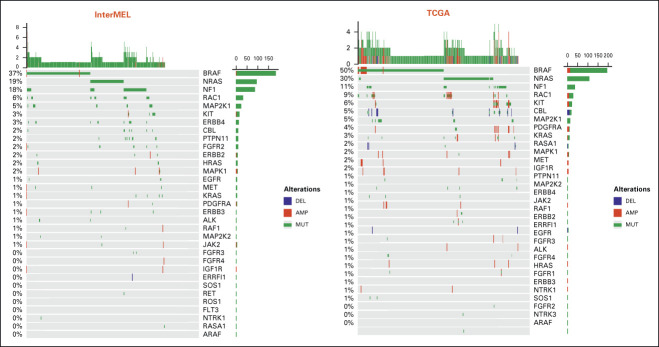
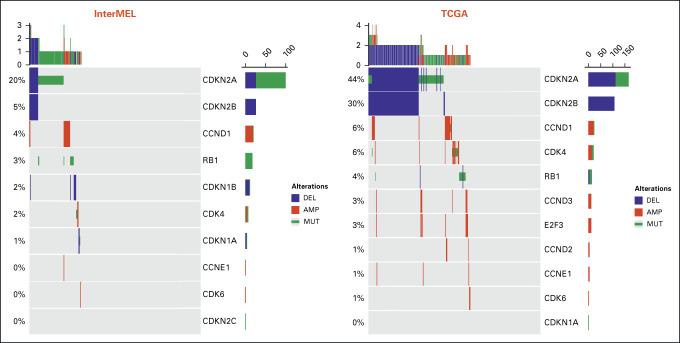
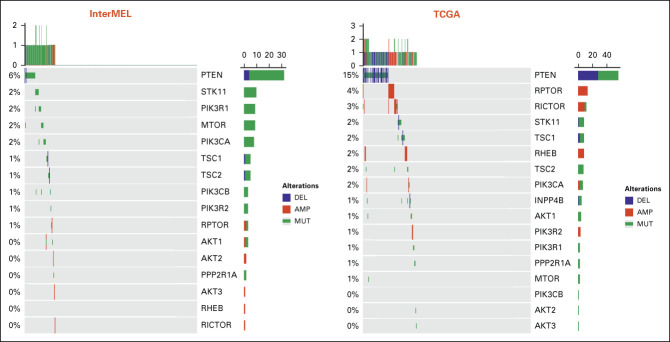
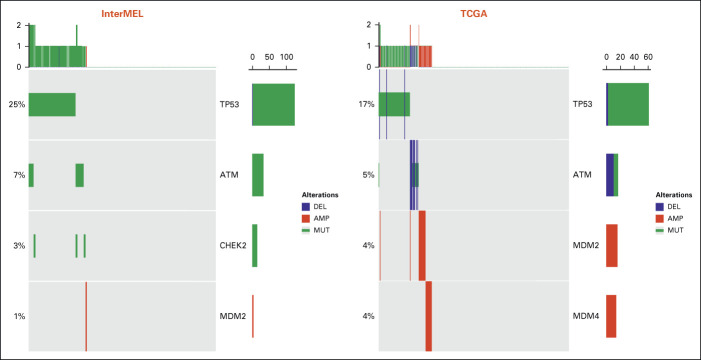
Comparisons of pathway frequencies with the benchmark TCGA data highlight large differences between early-stage primaries and metastatic specimens. The RTK-RAS pathway alteration is lower in InterMEL compared with TCGA (81% v 93%), primarily reflecting the lower frequencies of oncogenic mutations in BRAF and NRAS (Appendix Fig A1). The Cell Cycle pathway is altered in the InterMEL tumors at 30%, a much lower frequency than the 59% in TCGA. The difference lies mainly in the lower frequency of alterations in the CDKN2A gene (Appendix Fig A2). The PI3K pathway is altered in InterMEL tumors at 18% versus 32% in TCGA, with the primary difference attributable to PTEN (Appendix Fig A3). The less frequent alterations in CDKN2A and PTEN genes in InterMEL are consistent with the notion that these two genes are associated with more advanced disease.23,24 Alteration frequency of the p53 pathway is similar between the two cohorts (Appendix Fig A4).
Mutual Exclusivity of Genes in Pathways
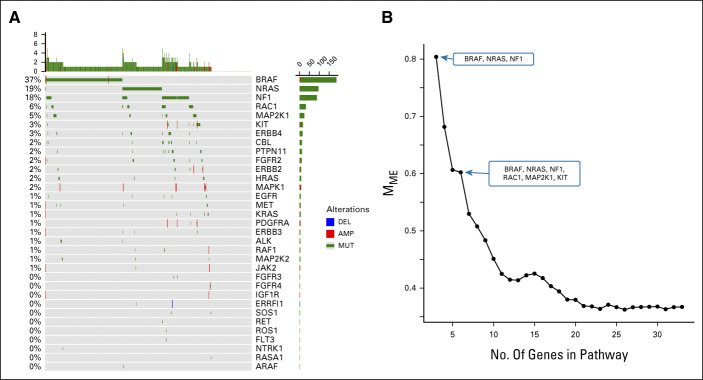
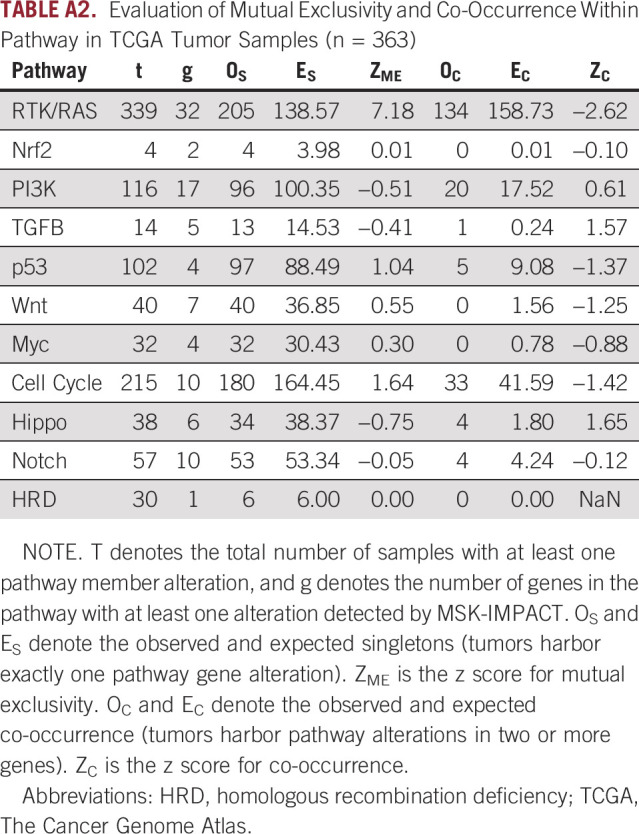
Table 1 shows results on mutual exclusivity for each of the pathways. The RTK-RAS pathway has a total of 273 observed singletons which far exceeds the expected number of 200, a highly significant result (P < .001, see Fig 2A). The strong mutual exclusivity is similarly observed in TCGA melanoma sample cohort, with 205 observed singletons versus 139 expected (P < .001). However, none of the other pathways showed statistical evidence of mutual exclusivity (Appendix Table A2).
TABLE 1.
Evaluation of Mutual Exclusivity and Co-Occurrence Within Pathway in InterMEL Tumor Samples (n = 495)
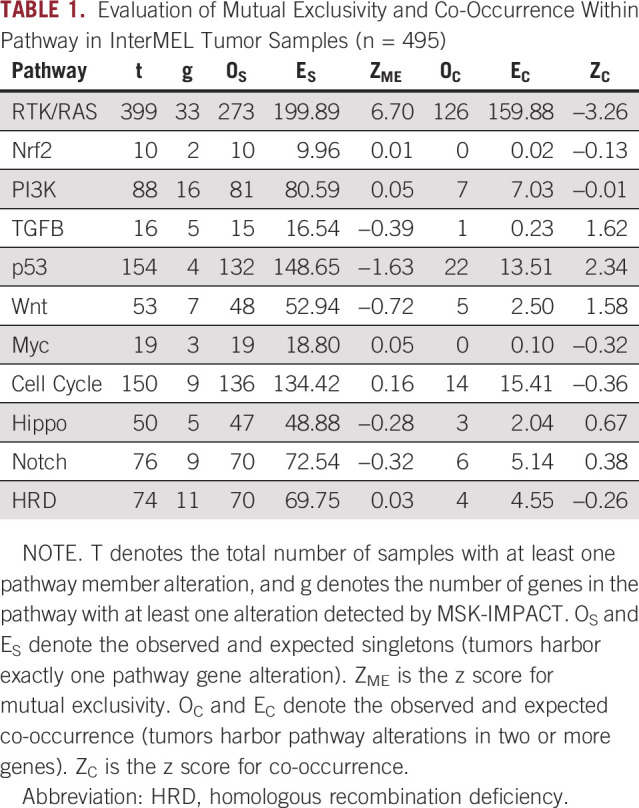
FIG 2.
Patterns of alteration within the RTK-RAS pathway. (A) Oncoprint plot of the RTK-RAS pathway alterations displays the pattern of mutual exclusivity. (B) Decreasing trend of mutual exclusivity as genes are sequentially added in the pathway by their alteration frequency.
As described in Methods, the measure Mme captures the proportion of cases expected to harbor more than one pathway alteration that are actually singletons. In the RTK-RAS pathway, the three most frequently mutated genes, BRAF, NRAS, and NF1 together display 80% mutual exclusivity by this measure (Fig 2B). However, the Mme score shows a rapid decreasing trend as additional genes are included.
Co-Occurrence of Different Pathways
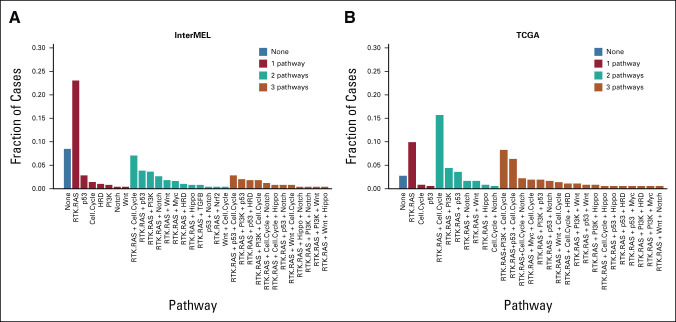
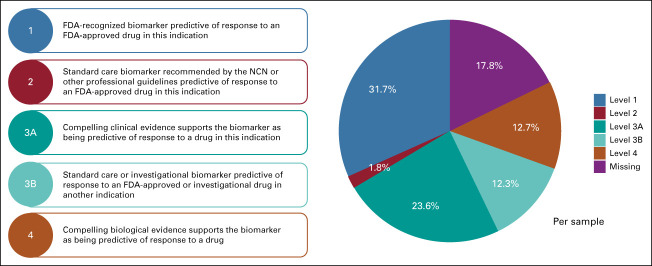
The identification of co-occurrent pathways may further generate insights on paths of carcinogenesis and potentially inform more tailored and effective therapeutic strategies that cotarget multiple pathway alterations in a tumor. Among the 453 cases with at least one pathway alteration, 33.1% of the cases are singletons having exactly one pathway altered (the majority of which are RTK-RAS singletons), 28.3% having two pathways altered (most frequently RTK-RAS and Cell Cycle), and 18.3% harbor three concurrent pathways (Fig 3A). We used the OncoKB algorithm to stratify potentially actionable genomic events into one of four levels on the basis of published clinical or laboratory evidence that the alteration confers increased sensitivity to standard or investigational therapies.19 Overall, 82% of the cases have at least one targetable alteration identified from the clinical sequencing panel (Appendix Fig A5).
FIG 3.
Pathway co-occurrence. (A) Fractions of InterMEL tumors (n = 495) that involve no pathways, one pathway, two pathways, or three pathways. (B) Fractions of TCGA tumors (n = 363) that involve no pathways, one pathway, two pathways, or three pathways. Note that the category (none) represents the exclusive negative cases where none of the 11 pathways are represented. TCGA, The Cancer Genome Atlas.
Interestingly, a total of 8.4% (n = 42) of the cohort have no mutations in any pathway. We refer to this as an exclusive negative group. The size of this exclusive negative group significantly exceeds its expectation (n = 42 v an expected value of 20, P < .001). In addition, Figure 3A shows that the preponderance of cases in which only a single pathway is represented involve the RTK-RAS pathway. Furthermore, these single pathway cases are much less frequent in TCGA (Fig 3B). In general, a higher fraction of tumors with multiple pathways altered are observed in TCGA (Fig 3B, Appendix Fig A6).
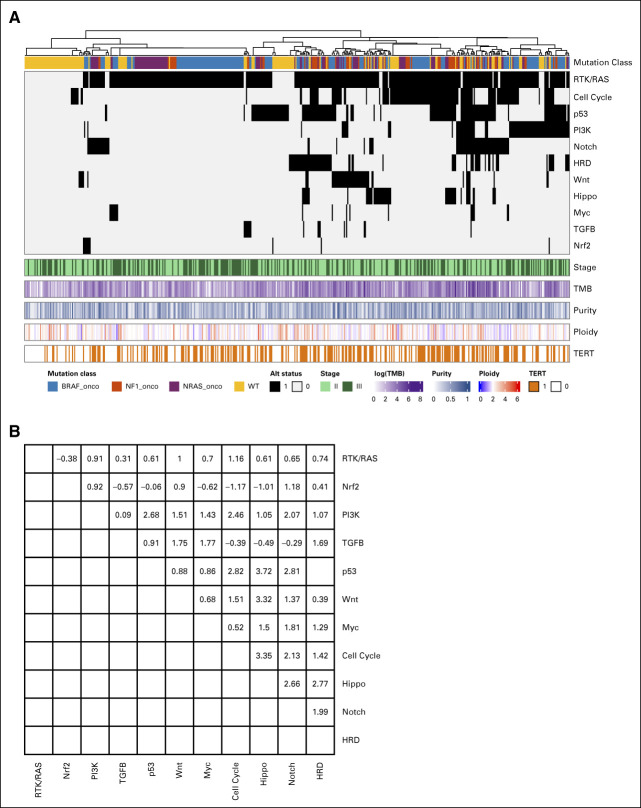
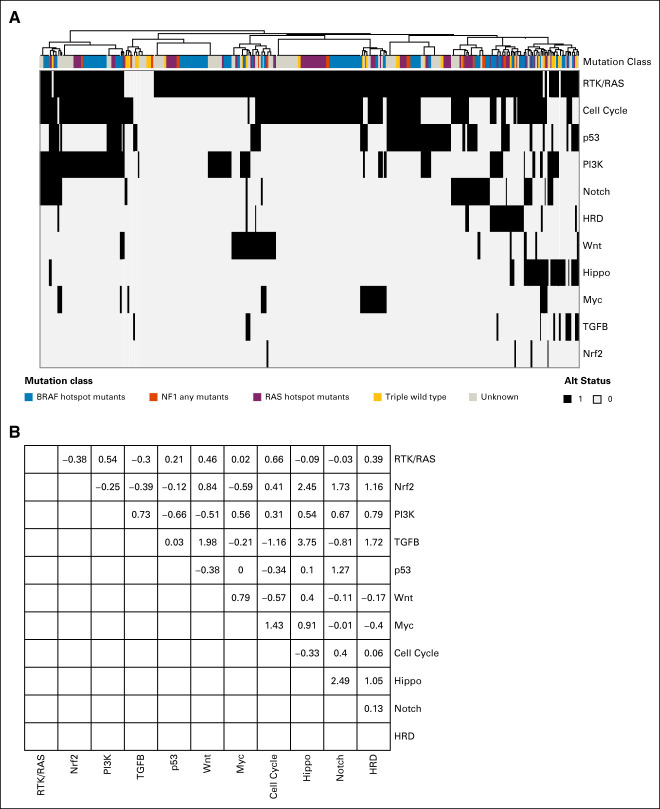
A hierarchical clustering analysis was used to visualize the co-occurrence pattern of the pathways (Fig 4A). All of the exclusive negative cases are sorted to the left, which contains exclusively cases that are not in the RTK/RAS pathway. Figure 4B shows statistical tests of pairwise pathway co-occurrences. Although a few of the pairs are nominally statistically significant for co-occurrence, none of the tests is significant after adjusting for multiple testing. Note the co-occurrence analysis of p53 and HRD pathways was not shown since they contain overlapping genes (ATM and CHEK2) which will introduce bias.
FIG 4.
Co-occurrence patterns across the pathways. (A) Tumors are sorted by hierarchical clustering of the 11 pathway alteration status. Mutation class denotes the oncogenic mutation status of BRAF, NF1, NRAS, and the triple wild type (yellow). Stage, TMB, tumor ploidy, organ recurrence, and 5-year survival are annotated. (B) Pairwise co-occurrence z score. TMB, total mutation burden.
Survival Comparisons
Sampling of tumors for InterMEL was designed to provide approximately equal numbers of cases who died of melanoma within 5 years versus those who survived without evidence of recurrence for at least 5 years (controls). Comparison of cases versus controls thus sheds light onto pathways that predict clinical outcome. Figure 5 displays these survival comparisons for the individual pathways. Only one of these comparisons is statistically significant (improved survival for cases with mutations in the HRD pathway). However, this is one of numerous comparisons and relatively few tumors had alterations in the HRD pathway, so the result is far from conclusive. At the individual gene level, we observed that PTEN is altered in 9.6% of cases who died versus 4% of controls. CDKN2A alterations were slightly but not significantly elevated in the cases who dies (24% v 20%).
FIG 5.
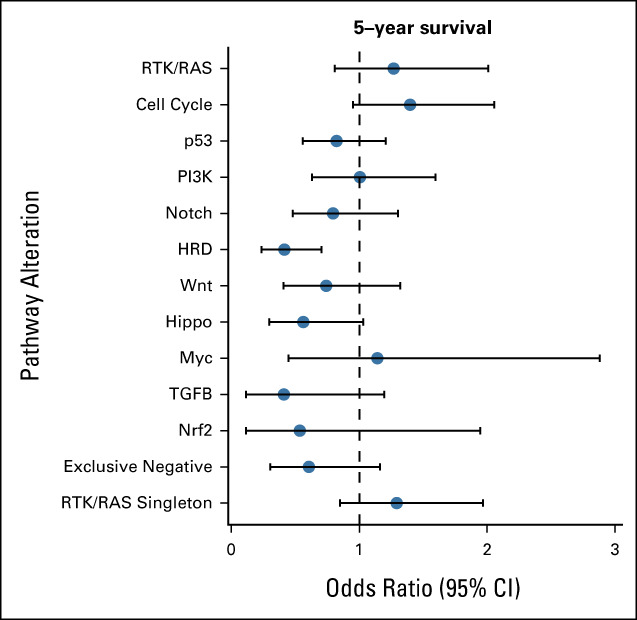
Pathway association with 5-year survival status. Forest plot of odds ratio along with 95% CI is presented.
DISCUSSION
The influential TCGA studies have provided a rich resource to define the mutational landscape of most types of cancer. However, the examination of melanoma in TCGA focused on largely metastatic specimens. This was done because of the need for large quantities of DNA to accomplish the multiomic investigations planned. The InterMEL study was created with the specific goal of filling in the knowledge gap regarding the genomic profiles of primary melanomas, notably in those early stages without evidence of metastases. This population, represented by stages II/III, is one for which the chances of recurrence are relatively high and thus the option of adjuvant treatment is a viable one.
Our examination of the major pathways has generally demonstrated that these are somewhat less frequently occurring in this population than in the more advanced (and primarily metastatic) cases represented by TCGA, a finding that is not surprising since tumors gradually acquire mutations as they evolve. Our detailed analysis of mutual exclusivity demonstrates very strong mutual exclusivity of BRAF, NRAS, and NF1 mutations in the RTK-RAS pathway, as has been observed in several other large-scale sequencing studies including TCGA,3,4 but no convincing evidence of such mutual exclusivity in the other pathways. A future study with expanded cohort size may be needed to investigate more conclusively rare genomic events within a pathway.
A different framework for inferring the pathogenicity of the pathways is clonality. Our clonality analysis (Fig 1B) demonstrates highly distinctive patterns, with some pathways clearly occurring early in the disease process (eg, Cell Cycle and RTK/RAS), some occurring very late in the process (Nrf2 and TGFβ) and others spanning these two extremes. One could speculate that the clonal alterations are likely to be more amenable to targeted therapies, and multiagent approaches may be viable in cases with > 1 actionable mutations observed with high levels of clonality. Although for the majority of melanomas, resistance to BRAF/MEK inhibition is through reactivation of the RTK/RAS pathway,25 for some it is not.26 Prospectively identifying alternative oncogenic pathways and pathway nodes of intersection could provide novel targets and potential for further personalizing therapeutic approaches.
An interesting observation is the unexpectedly high frequency of cases with no representation of alterations in any of these pathways. A possible, indeed likely explanation is that our study did not address all of the pathways that are truly relevant and that this elevated frequency of the exclusively negative group is caused by the absence of data from these missing pathways. Furthermore, the integration of epigenome or transcriptome may provide information on the molecular alterations that define these cases and inform therapeutic targets.
In summary, our study has provided a view of the pathway alteration landscape in early-stage melanoma. The results provide insights into the major cancer pathways represented in this disease and into features that support their relevance as drivers of melanogenesis via analyses of mutual exclusivity within pathways, co-occurrence of distinct pathways, and clonality.
APPENDIX
FIG A1.
Oncoprint plot of the RTK-RAS pathway in the InterMEL cohort (n = 495) v in the TCGA (n = 363) cohort. The TCGA analysis was restricted to the MSK-IMPACT genes and using the same oncogenic mutation annotation. TCGA, The Cancer Genome Atlas.
FIG A2.
Oncoprint plot of the Cell Cycle pathway in the InterMEL cohort (n = 495) v in the TCGA (n = 363) cohort. The TCGA analysis was restricted to the MSK-IMPACT genes and using the same oncogenic mutation annotation. TCGA, The Cancer Genome Atlas.
FIG A3.
Oncoprint plot of the PI3K pathway in the InterMEL cohort (n = 495) v in the TCGA (n = 363) cohort. The TCGA analysis was restricted to the MSK-IMPACT genes and using the same oncogenic mutation annotation. TCGA, The Cancer Genome Atlas.
FIG A4.
Oncoprint plot of the p53 pathway in the InterMEL cohort (n = 495) v in the TCGA (n = 363) cohort. The TCGA analysis was restricted to the MSK-IMPACT genes and using the same oncogenic mutation annotation. TCGA, The Cancer Genome Atlas.
FIG A5.
OncoKB annotation of targetable alterations in the InterMEL cases. FDA, US Food and Drug Administration.
FIG A6.
Co-occurrence patterns across the pathways in TCGA (n = 363). (A) Tumors are sorted by hierarchical clustering of the 11 pathway alteration status. Mutation class denotes the oncogenic mutation status of BRAF, NF1, NRAS, and the triple wild type (yellow). (B) Pairwise co-occurrence z score. TCGA, The Cancer Genome Atlas.
TABLE A1.
Comparing Alteration Frequency of the 11 Pathways in the InterMEL Cohort (n = 495) v in the TCGA (n = 363) Cohort
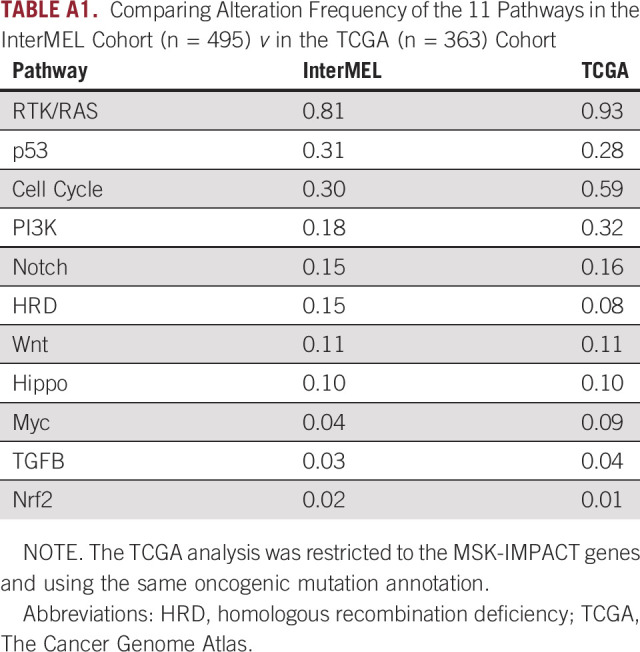
TABLE A2.
Evaluation of Mutual Exclusivity and Co-Occurrence Within Pathway in TCGA Tumor Samples (n = 363)
Caroline E. Kostrzewa
Stock and Other Ownership Interests: Johnson & Johnson/Janssen
Arshi Arora
Employment: Incyte
Marc S. Ernstoff
Stock and Other Ownership Interests: GE Healthcare, Johnson & Johnson/Janssen, Becton Dickinson, Abbott Laboratories, AbbVie
Klaus Busam
Consulting or Advisory Role: Dermtech
Patents, Royalties, Other Intellectual Property: Royalties for textbook published by Elsevier
Irene Orlow
Leadership: Tolstoy Foundation Rehabilitation and Nursing Center, Inc
No other potential conflicts of interest were reported.
SUPPORT
Supported by the National Cancer Institute at the National Institutes of Health (Grant numbers P01CA206980, R01CA251339), Memorial Sloan Kettering Cancer Center (Grant number P30 CA008748), The University of New Mexico Comprehensive Cancer Center (Grant number NCI 5P30CA118100-15), The UNC Lineberger Comprehensive Cancer Center (Grant number NCI P30CA016086).
AUTHOR CONTRIBUTIONS
Conception and design: Nancy E. Thomas, Marianne Berwick, Colin B. Begg, Ronglai Shen
Financial support: Nancy E. Thomas, Marianne Berwick, Colin B. Begg, Ronglai Shen
Administrative support: Nancy E. Thomas, Marianne Berwick
Provision of study materials or patients: Nancy E. Thomas, Marianne Berwick
Collection and assembly of data: Li Luo, Arshi Arora, Sharon N. Edmiston, Klaus Busam, Irene Orlow, Nancy E. Thomas, Marianne Berwick, Ronglai Shen
Data analysis and interpretation: Caroline E. Kostrzewa, Arshi Arora, Venkatraman E. Seshan, Marc S. Ernstoff, Sharon N. Edmiston, Kathleen Conway, Ivan Gorlov, Klaus Busam, Eva Hernando, Nancy E. Thomas, Colin B. Begg, Ronglai Shen
Manuscript writing: All authors
Final approval of manuscript: All authors
Accountable for all aspects of the work: All authors
AUTHORS' DISCLOSURES OF POTENTIAL CONFLICTS OF INTEREST
The following represents disclosure information provided by authors of this manuscript. All relationships are considered compensated unless otherwise noted. Relationships are self-held unless noted. I = Immediate Family Member, Inst = My Institution. Relationships may not relate to the subject matter of this manuscript. For more information about ASCO's conflict of interest policy, please refer to www.asco.org/rwc or ascopubs.org/po/author-center.
Open Payments is a public database containing information reported by companies about payments made to US-licensed physicians (Open Payments).
Caroline E. Kostrzewa
Stock and Other Ownership Interests: Johnson & Johnson/Janssen
Arshi Arora
Employment: Incyte
Marc S. Ernstoff
Stock and Other Ownership Interests: GE Healthcare, Johnson & Johnson/Janssen, Becton Dickinson, Abbott Laboratories, AbbVie
Klaus Busam
Consulting or Advisory Role: Dermtech
Patents, Royalties, Other Intellectual Property: Royalties for textbook published by Elsevier
Irene Orlow
Leadership: Tolstoy Foundation Rehabilitation and Nursing Center, Inc
No other potential conflicts of interest were reported.
REFERENCES
- 1. Romano E, Scordo M, Dusza SW, et al. Site and timing of first relapse in stage III melanoma patients: Implications for follow-up guidelines. J Clin Oncol. 2010;28:3042–3047. doi: 10.1200/JCO.2009.26.2063. [DOI] [PMC free article] [PubMed] [Google Scholar]
- 2. Lee AY, Droppelmann N, Panageas KS, et al. Patterns and timing of initial relapse in pathologic stage II melanoma patients. Ann Surg Oncol. 2017;24:939–946. doi: 10.1245/s10434-016-5642-0. [DOI] [PMC free article] [PubMed] [Google Scholar]
- 3. The Cancer Genome Atlas Network Genomic classification of cutaneous melanoma. Cell. 2015;161:1681–1696. doi: 10.1016/j.cell.2015.05.044. [DOI] [PMC free article] [PubMed] [Google Scholar]
- 4. Shoushtari AN, Chatila WK, Arora A, et al. Therapeutic implications of detecting MAPK-activating alterations in cutaneous and unknown primary melanomas. Clin Cancer Res. 2021;27:2226–2235. doi: 10.1158/1078-0432.CCR-20-4189. [DOI] [PMC free article] [PubMed] [Google Scholar]
- 5. Chapman PB, Hauschild A, Robert C, et al. Improved survival with vemurafenib in melanoma with BRAF V600E mutation. N Engl J Med. 2011;364:2507–2516. doi: 10.1056/NEJMoa1103782. [DOI] [PMC free article] [PubMed] [Google Scholar]
- 6. Sosman JA, Kim KB, Schuchter L, et al. Survival in BRAF V600-mutant advanced melanoma treated with vemurafenib. N Engl J Med. 2012;366:707–714. doi: 10.1056/NEJMoa1112302. [DOI] [PMC free article] [PubMed] [Google Scholar]
- 7. Flaherty KT, Puzanov I, Kim KB, et al. Inhibition of mutated, activated BRAF in metastatic melanoma. N Engl J Med. 2010;363:809–819. doi: 10.1056/NEJMoa1002011. [DOI] [PMC free article] [PubMed] [Google Scholar]
- 8. Hauschild A, Grob JJ, Demidov LV, et al. Dabrafenib in BRAF-mutated metastatic melanoma: A multicentre, open-label, phase 3 randomised controlled trial. Lancet. 2012;380:358–365. doi: 10.1016/S0140-6736(12)60868-X. [DOI] [PubMed] [Google Scholar]
- 9. Dummer R, Hauschild A, Santinami M, et al. Five-year analysis of adjuvant dabrafenib plus trametinib in stage III melanoma. N Engl J Med. 2020;383:1139–1148. doi: 10.1056/NEJMoa2005493. [DOI] [PubMed] [Google Scholar]
- 10. Seth R, Messersmith H, Kaur V, et al. Systemic therapy for melanoma: ASCO guideline. J Clin Oncol. 2020;38:3947–3970. doi: 10.1200/JCO.20.00198. [DOI] [PubMed] [Google Scholar]
- 11. Trunzer K, Pavlick AC, Schuchter L, et al. Pharmacodynamic effects and mechanisms of resistance to vemurafenib in patients with metastatic melanoma. J Clin Oncol. 2013;31:1767–1774. doi: 10.1200/JCO.2012.44.7888. [DOI] [PubMed] [Google Scholar]
- 12. Flaherty KT, Infante JR, Daud A, et al. Combined BRAF and MEK inhibition in melanoma with BRAF V600 mutations. N Engl J Med. 2012;367:1694–1703. doi: 10.1056/NEJMoa1210093. [DOI] [PMC free article] [PubMed] [Google Scholar]
- 13. Larkin J, Minor D, D'Angelo S, et al. Overall survival in patients with advanced melanoma who received nivolumab versus investigator's choice chemotherapy in CheckMate 037: A randomized, controlled, open-label phase III trial. J Clin Oncol. 2018;36:383–390. doi: 10.1200/JCO.2016.71.8023. [DOI] [PMC free article] [PubMed] [Google Scholar]
- 14. Wolchok JD, Chiarion-Sileni V, Gonzalez R, et al. Overall survival with combined nivolumab and ipilimumab in advanced melanoma. N Engl J Med. 2017;377:1345–1356. doi: 10.1056/NEJMoa1709684. [DOI] [PMC free article] [PubMed] [Google Scholar]
- 15. Ciriello G, Cerami E, Sander C, et al. Mutual exclusivity analysis identifies oncogenic network modules. Genome Res. 2012;22:398–406. doi: 10.1101/gr.125567.111. [DOI] [PMC free article] [PubMed] [Google Scholar]
- 16. Cheng DT, Mitchell TN, Zehir A, et al. Memorial Sloan Kettering-Integrated Mutation Profiling of Actionable Cancer Targets (MSK-IMPACT): A hybridization capture-based next-generation sequencing clinical assay for solid tumor molecular oncology. J Mol Diagn. 2015;17:251–264. doi: 10.1016/j.jmoldx.2014.12.006. [DOI] [PMC free article] [PubMed] [Google Scholar]
- 17. Luo L, Shen R, Arora A, et al. Landscape of mutations in early stage primary cutaneous melanoma: An InterMEL study. Pigment Cell Melanoma Res. 2022;35:605–612. doi: 10.1111/pcmr.13058. [DOI] [PMC free article] [PubMed] [Google Scholar]
- 18. Sanchez-Vega F, Mina M, Armenia J, et al. Oncogenic signaling pathways in The Cancer Genome Atlas. Cell. 2018;173:321–337.e10. doi: 10.1016/j.cell.2018.03.035. [DOI] [PMC free article] [PubMed] [Google Scholar]
- 19. Chakravarty D, Gao J, Phillips SM, et al. OncoKB: A precision oncology knowledge base. JCO Precis Oncol. 2017 doi: 10.1200/PO.17.00011. 10.1200/PO.17.00011 [DOI] [PMC free article] [PubMed] [Google Scholar]
- 20. Chang MT, Asthana S, Gao SP, et al. Identifying recurrent mutations in cancer reveals widespread lineage diversity and mutational specificity. Nat Biotechnol. 2016;34:155–163. doi: 10.1038/nbt.3391. [DOI] [PMC free article] [PubMed] [Google Scholar]
- 21. Shen R, Seshan VE. FACETS: Allele-specific copy number and clonal heterogeneity analysis tool for high-throughput DNA sequencing. Nucleic Acids Res. 2016;44:e131. doi: 10.1093/nar/gkw520. [DOI] [PMC free article] [PubMed] [Google Scholar]
- 22. Razavi P, Li BT, Brown DN, et al. High-intensity sequencing reveals the sources of plasma circulating cell-free DNA variants. Nat Med. 2019;25:1928–1937. doi: 10.1038/s41591-019-0652-7. [DOI] [PMC free article] [PubMed] [Google Scholar]
- 23. Shain AH, Yeh I, Kovalyshyn I, et al. The genetic evolution of melanoma from precursor lesions. N Engl J Med. 2015;373:1926–1936. doi: 10.1056/NEJMoa1502583. [DOI] [PubMed] [Google Scholar]
- 24. Harbst K, Lauss M, Cirenajwis H, et al. Multiregion whole-exome sequencing uncovers the genetic evolution and mutational heterogeneity of early-stage metastatic melanoma. Cancer Res. 2016;76:4765–4774. doi: 10.1158/0008-5472.CAN-15-3476. [DOI] [PubMed] [Google Scholar]
- 25. Welsh SJ, Rizos H, Scolyer RA, et al. Resistance to combination BRAF and MEK inhibition in metastatic melanoma: Where to next? Eur J Cancer. 2016;62:76–85. doi: 10.1016/j.ejca.2016.04.005. [DOI] [PubMed] [Google Scholar]
- 26. Reddi KK, Guruvaiah P, Edwards YJK, et al. Changes in the transcriptome and chromatin landscape in BRAFi-resistant melanoma cells. Front Oncol. 2022;12:937831. doi: 10.3389/fonc.2022.937831. [DOI] [PMC free article] [PubMed] [Google Scholar]


