

Abstract
OBJECTIVE:
Although benzodiazepine misuse and use disorders are associated with adverse health effects, it is unknown what proportion of benzodiazepine users misuse them or meet criteria for benzodiazepine use disorders. The goal of this study was to examine the prevalence and correlates of benzodiazepine use, misuse, and use disorders among U.S. adults.
METHODS:
Data from 102,000 adults aged 18 and older who participated in the 2015–2016 National Surveys on Drug Use and Health (NSDUH). IMSHealth Total Patient Tracker data were also examined. Descriptive analyses and multinomial logistic regressions were applied.
RESULTS:
Among U.S. adults in 2015–2016, 12.5% (annual average, 95% CI=12.19%–12.81%) used benzodiazepines, 2.1% (95% CI=2.03%–2.25%) misused benzodiazepines at least once, and 0.2% (95% CI=0.15%–0.22%) had benzodiazepine use disorders. Among benzodiazepine users, 17.1% (95% CI=16.30%–17.93%) misused benzodiazepines, and 1.5% (95% CI=1.26%–1.72%) had benzodiazepine use disorders. Benzodiazepine use was associated with emergency room visits, suicidal ideation, use of most substances, and mental disorders. Benzodiazepine misuse without use disorders was associated with younger age, male sex, being black, poor educational attainment, being uninsured and unemployed, being single, having family income below $50,000, and having suicidal ideation and other specific substance use problems. Correlates of benzodiazepine use disorders were similar, but most correlates were associated with benzodiazepine use disorders more strongly than with misuse without use disorders.
CONCLUSION:
While benzodiazepine use is highly prevalent among U.S. adults, benzodiazepine use disorders are relatively rare among benzodiazepine users. Our results help characterize benzodiazepine users and identify adults at risk for misuse and use disorders.
INTRODUCTION
Benzodiazepines are often used for the short-term treatment of anxiety and insomnia.1–3 However, their management is complicated by: 1) their risk for misuse, often defined as using a psychotropic medication without a prescription, in greater amounts, more often, or longer than prescribed, or for a reason other than as directed by a doctor; 4, 5 and 2) their risk for the development of benzodiazepine use disorders.4, 6, 7 Benzodiazepine misuse and use disorders are associated with multiple adverse health effects,8, 9 including decreased motor coordination and traffic accidents,9, 10 overdose,11, 12 and premature mortality.13 They are also associated with increased prevalence of other substance use, mood and anxiety disorders.14, 15 These findings require clinicians and policy-makers to balance appropriate use of benzodiazepines with the need to minimize misuse.
Several studies have examined the prevalence and correlates of benzodiazepine misuse and use disorders.4, 7, 16 However, none has estimated the national prevalence of benzodiazepine use, examined whether correlates of use are similar to those of misuse and use disorders, or investigated motivations for benzodiazepine misuse in a national sample. Due to the lack of nationally representative data, it has not been possible to date to estimate what proportion of users meet criteria for misuse or use disorders and which users are at greatest risk for benzodiazepine misuse or use disorders. An important recent study provided the first estimates of benzodiazepine use in the U.S using data from IMS Health, describing the age and sex of benzodiazepine users.1 Because the study was based on pharmacy data, it could not examine other important sociodemographic characteristics, assess diagnostic information of users, or estimate the prevalence or correlates of misuse and use disorders among benzodiazepine users.
In this current study, we take advantage of a large nationally representative sample of U.S. adults to examine: 1) The prevalence and correlates of benzodiazepine use; 2) The prevalence and correlates of benzodiazepine misuse and use disorders among benzodiazepine users; and 3) The motivations for misuse and the source of benzodiazepines for the most recent misuse. This information has important implications for developing effective prevention and intervention strategies that improve the population’s health and reduce harms associated with benzodiazepine misuse.
METHODS
Study Population
We examined data from adults aged 18 or older who participated in the 2015–2016 National Surveys on Drug Use and Health (NSDUH), which was conducted by the Substance Abuse and Mental Health Services Administration. Starting in 2015, NSDUH collects information on benzodiazepine use, providing the first opportunity to obtain nationally representative data on benzodiazepine use, misuse, and motivations for benzodiazepine misuse among the U.S. civilian, noninstitutionalized population aged 12 or older.
NSDUH data collection was approved by the Institutional Review Board at RTI International. Oral informed consent was received from each study participant. Data were collected by interviewers in personal visits to households and non-institutional group quarters. through audio computer-assisted self-administered interviews. The annual average weighted response rate for the 2015–2016 NSDUH was 54.3 percent,17,18 Details regarding NSDUH methods are provided elsewhere.17
We also examined data from the IMSHealth Total Patient Tracker to assess the number of unique adults who were dispensed benzodiazepines in outpatient retail pharmacies in 2015.12 Examining both NSDUH and IMS data helped better understand the size of the U.S. adult population using benzodiazepines recently.
Measures
The 2015–2016 NSDUH collected information on benzodiazepines past-year use (including the use of one’s own prescription medication as directed by a doctor as well as misuse) as part of the tranquilizer assessment module (i.e., products containing alprazolam, lorazepam, clonazepam, and diazepam) and the sedatives assessment module (i.e., products containing flurazepam, temazepam, and triazolam). NSDUH assessed use and misuse of these specific benzodiazepines. NSDUH defined misuse as “in any way that a doctor did not direct you to use them, including (1) use without a prescription of the respondent’s own; (2) use in greater amounts, more often, or longer than the respondent was told to take them; or (3) use in any other way a doctor did not direct the respondent to use them.18”
NSDUH also asked past-year benzodiazepine misusers the name of the specific benzodiazepines misused during their most recent misuse. NSDUH then asked about the main motivation for misusing benzodiazepines during their most recent misuse: to relax or relieve tension; to experiment or to see what the drug is like; to feel good or get high; to help with sleep; to help with feelings or emotions; to increase or decrease effect(s) of other drug(s); because respondent is “hooked” or has to have it; or other reason.18 Furthermore, NSDUH collected the source of benzodiazepines obtained for their most recent misuse: given by a friend/relative for free; prescribed by physician(s); stolen from a friend/relative; bought from a friend/relative; bought from a drug dealer/stranger; or stolen from doctor’s office/clinic. If respondents reported that they were given by friends/relatives for free, NSDUH asked them where friends/relatives obtained the benzodiazepines.
NSDUH collected lifetime and past-year use of tobacco, alcohol, cannabis, cocaine, heroin, hallucinogens, and inhalants, as well as lifetime and past-year use and misuse of other psychotherapeutic medications (prescription opioids, tranquilizers, sedatives, and stimulants). Furthermore, NSDUH also collected past-year major depressive episode (MDE) and specific substance use disorders (i.e., alcohol, cannabis, cocaine, heroin, hallucinogens, inhalants, and psychotherapeutic medications) based on assessments of individual diagnostic criteria from the DSM-IV.19 Nicotine dependence among cigarette smokers was assessed using the Nicotine Dependence Syndrome Scale.20 These measures have good validity and reliability.21–23 We defined adults with benzodiazepine misuse but without tranquilizer/sedative use disorders as “adult benzodiazepine misusers without use disorders”. We defined those with past-year benzodiazepine use disorders as individuals who misused benzodiazepine-only tranquilizers in the past year and had prescription tranquilizer use disorders or who misused benzodiazepine-only sedatives in the past year and had prescription sedative use disorders.
The 2015 NSDUH asked all adult respondents about suicidality: “At any time during the past 12 months, did you seriously think about trying to kill yourself?” NSDUH also captured respondents’ self-rated health and the number of past-year emergency room (ER) visits. Additionally, NSDUH collected sociodemographic characteristics, including age, sex, race/ethnicity, educational attainment, employment status, family income, marital status, health insurance status, metropolitan statistical area, and census region.
Statistical Analyses
First, we estimated the annual average prevalence of benzodiazepines use, non-use, misuse, and use disorders among adults in 2015–2016 by each of the sociodemographic and behavioral health characteristics described previously. Second, bivariable multinomial logistic regression models were applied to examine sociodemographic and behavioral health characteristics (1) distinguishing adults with benzodiazepine use from adults without benzodiazepine use (non-use) and (2) distinguishing adult benzodiazepine users without misuse, adult benzodiazepine misusers without use disorders, and adult benzodiazepine misusers with benzodiazepine use disorders. As a sensitivity analysis, we repeated these procedures including adults who reported any misuse of benzodiazepines (i.e. regardless whether they misused other tranquilizers/sedatives) in the past year and had past-year tranquilizer use disorders or sedative use disorders. These results, which are similar to those presented here, are available on request.
Third, among past-year adult benzodiazepine misusers in the U.S., we estimated the main motivations for the most recent misuse and assessed the source of benzodiazepines obtained for the most recent misuse stratified by the status of benzodiazepine use disorders. This study used SUDAAN software24 to account for the complex sample design and sample weights of NSDUH.
RESULTS
Prevalence of benzodiazepine use, misuse, and use disorders among U.S. adults
Based on the 102,000 sampled adults from the 2015–2016 NSDUH, we estimated that in the 12 months prior to the survey interview, approximately 30.5 (annual average, 95% CI= 29.63–31.29) million U.S. adults used benzodiazepines, 5.2 (95% CI=4.94–5.48) million misused benzodiazepines at least once, and 0.5 (95% CI= 0.38–0.52) million met criteria for benzodiazepine use disorders [0.3 (95% CI=0.23–0.33) million for benzodiazepine dependence and 0.2 (95% CI=0.13–0.21) million for benzodiazepine abuse] (Figure 1). Approximately 12.5% (95% CI=12.19%–12.81%) used benzodiazepines, 2.1% (95% CI=2.03%–2.25%) misused benzodiazepines at least once, and 0.19% (95% CI=0.15%–0.22%) had a benzodiazepine use disorder. Among benzodiazepine users, 17.1% (95% CI=16.30%–17.93%) misused benzodiazepines at least once, and 1.5% (95% CI=1.26%–1.72%) had benzodiazepine use disorders. In addition, based on IMS data, we further estimated that 25.7 million adults were dispensed benzodiazepines in outpatient retail pharmacies in the U.S. in 2015.
Figure 1.
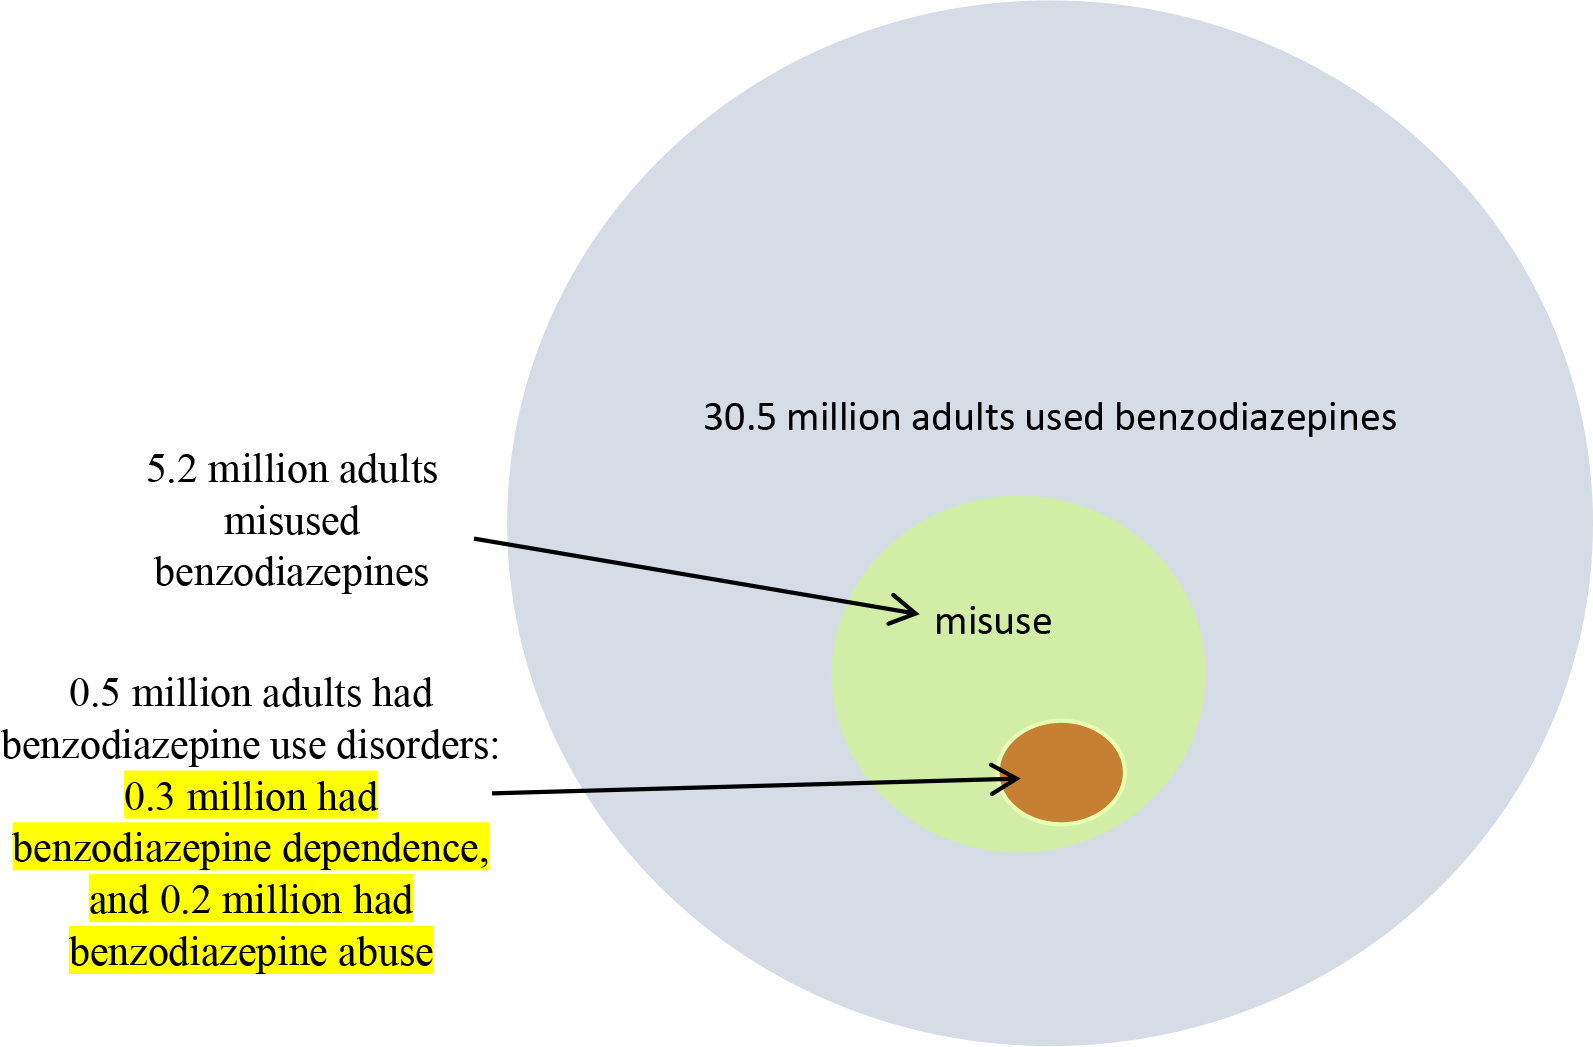
Benzodiazepine use, misuse, and use disorders among adults in the United States: Annual averages, 2015–2016 (all circles below are approximately proportionally sized by area)
Characteristics of adults with past-year benzodiazepine use
Past-year benzodiazepine use was associated with older age, women, non-Hispanic whites, having high-school or more education, having Medicaid-only, being widowed/divorced/separated, not being full-time employed, having family income below $20,000, residing in the non-West regions, not living in large metropolitan areas, reporting less than excellent self-rated health, having ER visit(s), use of most substances, and having suicidal ideation and most of the psychiatric disorders assessed in this study (Table 1).
Table 1.
Bivariable logistic regression model showing characteristics distinguishing adults without past-year benzodiazepine use from adults with past-year benzodiazepine use in the U.S.: 2015–2016 NSDUH (N=102,000a)
| Characteristics | Adults with Benzodiazepine Use Weighted % (SE) | Adults without Benzodiazepine Use Weighted % (SE) | Benzodiazepine Use vs. No Use OR (95% CI) |
|---|---|---|---|
|
| |||
| Sociodemographic Characteristics | |||
|
| |||
| Age | |||
| 18–29 | 10.4 (0.20) | 89.6 (0.20) | 0.7 (0.69–0.78) |
| 30–49 | 12.2 (0.21) | 87.8 (0.21) | 0.9 (0.82–0.92) |
| ≥50+ | 13.7 (0.29) | 86.3 (0.29) | 1.0 |
|
| |||
| Sex | |||
| Men | 9.5 (0.19) | 90.5 (0.19) | 0.6 (0.55–0.61) |
| Women+ | 15.3 (0.24) | 84.7 (0.24) | 1.0 |
|
| |||
| Race/ethnicity | |||
| NH white + | 15.4 (0.20) | 84.6 (0.20) | 1.0 |
| NH black | 7.2 (0.34) | 92.8 (0.34) | 0.4 (0.39–0.48) |
| Hispanic | 87.7 (0.32) | 92.3 (0.32) | 0.5 (0.42–0.50) |
| NH other | 6.6 (0.39) | 93.4 (0.58) | 0.4 (0.34–0.44) |
|
| |||
| Education | |||
| < high school+ | 9.9 (0.43) | 90.1 (0.43) | 1.0 |
| High school | 12.1 (0.29) | 87.9 (0.29) | 1.3 (1.13–1.39) |
| Some college | 14.1 (0.27) | 85.9 (0.27) | 1.5 (1.35–1.66) |
| College graduate | 12.3 (0.30) | 87.7 (0.30) | 1.3 (1.15–1.43) |
|
| |||
| Health insurance | |||
| Private only+ | 11.4 (0.19) | 88.6 (0.19) | 1.0 |
| Uninsured | 9.8 (0.38) | 90.2 (0.38) | 0.8 (0.77–0.92) |
| Medicaid only | 15.3 (0.43) | 84.7 (0.43) | 1.4 (1.31–1.52) |
| Other | 14.4 (0.37) | 85.6 (0.37) | 1.3 (1.23–1.41) |
|
| |||
| Marital status | |||
| Married+ | 11.4 (0.21) | 88.6 (0.21) | 1.0 |
| Widowed | 14.9 (0.81) | 85.1 (0.81) | 1.4 (1.19–1.56) |
| Divorced/separated | 17.2 (0.50) | 82.8 (0.50) | 1.6 (1.49–1.75) |
| Never married | 11.8 (0.23) | 88.2 (0.23) | 1.1 (0.99–1.11) |
|
| |||
| Employment status | |||
| Full-time+ | 10.3 (0.17) | 89.7 (0.17) | 1.0 |
| Part-time | 13.1 (0.39) | 86.9 (0.39) | 1.3 (1.22–1.43) |
| Disabled for work | 32.5 (1.07) | 67.5 (1.07) | 4.2 (3.80–4.66) |
| Unemployment | 12.7 (0.67) | 87.3 (0.67) | 1.3 (1.13–1.44) |
| Other | 12.4 (0.32) | 87.6 (0.32) | 1.2 (1.15–1.32) |
|
| |||
| Family income | |||
| <$20,000 | 13.7 (0.37) | 86.3 (0.37) | 1.2 (1.07–1.25) |
| $20,000–$49,999 | 12.6 (0.28) | 87.4 (0.28) | 1.1 (0.98–1.12) |
| $50,000–$74,999 | 11.9 (0.36) | 88.1 (0.36) | 1.0 (0.91–1.07) |
| >$75,000+ | 12.1 (0.25) | 87.9 (0.25) | 1.0 |
|
| |||
| Region | |||
| Northeast | 13.6 (0.39) | 86.4 (0.39) | 1.3 (1.20–1.45) |
| Midwest | 11.9 (0.30) | 88.1 (0.30) | 1.1 (1.03–1.24) |
| South | 13.5 (0.26) | 86.5 (0.26) | 1.3 (1.21–1.42) |
| West+ | 10.7 (0.33) | 89.3 (0.33) | 1.0 |
|
| |||
| Metropolitan statistical area | |||
| Large metro | 11.8 (0.22) | 88.2 (0.22) | 0.9 (0.83–0.97) |
| Small metro | 13.6 (0.27) | 86.4 (0.27) | 1.1 (0.97–1.14) |
| Non-metro+ | 13.0 (0.38) | 87.0 (0.38) | 1.0 |
|
| |||
| Health Indicator | |||
|
| |||
| Self-rated health | |||
| Excellent+ | 7.9 (0.26) | 92.1 (0.26) | 1.0 |
| Very good | 11.0 (0.22) | 89.0 (0.22) | 1.4 (1.32–1.57) |
| Good | 13.4 (0.29) | 86.6 (0.29) | 1.8 (1.67–1.98) |
| Fair/poor | 21.6 (0.59) | 78.4 (0.59) | 3.2 (2.94–3.55) |
|
| |||
| No. PY ER visits | |||
| 0+ | 10.6 (0.17) | 89.4 (0.17) | 1.0 |
| 1 | 15.8 (0.45) | 84.2 (0.45) | 1.6 (1.48–1.71) |
| 2 | 17.7 (0.61) | 82.3 (0.61) | 1.8 (1.67–1.99) |
| ≥3 | 27.9 (0.94) | 72.1 (0.94) | 3.3 (2.98–3.61) |
|
| |||
| Major Depressive Episode | |||
| Yes | 34.0 (0.82) | 66.0 (0.82) | 4.2 (3.91–4.56) |
| No+ | 10.9 (0.15) | 89.1 (0.15) | 1.0 |
|
| |||
| Suicide ideation | |||
| Yes | 31.2 (0.93) | 68.8 (0.93) | 3.4 (3.13–3.73) |
| No+ | 11.7 (0.15) | 88.3 (0.15) | 1.0 |
|
| |||
| Substance Use Problems | |||
|
| |||
| Tobacco use & disorder | |||
| PM nicotine dependence | 21.4 (0.51) | 78.6 (0.51) | 3.5 (3.16–3.76) |
| PY tobacco use, no dependence | 14.4 (0.32) | 85.6 (0.32) | 2.1 (1.97–2.30) |
| LT use, but no PY use | 13.1 (0.27) | 86.9 (0.27) | 1.9 (1.77–2.06) |
| Never tobacco use+ | 7.3 (0.21) | 92.7 (0.21) | 1.0 |
|
| |||
| Alcohol use & disorders | |||
| PY alcohol use disorders | 23.9 (0.73) | 75.1 (0.73) | 4.8 (4.23–5.45) |
| PY alcohol use, but no disorder | 12.4 (0.18) | 87.6 (0.18) | 2.2 (1.95–2.40) |
| LT use, but no PY use | 14.1 (0.44) | 85.9 (0.44) | 2.5 (2.22–2.83) |
| Never alcohol use+ | 6.1 (0.30) | 93.9 (0.30) | 1.0 |
|
| |||
| Cannabis use & disorders | |||
| PY cannabis use disorders | 30.4 (1.26) | 69.6 (1.26) | 5.1 (4.51–5.80) |
| PY use, no disorder | 22.8 (0.49) | 77.2 (0.49) | 3.5 (3.21–3.70) |
| LT use, no PY use | 15.3 (0.28) | 84.7 (0.28) | 2.1 (1.98–2.24) |
| Never cannabis use+ | 7.9 (0.17) | 92.1 (0.17) | 1.0 |
|
| |||
| Cocaine use & disorders | |||
| PY cocaine use disorders | 45.3 (3.44) | 54.7 (3.44) | 7.4 (5.62–9.69) |
| PY use, no disorder | 39.0 (1.47) | 61.0 (1.47) | 5.7 (5.03–6.45) |
| LT use, no PY use | 23.1 (0.54) | 76.9 (0.54) | 2.7 (2.50–2.86) |
| Never cocaine use+ | 10.1 (0.15) | 89.9 (0.15) | 1.0 |
|
| |||
| Heroin use & disorders | |||
| PY heroin use or disorders | 60.5 (3.21) | 39.5 (3.21) | 11.2 (8.59–14.53) |
| LT use, no PY use | 28.9 (1.67) | 71.1 (1.67) | 3.0 (2.53–3.50) |
| Never heroin use+ | 12.0 (0.15) | 88.0 (0.15) | 1.0 |
|
| |||
| Hallucinogen use & disorders | |||
| PY hallucinogen disorders | 56.0 (4.92) | 44.0 (4.92) | 11.3 (7.59–16.67) |
| PY use, no disorder | 34.6 (1.35) | 65.4 (1.35) | 4.7 (4.14–5.29) |
| LT use, no PY use | 22.9 (0.49) | 77.1 (0.49) | 2.6 (2.47–2.80) |
| Never hallucinogen use+ | 10.1 (0.15) | 89.9 (0.15) | 1.0 |
|
| |||
| Inhalant use & disorders | |||
| PY inhalant use/ use disorders | 34.3 (2.41) | 65.7 (2.41) | 4.1 (3.35–5.09) |
| LT use, no PY use | 24.3 (0.62) | 75.7 (0.62) | 2.5 (2.36–2.74) |
| Never inhalant use+ | 11.2 (0.16) | 88.8 (0.16) | 1.0 |
|
| |||
| Rx opioid misuse & use disorders | |||
| PY use disorders | 60.4 (2.27) | 39.6 (2.27) | 27.7 (22.75–33.69) |
| PY misuse, no PY use disorder | 36.1 (0.99) | 63.9 (0.99) | 10.2 (9.20–11.38) |
| PY use, lifetime misuse | 30.6 (1.25) | 69.4 (1.25) | 8.0 (6.99–9.10) |
| PY use, no lifetime misuse | 18.9 (0.34) | 81.1 (0.34) | 4.2 (3.90–4.57) |
| LT use, no PY use | 9.0 (0.25) | 91.0 (0.25) | 1.8 (1.63–1.94) |
| Never use+ | 5.2 (0.17) | 94.8 (0.17) | 1.0 |
|
| |||
| Rx stimulant misuse & use disorders | |||
| PY misuse & use disorders | 38.8 (1.24) | 61.2 (1.24) | 5.4 (4.84–5.99) |
| PY use, lifetime misuse | 39.7 (2.79) | 60.3 (2.79) | 5.6 (4.43–7.04) |
| PY use, no lifetime misuse | 29.7 (0.97) | 70.3 (0.97) | 3.6 (3.26–3.95) |
| LT use, no PY use | 21.6 (0.85) | 78.4 (0.85) | 2.3 (2.11–2.59) |
| Never Rx stimulant use+ | 10.5 (0.16) | 89.5 (0.16) | 1.0 |
SAMHSA requires that any description of overall sample sizes based on the restricted-use data files be rounded to the nearest 100, which intends to minimize potential disclosure risk.
Abbreviations: SE: standard error; OR=odds ratio; CI = confidence interval; NH=Non-Hispanic; PY=past year; PM: past month; LT=lifetime; and Rx=prescription.
Each bolded odds ratio or adjusted odds ratio is significantly different (p<0.05) from the corresponding reference group (with + sign).
Characteristics of adults with past-year benzodiazepine misuse and benzodiazepine use disorders
Benzodiazepine misuse without use disorders was associated with younger age, male sex, being non-Hispanic black or Hispanic, having less than high school education, being uninsured, being part-time employed or unemployed, being single, having family income below $50,000, residing in a metropolitan area, having no past-year ER visits, and having past-year suicidal ideation, major depressive episodes, and other specific substance use problems (Table 2). Correlates of benzodiazepine use disorders were similar to correlates of benzodiazepine misuse without use disorders, except that benzodiazepine use disorders were associated with being non-Hispanic other (rather than Hispanic), having Medicaid, and having ER visit(s) and that most of these correlates were associated with benzodiazepine use disorders more strongly than with benzodiazepine misuse without use disorders (Table 2).
Table 2.
Bivariable multinomial logistic regression model showing characteristics that distinguish benzodiazepine misuse without use disorders, benzodiazepine use disorders, and benzodiazepine use without misuse among past-year adult benzodiazepine users in the U.S., 2015–2016 NSDUH (N=12,100a)
| Characteristics | Adults with Benzodiazepine Use without Misuse Weighted % (SE) | Adults with Benzodiazepine Misuse without Disorders Weighted % (SE) | Adults with Benzodiazepine Use Disorders weighted % (SE) | Benzodiazepine Misuse without Use Disordersb vs. Benzodiazepine Use without Misuse OR (95% CI) | Benzodiazepine Use Disordersb vs. Benzodiazepine Use without Misuse OR (95% CI) |
|---|---|---|---|---|---|
|
| |||||
| Sociodemographic Characteristics | |||||
|
| |||||
| Age | |||||
| 18–29 | 55.3 (0.99) | 40.0 (0.95) | 3.9 (0.35) | 9.7 (8.06–11.66) | 11.3 (6.53–19.43) |
| 30–49 | 83.5 (0.63) | 14.4 (0.60) | 1.6 (0.21) | 2.3 (1.89–2.84) | 3.1 (1.73–5.57) |
| ≥50+ | 92.4 (0.57) | 6.9 (0.55) | 0.6 (0.15) | 1.0 | 1.0 |
|
| |||||
| Sex | |||||
| Men | 76.7 (0.84) | 20.8 (0.82) | 1.9 (0.23) | 2.0 (1.72–2.22) | 2.7 (1.32–5.46) |
| Women+ | 86.5 (0.45) | 12.0 (0.42) | 1.2 (0.13) | 1.0 | 1.0 |
|
| |||||
| Race/ethnicity | |||||
| NH white + | 83.8 (0.45) | 14.5 (0.43) | 1.3 (0.13) | 1.0 | 1.0 |
| NH black | 79.9 (1.52) | 17.2 (1.40) | 3.0 (0.62) | 1.2 (1.01–1.53) | 2.4 (1.48–3.80) |
| Hispanic | 77.9 (1.77) | 19.9 (1.69) | 1.5 (0.37) | 1.5 (1.19–1.84) | 1.3 (0.75–2.15) |
| NH other | 81.7 (1.69) | 15.4 (1.54) | 2.6 (0.63) | 1.1 (0.85–1.40) | 2.0 (1.21–3.42) |
|
| |||||
| Education | |||||
| < high school+ | 81.1 (1.57) | 16.3 (1.52) | 2.0 (0.43) | 1.0 | 1.0 |
| High school | 82.6 (0.82) | 14.9 (0.77) | 2.0 (0.28) | 0.9 (0.70–1.15) | 1.0 (0.56–1.66) |
| Some college | 80.6 (0.68) | 17.4 (0.65) | 1.5 (0.20) | 1.1 (0.85–1.36) | 0.8 (0.45–1.25) |
| College graduate | 86.4 (0.74) | 12.5 (0.71) | 0.8 (0.16) | 0.7 (0.56–0.93) | 0.4 (0.20–0.66) |
|
| |||||
| Health insurance | |||||
| Private only+ | 81.4 (0.63) | 17.1 (0.61) | 1.3 (0.15) | 1.0 | 1.0 |
| Uninsured | 61.6 (1.81) | 31.8 (1.73) | 3.4 (0.61) | 2.4 (1.99–2.84) | 3.4 (2.14–5.29) |
| Medicaid only | 79.9 (1.06) | 17.0 (1.00) | 2.5 (0.32) | 1.0 (0.86–1.20) | 2.0 (1.37–2.84) |
| Other | 92.8 (0.71) | 6.2 (0.67) | 0.7 (0.21) | 0.3 (0.25–0.41) | 0.5 (0.27–0.94) |
|
| |||||
| Marital status | |||||
| Married+ | 91.9 (0.53) | 8.3 (0.51) | 0.5 (0.10) | 1.0 | 1.0 |
| Widowed | 93.0 (1.22) | 6.0 (1.14) | 0.9 (0.44) | 0.7 (0.46–1.07) | 1.7 (0.59–4.91) |
| Divorced/separated | 86.0 (1.01) | 11.7 (0.95) | 1.7 (0.34) | 1.5 (1.17–1.86) | 3.6 (2.06–6.28) |
| Never married | 63.4 (0.94) | 32.7 (0.90) | 3.3 (0.31) | 5.6 (4.82–6.59) | 9.2 (5.93–14.19) |
|
| |||||
| Employment status | |||||
| Full-time+ | 80.1 (0.64) | 18.2 (0.62) | 1.4 (0.17) | 1.0 | 1.0 |
| Part-time | 77.2 (1.28) | 21.0 (1.24) | 1.4 (0.27) | 1.2 (1.02–1.41) | 1.1 (0.68–1.71) |
| Disabled for work | 91.5 (1.01) | 6.3 (0.90) | 1.3 (0.39) | 0.3 (0.22–0.42) | 0.8 (0.43–1.57) |
| Unemployment | 67.0 (2.33) | 26.7 (2.18) | 4.8 (0.97) | 1.8 (1.38–2.22) | 4.2 (2.49–6.98) |
| Other | 88.2 (0.76) | 10.3 (0.73) | 1.2 (0.21) | 0.5 (0.43–0.61) | 0.8 (0.53–1.22) |
|
| |||||
| Family income | |||||
| <$20,000 | 78.3 (0.99) | 18.8 (0.93) | 2.2 (0.33) | 1.5 (1.29–1.86) | 2.5 (1.57–3.82) |
| $20,000–$49,999 | 81.6 (0.80) | 16.2 (0.77) | 1.8 (0.22) | 1.3 (1.08–1.49) | 1.9 (1.25–2.80) |
| $50,000–$74,999 | 85.4 (1.01) | 13.1 (0.94) | 1.3 (0.33) | 1.0 (0.80–1.20) | 1.3 (0.72–2.42) |
| ≥$75,000+ | 85.4 (0.70) | 13.4 (0.68) | 1.0 (0.16) | 1.0 | 1.0 |
|
| |||||
| Region | |||||
| Northeast | 82.2 (1.09) | 15.8 (1.04) | 1.7 (0.30) | 1.0 (0.78–1.19) | 1.2 (0.68–2.00) |
| Midwest | 84.1 (0.79) | 14.3 (0.75) | 1.4 (0.27) | 0.9 (0.71–1.03) | 1.0 (0.55–1.65) |
| South | 83.2 (0.70) | 14.9 (0.64) | 1.5 (0.18) | 0.9 (0.76–1.06) | 1.0 (0.63–1.61) |
| West+ | 81.8 (1.02) | 16.3 (0.94) | 1.4 (0.28) | 1.0 | 1.0 |
|
| |||||
| Metropolitan statistical area | |||||
| Large metro | 81.8 (0.63) | 16.3 (0.59) | 1.5 (0.17) | 1.4 (1.17–1.68) | 1.2 (0.78–1.90) |
| Small metro | 83.1 (0.75) | 15.1 (0.70) | 1.5 (0.21) | 1.3 (1.06–1.55) | 1.2 (0.73–1.90) |
| Non-metro+ | 85.8 (0.89) | 12.1 (0.84) | 1.3 (0.25) | 1.0 | 1.0 |
|
| |||||
| Health Indicator | |||||
|
| |||||
| Self-rated health | |||||
| Excellent+ | 80.0 (1.17) | 18.3 (1.14) | 1.5 (0.30) | 1.0 | 1.0 |
| Very good | 79.8 (0.81) | 18.5 (0.77) | 1.3 (0.18) | 1.0 (0.84–1.21) | 0.9 (0.56–1.46) |
| Good | 82.7 (0.79) | 15.2 (0.76) | 1.6 (0.23) | 0.8 (0.67–0.97) | 1.1 (0.66–1.76) |
| Fair/poor | 88.7 (0.80) | 9.3 (0.74) | 1.5 (0.25) | 0.5 (0.36–0.57) | 0.9 (0.55–1.58) |
|
| |||||
| No. PY ER visits | |||||
| 0+ | 82.7 (0.56) | 16.0 (0.54) | 1.1 (0.13) | 1.0 | 1.0 |
| 1 | 83.7 (0.90) | 13.6 (0.84) | 2.0 (0.29) | 0.8 (0.71–0.99) | 1.8 (1.21–2.61) |
| 2 | 81.9 (1.23) | 15.6 (1.16) | 1.8 (0.35) | 1.0 (0.82–1.19) | 1.6 (1.02–2.63) |
| ≥3 | 82.3 (1.44) | 14.2 (1.28) | 2.7 (0.66) | 0.9 (0.71–1.12) | 2.5 (1.42–4.29) |
|
| |||||
| Major Depressive Episode | |||||
| Yes | 78.3 (1.05) | 16.9 (0.92) | 3.9 (0.46) | 1.2 (1.06–1.43) | 4.2 (3.03–5.86) |
| No+ | 84.0 (0.45) | 14.8 (0.44) | 1.0 (0.10) | 1.0 | 1.0 |
|
| |||||
| Suicide ideation | |||||
| Yes | 69.1 (1.56) | 24.4 (1.44) | 5.0 (0.70) | 2.1 (1.77–2.50) | 5.6 (3.95–7.90) |
| No+ | 84.4 (0.43) | 14.2 (0.41) | 1.1 (0.10) | 1.0 | 1.0 |
|
| |||||
| Tobacco use & disorder | |||||
| PM nicotine dependence | 71.8 (1.10) | 23.6 (1.04) | 3.5 (0.38) | 4.7 (3.68–5.87) | 9.4 (4.90–17.40) |
| PY tobacco use | 72.4 (1.01) | 25.1 (0.96) | 2.0 (0.30) | 4.9 (3.90–6.14) | 5.3 (2.72–10.35) |
| LT use, but no PY use | 89.6 (0.64) | 9.6 (0.61) | 0.6 (0.14) | 1.5 (1.18–1.93) | 1.3 (0.62–2.80) |
| Never tobacco use+ | 92.9 (0.64) | 6.6 (0.62) | 0.5 (0.15) | 1.0 | 1.0 |
|
| |||||
| Alcohol use & disorders | |||||
| PY alcohol use disorders | 57.6 (1.61) | 36.0 (1.55) | 4.9 (0.56) | 10.4 (8.14–13.30) | 5.9 (3.65–9.61) |
| PY alcohol use, no disorders | 83.6 (0.52) | 15.3 (0.51) | 0.9 (0.11) | 3.0 (2.42–3.79) | 0.8 (0.48–1.21) |
| LT use, no PY use; never use+ | 92.7 (0.63) | 5.6 (0.54) | 1.3 (0.28) | 1.0 | 1.0 |
|
| |||||
| Cannabis use & disorders | |||||
| PY cannabis use disorders | 38.7 (2.48) | 48.7 (2.51) | 9.2 (1.35) | 13.6 (10.74–17.32) | 26.9 (16.95–42.58) |
| PY use, no disorder | 64.2 (1.11) | 32.6 (1.08) | 2.6 (0.30) | 5.5 (4.77–6.35) | 4.6 (3.17–6.55) |
| LT use, no PY use; never use+ | 90.7 (0.41) | 8.4 (0.38) | 0.8 (0.11) | 1.0 | 1.0 |
|
| |||||
| Cocaine use & disorders | |||||
| PY cocaine use disorders | 32.1 (4.68) | 48.6 (4.88) | 13.7 (2.84) | 13.9 (8.73–22.18) | 52.2 (28.91–94.12) |
| PY use, no disorder | 38.4 (2.31) | 56.1 (2.27) | 4.4 (0.80) | 13.5 (10.83–16.76) | 14.2 (8.80–22.80) |
| LT use, no PY use | 76.8 (0.92) | 20.1 (0.89) | 2.3 (0.31) | 2.4 (2.09–2.78) | 3.7 (2.57–5.38) |
| Never cocaine use+ | 89.4 (0.42) | 9.7 (0.40) | 0.7 (0.09) | 1.0 | 1.0 |
|
| |||||
| Heroin use & disorders | |||||
| PY heroin use or disorders | 42.9 (3.85) | 40.5 (3.54) | 12.7 (2.18) | 5.8 (4.12–8.05) | 23.6 (14.60–38.06) |
| LT use, no PY use | 55.3 (3.26) | 35.2 (3.08) | 6.7 (1.44) | 3.9 (2.92–5.17) | 9.7 (5.81–16.09) |
| Never heroin use+ | 84.8 (0.41) | 13.9 (0.36) | 1.1 (0.10) | 1.00 | 1.0 |
|
| |||||
| Hallucinogen use & disorders | |||||
| PY hallucinogen use/disorders | 32.8 (2.06) | 59.1 (2.05) | 6.6 (0.88) | 19.3 (15.49–24.03) | 29.4 (19.29–44.69) |
| LT use, no PY use | 72.5 (0.92) | 23.9 (0.91) | 2.7 (0.33) | 3.5 (3.06–4.07) | 5.5 (3.71–8.09) |
| Never hallucinogen use+ | 90.8 (0.41) | 8.5 (0.40) | 0.6 (0.09) | 1.0 | 1.0 |
|
| |||||
| Inhalant use & disorders | |||||
| PY inhalant use/ use disorders | 33.7 (3.97) | 56.8 (4.29) | 6.5 (1.89) | 13.0 (8.95–18.90) | 15.8 (8.27–30.24) |
| LT use, no PY use | 65.3 (1.32) | 30.4 (1.31) | 3.2 (0.36) | 3.6 (3.09–4.16) | 4.0 (2.88–5.46) |
| Never inhalant use+ | 87.4 (0.42) | 11.3 (0.38) | 1.1 (0.12) | 1.0 | 1.0 |
|
| |||||
| Rx opioid misuse & use disorders | |||||
| PY use disorders | 39.8 (2.79) | 34.2 (2.60) | 19.6 (2.24) | 3.6 (2.71–4.88) | 31.9 (19.34–52.64) |
| PY misuse, no PY use disorder | 45.3 (1.65) | 51.7 (1.65) | 2.4 (0.39) | 4.8 (4.02–5.82) | 3.5 (2.12–5.76) |
| PY use, lifetime misuse | 73.9 (1.93) | 23.0 (1.83) | 1.9 (0.53) | 1.3 (1.03–1.68) | 1.7 (0.87–3.31) |
| PY use, no lifetime misuse | 94.6 (0.40) | 4.9 (0.39) | 0.4 (0.10) | 0.2 (0.18–0.27) | 0.3 (0.16–0.52) |
| LT use, no PY use | 91.1 (0.86) | 8.7 (0.86) | 0.2 (0.07) | 0.4 (0.31–0.52) | 0.1 (0.04–0.29) |
| Never use+ | 79.9 (1.06) | 18.8 (1.03) | 1.2 (0.24) | 1.0 | 1.0 |
|
| |||||
| Rx stimulant misuse & use disorders | |||||
| PY misuse & use disorders | 33.6 (1.86) | 58.0 (1.91) | 5.5 (0.78) | 12.9 (10.70–15.43) | 12.4 (8.40–18.21) |
| PY use, lifetime misuse | 52.1 (4.48) | 42.6 (4.49) | 5.1 (1.57) | 6.1 (4.15–8.88) | 7.4 (3.77–14.68) |
| PY use, no lifetime misuse | 86.6 (1.18) | 11.3 (1.12) | 1.7 (0.37) | 1.0 (0.76–1.23) | 1.5 (0.91–2.42) |
| LT use, no PY use | 85.3 (1.38) | 13.9 (1.36) | 0.6 (0.23) | 1.2 (0.95–1.55) | 0.5 (0.22–1.17) |
| Never use+ | 87.0 (0.46) | 11.7 (0.43) | 1.2 (0.13) | 1.0 | 1.0 |
SAMHSA requires that any description of overall sample sizes based on the restricted-use data files be rounded to the nearest 100, which intends to minimize potential disclosure risk.
Benzodiazepine use disorders are defined as adults who misused benzodiazepine-only tranquilizers in the past year and had Rx tranquilizer use disorders or who misused benzodiazepine-only sedatives in the past year and had Rx sedative use disorders.
Abbreviations: Benzo=benzodiazepine; SE=standard error; OR=odds ratio; CI = confidence interval; NH=Non-Hispanic; PY=past year; PM: past month; LT=lifetime; Rx=prescription.
Each bolded odds ratio is significantly different (p<0.05) from the corresponding reference group (with + sign).
Main motivation for benzodiazepine misuse
Among past-year benzodiazepine misusers, 46.3% reported that the motivation for their most recent misuse was to relax or relieve tension, followed by helping with sleep (22.4%) (Figure 2). About 5.7% reported “experimentation” as their main motivation for misuse, and 11.8% reported using them to “get high” or because of being “hooked”. Appendix Table 1 shows that the motivation for benzodiazepine misuse varied by the status of benzodiazepine use disorders. Compared to adults with misuse without use disorders, adults with benzodiazepine use disorders were more likely to report a drug related motivation (24.6% vs. 18.5%) or to help with emotions (20.3% vs. 9.6%) and were less likely to report misusing them to relax (38.2% vs. 47.1%) or to help with sleep (14.9% vs. 23.1%).
Figure 2.
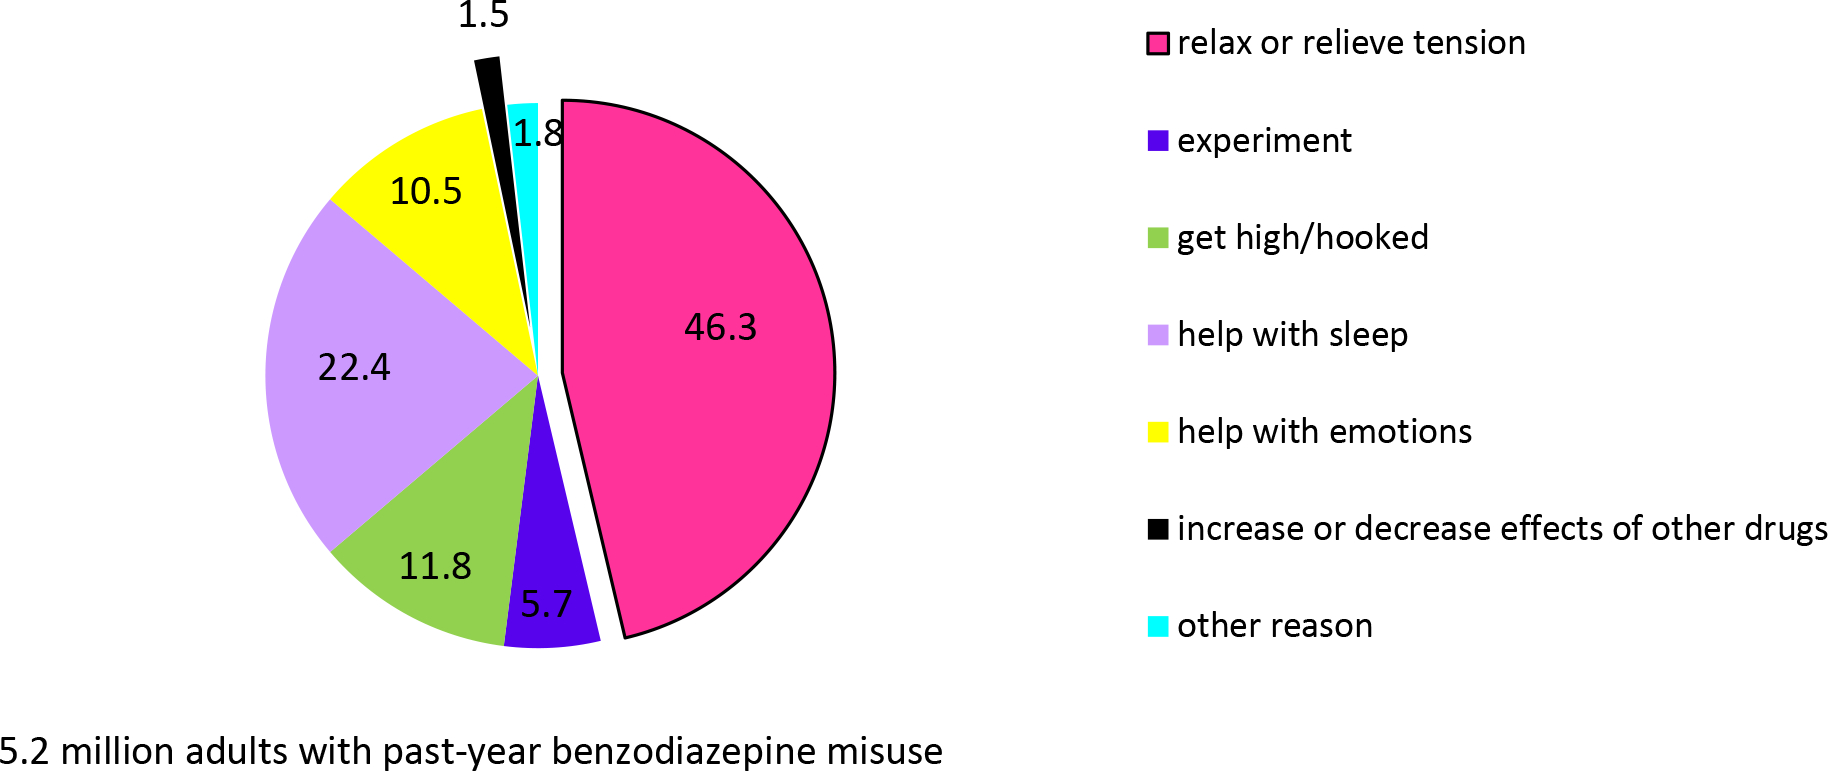
Main reason for misusing benzodiazepine the most recent time in the past year among U.S. adults with past-year benzodiazepine misuse whose last prescription tranquilizer or sedative misuse was benzodiazepine, 2015–2016, annual average weighted percentage (n=2,900)
Source of benzodiazepines among adult misusers
Among past-year adult benzodiazepine misusers, the most commonly reported sources for the most recent benzodiazepine misuse included obtaining it from friends or relatives for free (53.0%) and from one doctor (19.7%) (Figure 3). Among those who obtained benzodiazepines from friends or relatives for free, 80.4% reported that their friends or relatives received prescription benzodiazepines from one doctor. Appendix Table 2 shows that the source for the most recent benzodiazepine misuse varied by the status of benzodiazepine use disorders. Compared to adults with benzodiazepine misuse without use disorders, adults with benzodiazepine use disorders were more likely to obtain them from doctors (40.8% vs. 18.5%) or from drug dealers/strangers (16.7% vs. 6.8%) and were less likely to obtain them from friends or relatives for free (20.9% vs. 56.1%).
Figure 3.
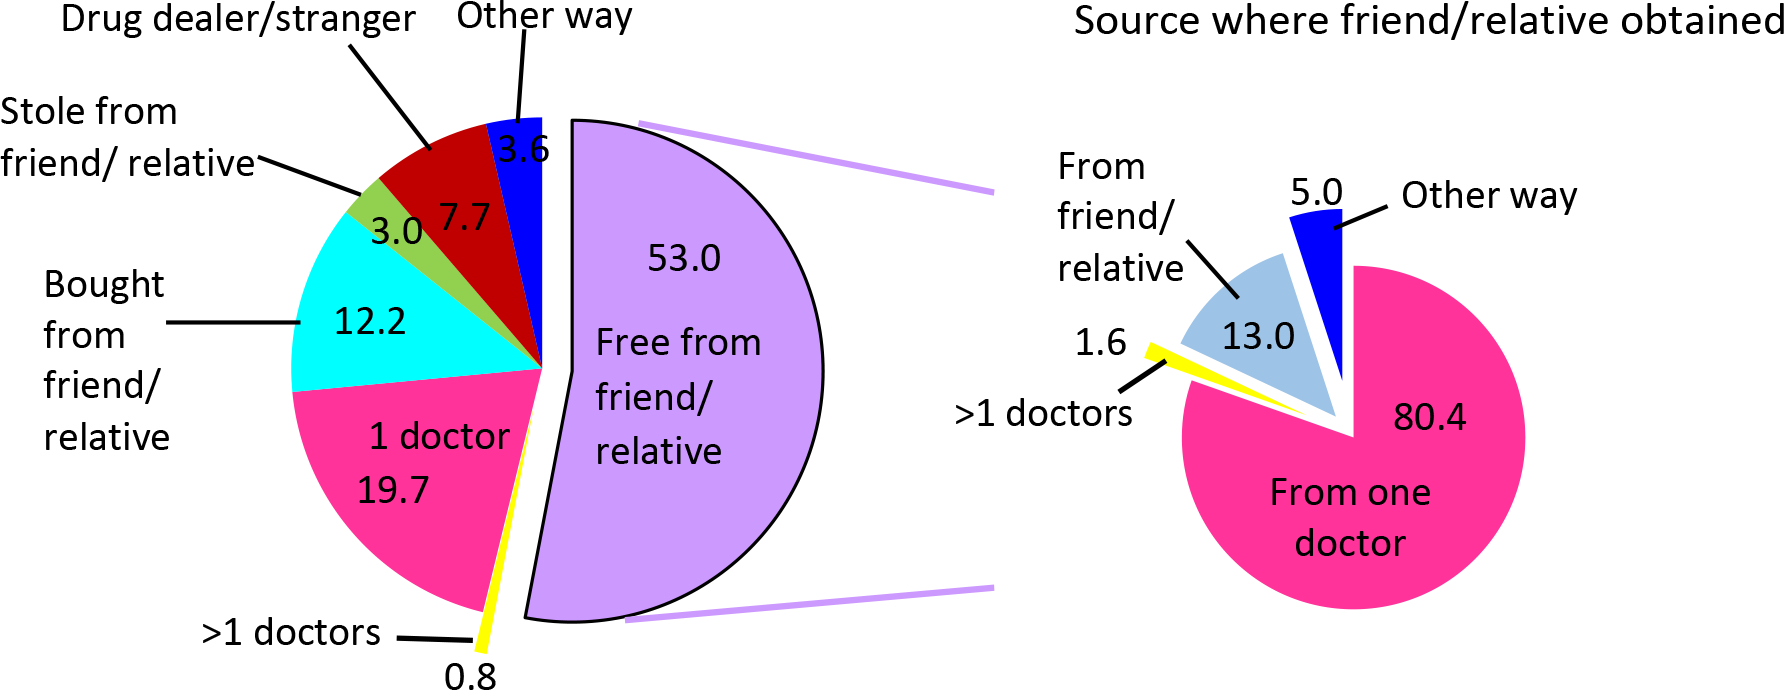
Most recent source of benzodiazepine among U.S. adults with past-year benzodiazepine misuse whose last prescription tranquilizer or sedative misuse was benzodiazepine, 2015–2016, annual average weighted percentage (n=2,800)
DISCUSSION
This is the first study using nationally representative data to examine the prevalence and correlates of benzodiazepine use, to estimate the prevalence of misuse and use disorders among benzodiazepine users, and to compare the correlates of benzodiazepine use without misuse to those of benzodiazepine misuse and use disorders. Based on NSDUH data, we found that the prevalence of benzodiazepine use among U.S. adults was 12.5% or approximately 30.5 million adults (annual averages during in 2015–2016), whereas based on the IMS data, we found that nearly 26 million adults were dispensed benzodiazepines in outpatient retail pharmacies in the U.S. in 2015. Because retail pharmacy data do not include adults obtaining benzodiazepines from hospitals, clinics, and other non-retail settings, the overall number of U.S. adults who use benzodiazepines based on the NSDUH is expected to be greater than our IMS estimate. These estimates are higher than the 5.2% of adult benzodiazepine users in 2008 reported by Olfson et al.,1 but consistent with a prior study showing upward trends in benzodiazepine use during 2002–2014.12 Although differences in data sources may have contributed to the differences in prevalence estimates, these results demonstrate a high prevalence of benzodiazepine use among adults in the U.S.
Benzodiazepine use was associated with several indicators of poor general health, mental health problems, as well as substance use disorders of all substances assessed. While some of these correlates may be related to clinical reasons for prescribing benzodiazepines, others are causes for concern. For instance, the associations of benzodiazepine use with alcohol and opioid use and use disorders are particularly worrisome because of the risk for drug interactions and increased overdose risk when these substance are combined. Adults who use benzodiazepines should be assessed at baseline and on an ongoing basis for a broad range of psychiatric and general medical conditions. The high prevalence of benzodiazepine use and the high number of individuals with untreated anxiety disorders and insomnia in the U.S.25, 26 suggest the need for more effective treatments and better access to high-quality, evidence-based treatments for these disorders.
Among adults who used benzodiazepines, only 1.5% met criteria for benzodiazepine use disorders, suggesting that most patients are unlikely to become addicted to benzodiazepines. However, because benzodiazepines are widely used, even a low prevalence of benzodiazepine use disorder among benzodiazepine users results in large absolute numbers of individuals with benzodiazepine use disorders in the general adult population. Our results suggest that younger users, socioeconomically disadvantaged users, and those with psychopathology (particularly substance use disorders) are at increased risk for benzodiazepine misuse, use disorders, and associated harms. These findings can enable targeted preventive and early interventions, without unduly restricting access for individuals with legitimate medical need for benzodiazepines.
Of particular importance with respect to benzodiazepine-related harms are the strong associations between benzodiazepine misuse and use disorders with heroin and prescription opioid use disorders, which may help explain the increased risk of lethal overdoses associated with combined opioid and benzodiazepine use.11–12 The strong associations of benzodiazepine misuse and use disorders with cannabis use and cannabis use disorders are also of considerable interest, given the evolving legal landscape of cannabis use and increases in the prevalence of cannabis use27, 28 and cannabis use disorders in the U.S.28 The association with cocaine use disorders may reflect the use of benzodiazepines to modify its effects. Moreover, MDE and suicidal ideation were associated with increased odds of benzodiazepine use disorders. Our findings suggest the need to screen for benzodiazepine use disorders among adults with mental disorders, particularly substance use disorders; to screen for other mental disorders among adults taking benzodiazepines; and to ensure that all mental disorders, including co-occurring substance use disorders, are properly treated using evidence-based approaches.
While benzodiazepine use was associated with females, probably due to greater prevalence of anxiety disorders29 and higher probability of treatment seeking among women than among men,25 benzodiazepine use disorders were associated with men, possibly reflecting the greater prevalence of substance use disorders among men.30 Increasing prevalence of benzodiazepine use with age may be due to long-term use of benzodiazepines among those who start them,1 whereas age-related decreases in the odds of benzodiazepine use disorders are consistent with greater impulsivity31 and rates of substance use disorders among younger individuals.32 Being divorced or separated or being never married was also associated with benzodiazepine use disorders, consistent with findings for other substance use disorders.32
Among benzodiazepine users, 17.1% reported misusing benzodiazepines at least once in 2015. Less than 20% of these individuals reported that their main motivation for their most recent misuse was to experiment, get high, or modify the effect of other drugs, whereas more than two thirds reported that their main reason for misuse was to help sleep or to relieve tension, suggesting that better management of insomnia and anxiety symptoms could have a substantial effect on reducing benzodiazepine misuse. Cognitive-behavioral therapy, SSRIs, and other evidence-based anti-anxiety medications may be particularly useful for these patients.33
Among benzodiazepine misusers, 20.5% obtained them directly from a doctor, whereas 53.0% obtained them from a friend or relative for free, 80.4% of whom, in turn, obtained them from a doctor. Our results, consistent with the findings on sources of prescription opioids that are misused, underscore the importance of interventions targeting medication sharing, selling, and diversion.34–35 Other important interventions include routine use of prescription drug–monitoring programs to identify patients who have aberrant prescription patterns suggesting misuse of benzodiazepines or other controlled substances, and screening patients for increased risk for misusing prescription medications before prescribing benzodiazepines.
Better training of primary care physicians, who prescribe the majority of benzodiazepine prescriptions, is essential to achieve these goals.1 Furthermore, because only about 10% of individuals with substance use disorders receive substance use disorder treatment in any given year,35 primary care physicians are crucial to identify, motivate for treatment, and refer individuals who misuse benzodiazepines to appropriate treatment. Recently approved Medicare payments for behavioral health integration may also facilitate consultations between primary care physicians and psychiatrists for the management of complex patients.36
This study has several limitations. First, because of the cross-sectional nature of NSDUH, this study cannot establish causal relationships. Second, some CIs around the strong associations with other substance use disorders are wide, which indicate limited precision of the estimates. Third, our analyses are based on DSM-IV criteria. Analyses based on DSM-5 criteria may have yielded different results. Finally, NSDUH data are subject to recall and social-desirability biases.
In conclusion, while benzodiazepine use is highly prevalent among U.S. adults, benzodiazepine use disorders are relatively rare among benzodiazepine users. Benzodiazepine misuse is more common and appears related to attempts to relieve symptoms of tension or to help with sleep, suggesting that improved treatment of these symptoms might decrease benzodiazepine misuse. The most common sources of misused benzodiazepines are friends or relatives who give them to friends or relatives for free or sell them to the individual who misuses them. Our results help to better characterize benzodiazepine users, identify adults at risk for misuse and use disorders, and stimulate further research to prevent diversion and misuse of benzodiazepines.
Role of the Funding Source:
This study was jointly sponsored by the National Institute on Drug Abuse of the National Institutes of Health and the Substance Abuse and Mental Health Services Administration. The sponsors supported the authors who were responsible for preparation, review, and approval of the manuscript and the decision to submit the manuscript for publication. The sponsors had no role in the design and conduct of the study; analysis and interpretation of the data; preparation and review of the manuscript; or decision to submit the manuscript for publication. The sponsors reviewed and approved the manuscript.
Appendix Table 1. Main motivation for benzodiazepine misuse among adults with past 12-month misuse and use disorder whose last prescription tranquilizer or sedative misuse was benzodiazepine
| Main motivation for misuse | Among adults reporting misuse without use disorder (n=2,600a) Weighted % (SE) | Among adults reporting benzodiazepine use disorder (n=300a) Weighted % (SE) |
|---|---|---|
| Relax or relieve tension | 47.1 (1.42)b | 38.2 (4.14) |
| Experiment; get high; hooked; increase/decrease effects of other drugs | 18.5 (0.95)b | 24.6 (3.18) |
| Help with sleep | 23.1 (1.29)b | 14.9 (3.11) |
| Help with emotions | 9.6 (0.78)b | 20.3 (3.16) |
| Other reasons | 1.8 (0.40) | 2.1 (0.91) |
SAMHSA requires that any description of overall sample sizes based on the restricted-use data files has to be rounded to the nearest 100, which intends to minimize potential disclosure risk.
The estimate is statistically different from the corresponding estimate for those with benzodiazepine use disorders (p<0.05).
Abbreviation: SE= standard error.
Appendix Table 2. Source of benzodiazepine obtained for the most recent episode of misuse among adults with past 12-month misuse and use disorders whose last prescription tranquilizer or sedative misuse was benzodiazepine
| Source for the most recent episode of misuse | Adults reporting misuse without use disorder (n=2,600a) Weighted % (SE) | Adults reporting benzodiazepine use disorder (n=300a) Weighted % (SE) |
|---|---|---|
| Free from friend/relative | 56.1 (1.43)b | 20.9 (3.31) |
| From doctor(s) | 18.5 (1.28)b | 40.8 (4.12) |
| Bought from friend/relative | 11.8 (0.82) | 16.3 (2.84) |
| From drug dealer/stranger | 6.8 (0.70)b | 16.7 (2.68) |
| Took from friend/relative without asking | 3.0 (0.44) | 2.3 (1.20) |
| Other ways | 3.8 (0.51) | 2.9 (1.15) |
SAMHSA requires that any description of overall sample sizes based on the restricted-use data files has to be rounded to the nearest 100, which intends to minimize potential disclosure risk.
The estimate is statistically different from the corresponding estimate for those with benzodiazepine use disorders (p<0.05).
Abbreviation: SE= standard error.
Footnotes
Conflict of Interest Disclosures: Unrelated to the submitted work, Compton reports ownership of stock in General Electric Co., 3M Co., and Pfizer Inc., and Blanco reports ownership of stock in General Electric, Sanofi, and Eli Lilly, Inc. Han, Johnson, and Jones have no conflicts to disclose.
Disclaimers: The findings and conclusions of this study are those of the authors and do not necessarily reflect the views of the Substance Abuse and Mental Health Services Administration, the National Institute on Drug Abuse of the National Institutes of Health, or the U.S. Government.
REFERENCES:
- 1.Olfson M, King M, Schoenbaum M. Benzodiazepine Use in the United States. Jama Psychiatry 2015. Feb;72(2):136–142. [DOI] [PubMed] [Google Scholar]
- 2.Alessi-Severini S, Bolton JM, Enns MW, et al. Sustained use of benzodiazepine and escalation to high doses in a Canadian population. Psychiatric Services 2016;67(9):1012–1018. [DOI] [PubMed] [Google Scholar]
- 3.Blanco C, Goodwin RD, Liebowitz MR, Schmidt AB, Lewis-Fernández R, Olfson M. Use of psychotropic medications for patients with office visits who receive a diagnosis of panic disorder. Medical Care 2004;42(2):1242–1246. [DOI] [PubMed] [Google Scholar]
- 4.Martins S, Fenton M, Keyes K, Blanco C, Zhu H, Storr C. Mood and anxiety disorders and their association with non-medical prescription opioid use and prescription opioid-use disorder: longitudinal evidence from the National Epidemiologic Study on Alcohol and Related Conditions. Psychological Medicine 2012;42:1261–1272. [DOI] [PMC free article] [PubMed] [Google Scholar]
- 5.Blanco C, Iza M, Schwartz RP, Rafful C, Wang S, Olfson M. Probability and predictors of treatment-seeking for prescription opioid use disorders: A National Study. Drug Alcohol Depend in Press. [DOI] [PMC free article] [PubMed] [Google Scholar]
- 6.Compton WM, Volkow ND. Abuse of prescription drugs and the risk of addiction. Drug Alcohol Depend 2006;83:S4–S7. [DOI] [PubMed] [Google Scholar]
- 7.Blanco C, Alderson D, Ogburn E, et al. Changes in the prevalence of non-medical prescription drug use and drug use disorders in the United States: 1991–1992 and 2001–2002. Drug and Alcohol Dependence 2007;90(2):252–260. [DOI] [PubMed] [Google Scholar]
- 8.Simoni-Wastila L, Strickler G. Risk factors associated with problem use of prescription drugs. American Journal of Public Health 2004;94(2):266–268. [DOI] [PMC free article] [PubMed] [Google Scholar]
- 9.Hernandez SH, Nelson LS. Prescription drug abuse: insight into the epidemic. Clinical Pharmacology & Therapeutics 2010;88(3):307–317. [DOI] [PubMed] [Google Scholar]
- 10.Smink BE, Egberts ACG, Lusthof KJ, Uges DRA, Gier JJd. The relationship between Benzodiazepine use and traffic accidents: a systematic literature review. CNS Drugs 2010;24(8):639–653. [DOI] [PubMed] [Google Scholar]
- 11.Jones CM, McAninch JK. Emergency Department Visits and Overdose Deaths From Combined Use of Opioids and Benzodiazepines. American Journal of Preventive Medicine 2015. Oct;49(4):493–501. [DOI] [PubMed] [Google Scholar]
- 12.Hwang CS, Kang EM, Kornegay CJ, Staffa JA, Jones CM, McAninch JK. Trends in the concomitant prescribing of Opioids and Benzodiazepines, 2002–2014. American Journal of Preventative Medicine 2016;51(2):151–160. [DOI] [PubMed] [Google Scholar]
- 13.Hall AJ, Logan JE, Toblin RL. Patterns of abuse among unintentional pharmaceutical overdose fatalities. Jama 2008;300(22):2613–2620. [DOI] [PubMed] [Google Scholar]
- 14.McCabe SE, Cranford JA, Boyd CJ. The relationship between past-year drinking behaviors and nonmedical use of prescription drugs: Prevalence of cooccurrence in a national sample. Drug Alcool Dependance 2006;84(3):281–288. [DOI] [PMC free article] [PubMed] [Google Scholar]
- 15.Blanco C, Rafful C, Wall MM, Jin CJ, Kerridge B, Schwartz RP. The latent structure and predictors of non-medical prescription drug use and prescription drug use disorders: A National Study. Drug and alcohol dependence 2013;doi:pii: S0376–8716(13)00276–7. 10.1016/j.drugalcdep.2013.07.011. [Epub ahead of print]. [DOI] [PMC free article] [PubMed] [Google Scholar]
- 16.McCabe SE, Cranford JA, West BT. Trends in prescription drug abuse and dependence, cooccurrence with other substance use disorders, and treatment utilization: Results from two national surveys. Addictive Behaviors 2008;33(10):1297–1305. [DOI] [PMC free article] [PubMed] [Google Scholar]
- 17.Hopko EAM DR, Robertson SM, et al. Brief behavioral activation and problem-solving therapy for depressed breast cancer patients: randomized trial. Journal of consulting and clinical psychology 2011;79(6):834–849. [DOI] [PubMed] [Google Scholar]
- 18.Hughes A, Williams M, Lipari R, Bose J, Copello E, Kroutil L. Results from the 2015 National Survey on Drug Use and Health. NSDUH Data Review (September 2016). http://www.samhsa.gov/data/sites/default/files/NSDUH-FFR2-2015/NSDUH-FFR2-2015.htm; 2016. [Google Scholar]
- 19.Jennrich RI, Bentler PM. Exploratory bi-factor analysis. Psychometrika 2011;76(4):537–549. [DOI] [PMC free article] [PubMed] [Google Scholar]
- 20.Shiffman S, Waters A, Hickcox M. The nicotine dependence syndrome scale: a multidimensional measure of nicotine dependence. Nicotine Tob Res 2004. Apr;6(2):327–348. [DOI] [PubMed] [Google Scholar]
- 21.Grucza RA, Abbacchi AM, Przybeck TR, Gfroerer JC. Discrepancies in estimates of prevalence and correlates of substance use and disorders between two national surveys. Addiction 2007. Apr;102(4):623–629. [DOI] [PMC free article] [PubMed] [Google Scholar]
- 22.Jordan BK, Karg RS, Batts KR, Epstein JF, Wiesen C. A clinical validation of the National Survey on Drug Use and Health Assessment of Substance Use Disorders. Addictive Behaviors 2008. Jun;33(6):782–798. [DOI] [PubMed] [Google Scholar]
- 23.Zhang QC, Gou YZ, Wang H, Jian K, Wang YF. A new simple way to polyzirconocenesilane for lightweight polymer-derived Zr/Si/C/O ceramic foams with electromagnetic wave-absorbing and high temperature-resistant properties. Mater Design 2017. Apr 15;120:90–98. [Google Scholar]
- 24.Research Triangle Institute. Software for Survey Data Analysis (SUDAAN) Language Manual, Release 10.0. Research Triangle Park, NC: Research Triangle Institute. 2008. [Google Scholar]
- 25.Iza M, Olfson M, Vermes D, Hoffer M, Wang S, Blanco C. Probability and predictors of first treatment contact for anxiety disorders in the United States: analysis of data from the National Epidemiologic Survey on Alcohol and Related Conditions (NESARC). J Clin Psychiatry 2013. Nov;74(11):1093–1100. [DOI] [PubMed] [Google Scholar]
- 26.Shahly V, Berglund PA, Coulouvrat C, et al. The Associations of Insomnia With Costly Workplace Accidents and Errors Results From the America Insomnia Survey. Archives of General Psychiatry 2012. Oct;69(10):1054–1063. [DOI] [PubMed] [Google Scholar]
- 27.Compton WM, Han B, Jones CM, Blanco C, Hughes A. Marijuana use and use disorders in adults in the USA, 2002–14: analysis of annual cross-sectionsal surveys. The Lancet Psychiatry 2016;3(10):954–964. [DOI] [PubMed] [Google Scholar]
- 28.Hasin DS, Saha TD, Kerridge BT, al. e. Prevalence of Marijuana use disorders in the United States between 2001–2002 and 2012–2013. Jama Psychiatry 2015;72(12):1235–1242. [DOI] [PMC free article] [PubMed] [Google Scholar]
- 29.Blanco C, Rubio J, Wall M, Wang S, Jiu CJ, Kendler KS. Risk factors for anxiety disorders: common and specific effects in a national sample. Depress Anxiety 2014. Sep;31(9):756–764. [DOI] [PMC free article] [PubMed] [Google Scholar]
- 30.Grant B, Saha T, Ruan W, et al. Epidemiology of DSM-5 Drug Use Disorder: Results From the National Epidemiologic Survey on Alcohol and Related Conditions-III. JAMA Psychiatry 2016;73(1):39–47. [DOI] [PMC free article] [PubMed] [Google Scholar]
- 31.Chamorro J, Bernardi S, Potenza MN, et al. Impulsivity in the general population: a national study. J Psychiatr Res 2012. Aug;46(8):994–1001. [DOI] [PMC free article] [PubMed] [Google Scholar]
- 32.Compton WM, Thomas YF, Stinson FS, Grant BF. Prevalence, correlates, disability, and comorbidity of DSM-IV drug abuse and dependence in the United States: results from the national epidemiologic survey on alcohol and related conditions. Archives of general psychiatry 2007;64(5):566–576. [DOI] [PubMed] [Google Scholar]
- 33.Bandelow B, Sher L, Bunevicius R, et al. WFSBP Task Force on Mental Disorders in Primary Care.; WFSBP Task Force on Anxiety Disorders, OCD and PTSD. Guidelines for the pharmacological treatment of anxiety disorders, obsessive-compulsive disorder and posttraumatic stress disorder in primary care. Int J Psychiatry Clin Pract 2012;16(2):77–84. [DOI] [PubMed] [Google Scholar]
- 34.Compton WM, Jones CM, Baldwin GT. Relationship between nonmedical prescription-opioid use and Heroin use. New England Journal of Medicine 2016;374(2):154–163. [DOI] [PMC free article] [PubMed] [Google Scholar]
- 35.Blanco C, Iza M, Rodríguez-Fernández J, Baca-García E, Wang S, Olfson M. Probability and predictors of treatment-seeking for substance use disorders in the U.S. Drug Alcohol Dep 2015;149(1):136–144. [DOI] [PMC free article] [PubMed] [Google Scholar]
- 36.Press M, Howe R, Schoenbaum M, et al. Medicare Payment for Behavioral Health Integration. N Engl J Med 2017;376(5):405–407. [DOI] [PubMed] [Google Scholar]