. 2023 Jun 29;12:e85492. doi: 10.7554/eLife.85492

Figure 3. Published graphs and selected alternative models from three studies for which we explored alternative admixture graph (AG) fits.

Figure 3.

In all cases, we selected a temporally plausible alternative model that fits nominally or significantly better than the published model and has important qualitative differences compared to the published model with respect to the interpretation about population relationships. In all but one case, the model has the same complexity as the published model shown on the left with respect to the number of admixture events; the exception is the re-analysis of the Librado et al., 2021 horse dataset since the published model with three admixture events is a poor fit (worst Z-score comparing the observed and expected f-statistics has an absolute value of 23.9 even when changing the composition of the population groups to increase their homogeneity and improve the fit relative to the composition used in the published study). For this case, we show an alternative model with 8 admixture events that fits well and has important qualitative differences from the point of view of population history interpretation. The existence of well-fitting AG models does not mean that the alternative models are the correct models; however, their identification is important because they prove that alternative reasonable scenarios exist that are qualitatively different from published models. Model parameters (graph edges) that were inferred to be unidentifiable (see Appendix 1, Section 2.F) are plotted in red. (a) The graph published by Bergström et al., 2020 (on the left) and a nominally better fitting graph for dogs that is more congruent to human history (on the right). For both species, Baikal and Native American groups are mixed between European- and East Asian-related lineages, and a ‘Basal Eurasian’ lineage contributes to West Asian groups; these features are all characteristic of human history but absent in the published dog graph. (b) The graph published by Librado et al., 2021 (modified population composition, on the left) and a significantly better fitting AG that is temporally and geographically plausible (on the right). In contrast to the published graph, in this graph with eight mixture events (the minimum necessary to obtain an acceptable statistical fit to the data), a lineage maximized in horses associated with Yamnaya steppe pastoralists or their Sintashta descendants (C-PONT, TURG, or DOM2) contributes a substantial proportion of ancestry to the horses from the Corded Ware Complex (CWC). Thus, in this model both CWC humans and horses are mixtures of Yamnaya and European farmer-associated lineages. This is qualitatively different from the suggestion that there was no Yamnaya-associated contribution to CWC horses which was a possibility raised in the paper. The AG with eight admixture events is also different from the published model in that it shows a fitting model where the Tarpan horse does not have the history claimed in the study (as an admixture of the CWC and DOM2 horses). (c) The graph published by Hajdinjak et al., 2021 (on the left) and a significantly better fitting AG, but without a specific lineage shared between the Bacho Kiro Initial Upper Paleolithic group and East Asians (on the right). In this model, all the lineages shared between Bacho Kiro IUP and East Asians contributed a large fraction of the ancestry of later European hunter–gatherers as well, and thus this graph does not imply distinctive shared ancestry between the earliest modern humans in Europe and later people in East Asia, and instead could be explained by a quite different and also archaeologically plausible scenario of a primary modern human expansion out of West Asia contributing serially to the major lineages leading to Bacho Kiro, then later East Asians, then Ust’-Ishim, then the primary ancestry in later European hunter–gatherers.

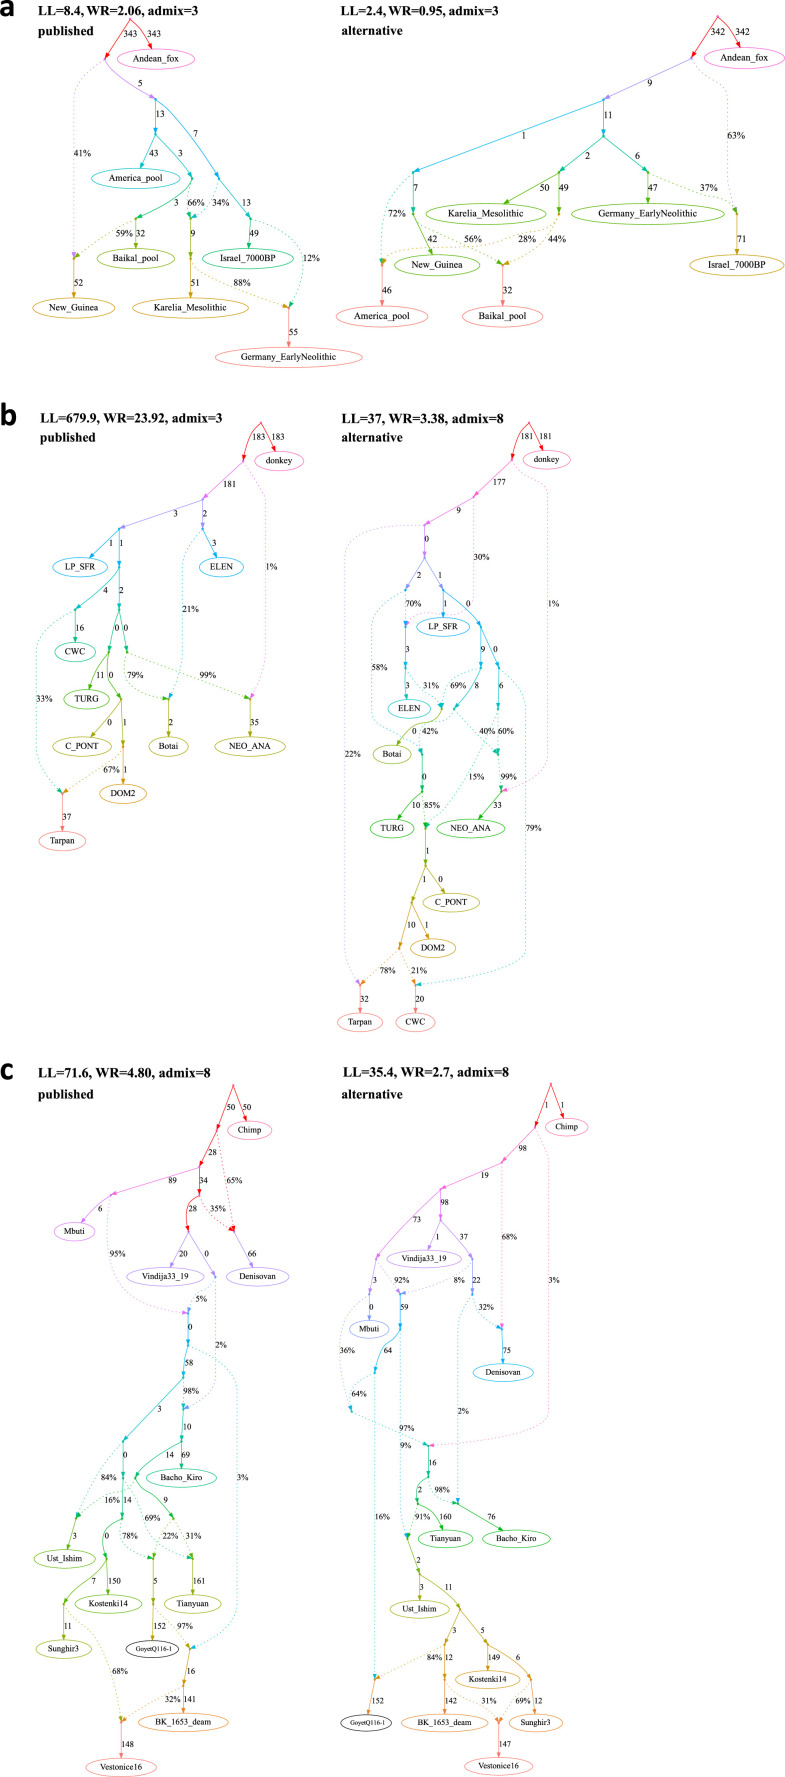
Figure 3—source data 1. The published (Bergström et al., 2020) and alternative admixture graphs for dogs found with findGraphs.
Model parameters (graph edges) that were inferred to be unidentifiable are plotted in red. (a) The published model, (b) alternative models fitting nominally better than the published one, sorted by the fit score, and (c) alternative models fitting nominally or significantly (the graph framed in blue) better than the published one, sorted by the fit score.
Figure 3—source data 2. Alternative admixture graphs for humans found with findGraphs for the dataset from Bergström et al., 2020.
Model parameters (graph edges) that were inferred to be unidentifiable are plotted in red. (a, b) Best-fitting models for humans sorted by the fit score.
Figure 3—source data 3. The published admixture graph from Lazaridis et al., 2014 and alternative graphs found with findGraphs (seven populations, four admixture events).
Model parameters (graph edges) that were inferred to be unidentifiable are plotted in red. (a) The re-fitted published graph and (b) 10 examples of graphs inferred by findGraphs (arranged according to LL score) and fitting significantly (the graph framed in blue) or nominally better than the published model.
Figure 3—source data 4. The published admixture graph from Shinde et al., 2019 and alternative graphs found with findGraphs (8 pops., 3 adm. events) relying on the original set of SNPs and group composition, and original (incorrect) algorithm for calculating f-statistics.
Model parameters (graph edges) that were inferred to be unidentifiable are plotted in red. (a) The published model; the original set of SNPs and individuals, and the original algorithm for calculating f3-statistics was used (470,389 variable sites with no missing data at the group level available). The following claim in Shinde et al., 2019 relies on the admixture graph: Primary ancestry in the Indus Periphery group forms the deepest branch in the Iranian Neolithic clade composed of the Indus Periphery, Ganj Dareh Neolithic, Hajji Firuz Neolithic, and Tepe Hissar Chalcolithic groups. (b-f) Selected alternative models fitting significantly better (graphs framed in blue), nominally better (graphs without frames), or not significantly worse (graphs framed in red) than the published one.
Figure 3—source data 5. The published admixture graph from Shinde et al., 2019 and alternative graphs found with findGraphs (eight populations, three admixture events) for the modified group composition and using the updated algorithm for calculating f-statistics.
The graphs were also re-fitted on the original set of single-nucleotide polymorphisms (SNPs)/individuals and using the original algorithm for calculating f-statistics. Model parameters (graph edges) that were inferred to be unidentifiable are plotted in red. (a) The published model with three admixture events. The following claim in Shinde et al., 2019 relies on the admixture graph: Primary ancestry in the Indus Periphery group forms the deepest branch in the Iranian Neolithic clade composed of the Indus Periphery, Ganj Dareh Neolithic, Hajji Firuz Neolithic, and Tepe Hissar Chalcolithic groups. (b) Alternative models fitting nominally better than the published one and confirming all of its important topological details and (c) alternative models fitting not significantly worse than the published one and differing from it in important ways.
Figure 3—source data 6. Alternative graphs allowing for an additional admixture event found with findGraphs for the dataset from Shinde et al., 2019: 8 populations, 4 admixture events, the modified group composition, and the updated algorithm for calculating f-statistics.
The graphs were also re-fitted on the original set of single-nucleotide polymorphisms (SNPs)/individuals and using the original algorithm for calculating f-statistics. Model parameters (graph edges) that were inferred to be unidentifiable are plotted in red. (a) The highest-ranking model with four admixture events that confirms all important features of the published model with three admixture events. The following claim in Shinde et al., 2019 relies on the admixture graph: Primary ancestry in the Indus Periphery group forms the deepest branch in the Iranian Neolithic clade composed of the Indus Periphery, Ganj Dareh Neolithic, Hajji Firuz Neolithic, and Tepe Hissar Chalcolithic groups. (b) Alternative models fitting not significantly worse than the highest-ranking one and contradicting the historical interpretation of the admixture graph results by Shinde et al., 2019.
Figure 3—source data 7. The published admixture graphs from Librado et al., 2021 and alternative graphs found with findGraphs (10 populations, 3–5 admixture events) for the modified group composition and using the updated algorithm for calculating f-statistics.
The graphs were also re-fitted on the original set of single-nucleotide polymorphisms (SNPs)/individuals and using the original algorithm for calculating f-statistics. Selected alternative graphs found with findGraphs when more admixture events were allowed (from 6 to 9) are also shown. Model parameters (graph edges) that were inferred to be unidentifiable are plotted in red. (a) The published model, three admixture events. The following claims in Librado et al., 2021 rely on the admixture graph: (1) NEO-ANA-related admixture is absent in DOM2; (2) DOM2 and C-PONT are sister groups; (3) there is no gene flow connecting the CWC group and the cluster associated with Yamnaya horses and horses of the later Sintashta culture whose ancestry is maximized in the Western Steppe (DOM2, C-PONT, and TURG); (4) there was a gene flow from a deep-branching ghost group to NEO-ANA; (5) Tarpan is a mixture of a CWC-related and a DOM2-related lineage. (b) An alternative model with three admixture events fitting significantly better than the published one, (c) the published model, four admixture events, (d) an alternative model with four admixture events fitting not significantly worse than the published one, (e) the published model, five admixture events, (f) an alternative model with five admixture events fitting not significantly worse than the published one, (g) selected models with six admixture events, (h,i) selected models with seven admixture events (all plausible models with WR < 5 SE), (j-l) selected models with eight admixture events (all plausible models with WR < 4 SE), (m-r) selected models with nine admixture events (all plausible models with WR < 4 SE).
Figure 3—source data 8. Published admixture graph from Hajdinjak et al., 2021 and alternative graphs found with findGraphs (12 populations, 8 admixture events).
Model parameters (graph edges) that were inferred to be unidentifiable are plotted in red. (a, b) The published model and its simplified representation. The following claims in Hajdinjak et al., 2021 rely on the admixture graph: (1) gene flow from the Bacho Kiro lineage to Ust’-Ishim, Tianyuan, and GoyetQ116-1; (2) the BK1653 individual belonged to a population that was related, but not identical, to that of the GoyetQ116-1 individual; (3) Vestonice is a mixture of a Sunghir-related and a BK1653-related lineage. (c-e) Selected alternative models fitting significantly better than the published one.