. 2023 Jun 29;12:e85492. doi: 10.7554/eLife.85492

Figure 4. Published graphs and selected alternative models from three further studies for which we explored alternative admixture graph (AG) fits.

Figure 4.

(a) The graph published by Lipson et al., 2020b (on the left) and a nominally better fitting AG (on the right). In contrast to the published graph, there is no single lineage specific to modern rainforest hunter–gatherers (Biaka and Mbuti) and Shum Laka (Cameroon_SMA). Rather, the primary ancestries in each group are separate deep-branching lineages (the deeper lineage they all share is also the source of the majority of ancestry in all anatomically modern humans modeled here). In contrast to the graph in the published paper, there is no West African-maximized ancestry present in mixed form in Biaka, Mbuti, and Shum Laka; archaic admixture is not limited to a subset of Africans but is present in all anatomically modern humans in various proportions; and there is no ghost modern human ancestry in Agaw, Biaka, Lemande, Mbuti, Mende, Mota, Shum Laka, and Yoruba. (b) The admixture graph published by Wang et al., 2021 (on the left) and a significantly better fitting AG meeting the constraints used to inform model building in the published paper (on the right). The finding of Onge-related admixture that is widespread in East Asia suggesting an early peopling via a coastal route is not a feature of this model. (c) The admixture graph published by Sikora et al., 2019 (simplified "Western" graph, on the left) and a nominally better fitting AG (on the right). The striking feature of the AG suggested in the paper whereby Mal’ta (MA1_ANE) derives some ancestry from a CHG-associated lineage is not a feature of this alternative model.

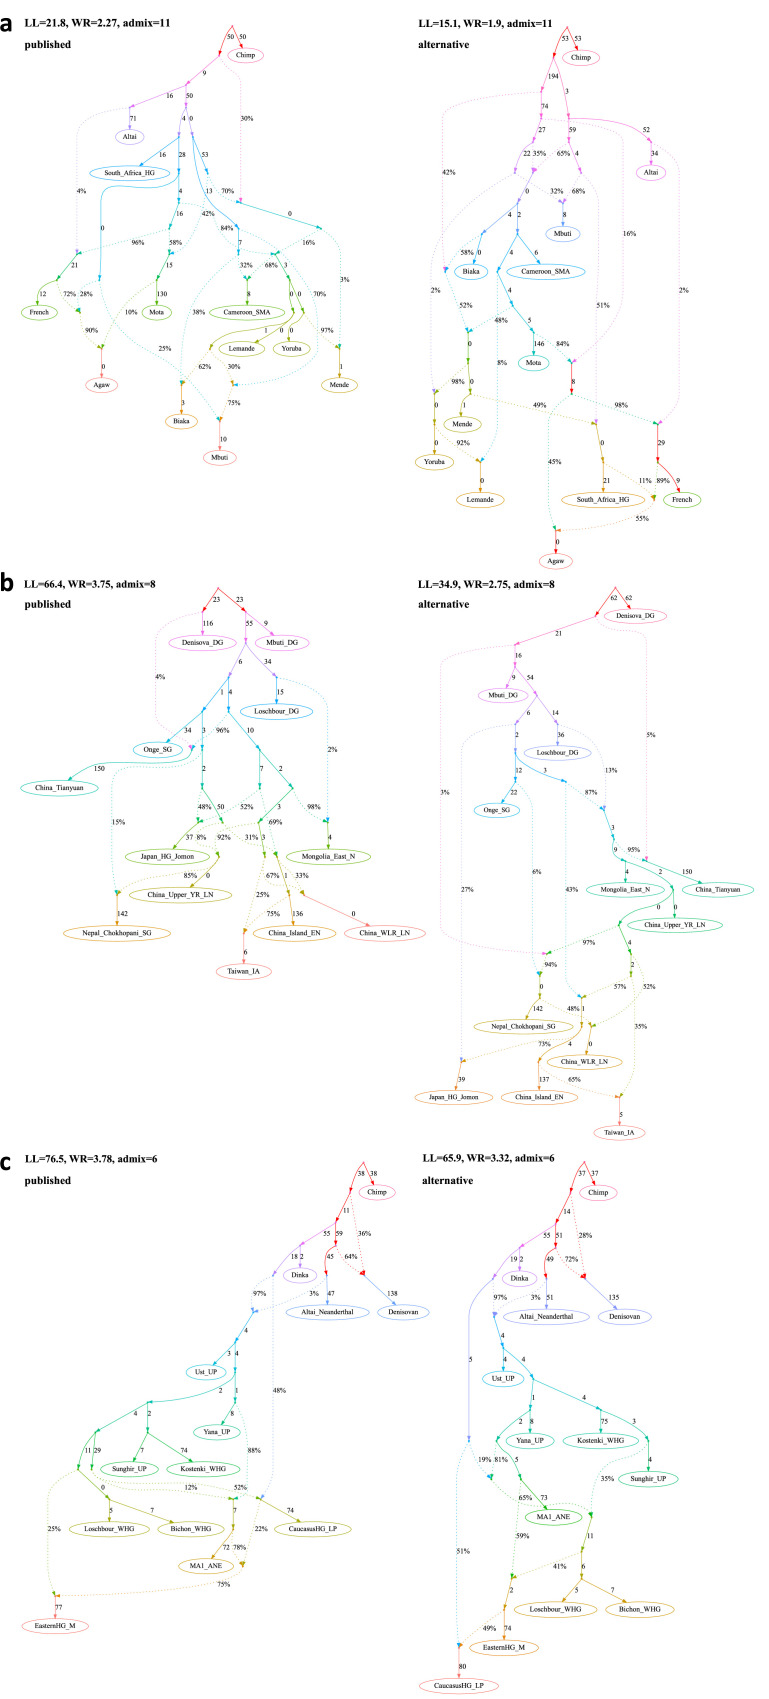
Figure 4—source data 1. The published admixture graph from Lipson et al., 2020b and alternative graphs found with findGraphs (12 populations, 11 admixture events) using the updated algorithm for calculating f-statistics.
The graphs were also re-fitted using the original algorithm for calculating f-statistics. Model parameters (graph edges) that were inferred to be unidentifiable are plotted in red. (a, b) The published model and its simplified representation. Below we list selected claims by Lipson et al., 2020b relying on the admixture graph: (1) A lineage maximized in present-day West African groups (Lemande, Mende, and Yoruba) also contributed some ancestry to the ancient Shum Laka individual, and present-day Biaka and Mbuti; (2) another ancestry component in Shum Laka is a deep-branching lineage maximized in rainforest hunter–gatherers Biaka and Mbuti; (3) ‘super-archaic’ ancestry (i.e., diverging at the modern human/Neanderthal split point or deeper) contributed to Biaka, Shum Laka, Mbuti, Lemande, Mende, and Yoruba; (4) a ghost modern human lineage (or lineages) contributed to Agaw, Mota, Biaka, Shum Laka, Mbuti, Lemande, Mende, and Yoruba. (c-q) Selected alternative models fitting nominally better than the published one.
Figure 4—source data 2. The published admixture graph from Wang et al., 2021 and alternative graphs found with findGraphs (12 populations, 8 admixture events) using the updated algorithm for calculating f-statistics.
The graphs were also re-fitted using the original algorithm for calculating f-statistics. Model parameters (graph edges) that were inferred to be unidentifiable are plotted in red. (a, b) The published model and its simplified representation. The following claim in Wang et al., 2021 relies on the admixture graph: There is Onge-related admixture in the Jomon (Japan_HG_Jomon), Tibetan (Nepal_Chokhopani_SG), Upper Yellow River Late Neolithic (China_Upper_YR_LN), West Liao River Late Neolithic (China_WLR_LN), Taiwan Iron Age (Taiwan_IA), and China Island Early Neolithic (Liangdao, China_Island_EN) lineages. (c-l) Alternative models fitting significantly better than the published one.
Figure 4—source data 3. The simplified published admixture graph for West Eurasian groups from Sikora et al., 2019 and alternative graphs found with findGraphs (13 populations, 6 admixture events).
Model parameters (graph edges) that were inferred to be unidentifiable are plotted in red. (a) The published model, with chimpanzee added as an outgroup and four low-level gene flows from the Neanderthal lineage dropped. The following claim in Sikora et al., 2019 relies on the admixture graph: The Mal'ta (MA1_ANE) lineage receives a gene flow from the Caucasus hunter-gatherer (CaucasusHG_LP) lineage. (b-h) Models fitting nominally better than the published one and not supporting the claim, (i) models fitting nominally better than the published one and supporting the claim.
Figure 4—source data 4. The simplified published admixture graph for East Eurasian groups from Sikora et al., 2019 and alternative graphs found with findGraphs (14 populations, 6 admixture events).
Model parameters (graph edges) that were inferred to be unidentifiable are plotted in red. (a) The published model, with chimpanzee added as an outgroup and four low-level gene flows from the Neanderthal lineage dropped. (b) The published model simplified by dropping unidentifiable edges. The following claims in Sikora et al., 2019 rely on the admixture graph: (1) The Mal’ta (MA1_ANE) and Yana (Yana_UP) lineages receive a gene flow from an Asian source diverging before the Devil’s Cave (DevilsCave_N), Kolyma (Kolyma_M), USR1 (Alaska_LP), and Clovis (Clovis_LP) lineages; (2) European ancestry in the Kolyma, USR1, and Clovis lineages is closer to Mal’ta than to Yana; (3) The Devil’s Cave lineage receives no European-related gene flows, and Kolyma has less European-related ancestry than ancient Americans (USR1 and Clovis). (c) An alternative model fitting nominally better than the published one and supporting all three claims, (d-g) alternative models fitting not significantly worse than the published model.