

Abstract
Tissue chip (TC) devices, also known as microphysiological systems (MPS) or organ chips (OCs or OoCs), seek to mimic human physiology on a small scale. They are intended to improve upon animal models in terms of reproducibility and human relevance, at a lower monetary and ethical cost. Virtually all TC systems are analyzed at an endpoint, leading to widespread recognition that new methods are needed to enable sensing of specific biomolecules in real time, as they are being produced by the cells. To address this need, we incorporated photonic biosensors for inflammatory cytokines into a model TC. Human bronchial epithelial cells seeded in a microfluidic device were stimulated with lipopolysaccharide, and the cytokines secreted in response sensed in real time. Sensing analyte transport through the TC in response to disruption of tissue barrier was also demonstrated. This work demonstrates the first application of photonic sensors to a human TC device, and will enable new applications in drug development and disease modeling.
Introduction
Animal studies currently are the gold standard for research on disease pathophysiology and for preclinical drug development. While animals have appropriately complex physiology on an organ level, these studies often fail to translate to humans due to the genetic differences between animals and humans.1 Animal research is also labor-intensive and expensive, and incurs high ethical costs due to the large number of animals used to obtain statistical significance. In a similar vein, clinical studies done in humans contain the maximum level of complexity, and have obvious relevance to humans. However, heterogeneity between individuals in a sample population can distort the results,2 and very large sample sizes are needed to prove marginal effects.
In contrast, in vitro models are able to remove the heterogeneity confounding human and animal studies, and are less expensive and less labor-intensive. However, early in vitro studies lacked complexity, and thus yielded no information on the complex interactions occurring in tissues in vivo. This has led researchers to develop tissue chips (TCs; also known as organs-on-chips, OoCs, organ chips, OCs, or microphysiological systems, MPS) to study diseases and drug response.3,4 These TC models use microfluidic delivery systems and multiple cell types, sometimes employing a three-dimensional architecture, to mimic the complexity of a human organ system. This allows the study of disease and drug mechanisms with far greater fidelity than prior in vitro models, while removing the complications of genetic heterogeneity and lack of translation from animal and clinical studies. While genetic heterogeneity is a difficult reality of developing therapeutics, using genetically homogeneous sources (such as primary human cells or cell lines) can be useful for isolating basic mechanisms by removing the upstream or downstream factors that can be confounded by the complex gene pools involved in clinical trials. Additionally, the use of single-donor induced pluripotent stem cells as the starting point for TCs is anticipated to help identify patient-specific pathways in disease and therapeutic studies.5,6
A key limitation with TCs reported to date is the dearth of methods available to determine real-time responses of cells to stimuli in situ. Existing TC models are able to measure parameters including media oxygenation,7–9 pH,10,11 or glucose content.12,13 Some use fluorescent markers or fluorescently-labeled antibodies to measure permeability of tissue barriers14,15 or track specific analytes in separate endpoint assays.16 However, these methods rely on the availability of fluorescent tags, and their addition risks disturbing the system.
Recently, a few models have incorporated antibody-based electrochemical sensors serially in microfluidic tissue chips.17,18 These represent an important first step, but incorporation of the sensors relatively far from the cellular source of the analytes being measured is less than ideal, due to loss of temporal and spatial information, as well as analyte dilution and loss to interior surfaces of the TC and microfluidic tubing. There is thus a recognized need in the field for methods enabling the incorporation of on-board, label-free sensors to measure the real-time dynamics of cellular interactions.19 Time-resolved data on cellular secretion would yield precise information on drug and protein interactions with different cell types, enhancing the efficiency and accuracy of therapeutic trials.
Additionally, barrier permeability is an important marker of dysfunction in many diseases. To that end, some MPS incorporate transendothelial electrical resistance (TEER) measurements.20,21 However, TEER has recognized limitations in its ability to determine overall barrier integrity in a model device, as even a small hole in the monolayer will greatly reduce TEER, even when most of the barrier has fully formed tight junctions. Some models have attempted to address this by either using movable electrodes22 or electrode arrays,23 but still lack specific biosensing capabilities.
Here, we demonstrate the use of photonic biosensors to measure the secretion of cytokines from cells in a TC in response to a stimulus, and to detect an exogenous analyte passing through a disrupted tissue barrier. Real-time detection of cytokine secretion is a goal for TCs because cytokines are important players in many inflammatory disease models, such as lung infection24,25 (akin to the model studied here), Alzheimer’s disease,26,27 and atopic dermatitis.28,29 Additionally, such pathophysiology has already been studied in TC models or in vitro endpoint assay experiments. To address challenges associated with downstream biosensing, the driving design parameter here was to incorporate the photonic biosensor in close proximity to the tissue culture substrate in order to maximize sensor performance.
In order to integrate photonic sensors with cell culture, we developed a two-channel microfluidic design, with the two channels flanking the apical and basal faces of the model barrier. A schematic of this platform is shown in Fig. 1a. Media flows in the top channel, and cellular secretion can be monitored by the photonic sensor integrated in the bottom channel (Fig. 1b and c). As a substrate for culturing cells, we utilized nanoporous silicon nitride (NPN) membranes, a well-established platform for microfluidic applications38 commercialized by SiMPore, Inc. (West Henrietta, NY). These membranes are less than 100 nm thick, allowing for free diffusion of biomolecules which are much smaller than the ~30 nm pores. A photonic biosensor chip is situated below the bottom channel. Analytes secreted by the cells or analytes introduced into the top channel moving through a disrupted barrier diffuse to the sensor chip, which can quantify the response in real time without any labels.
Fig. 1.
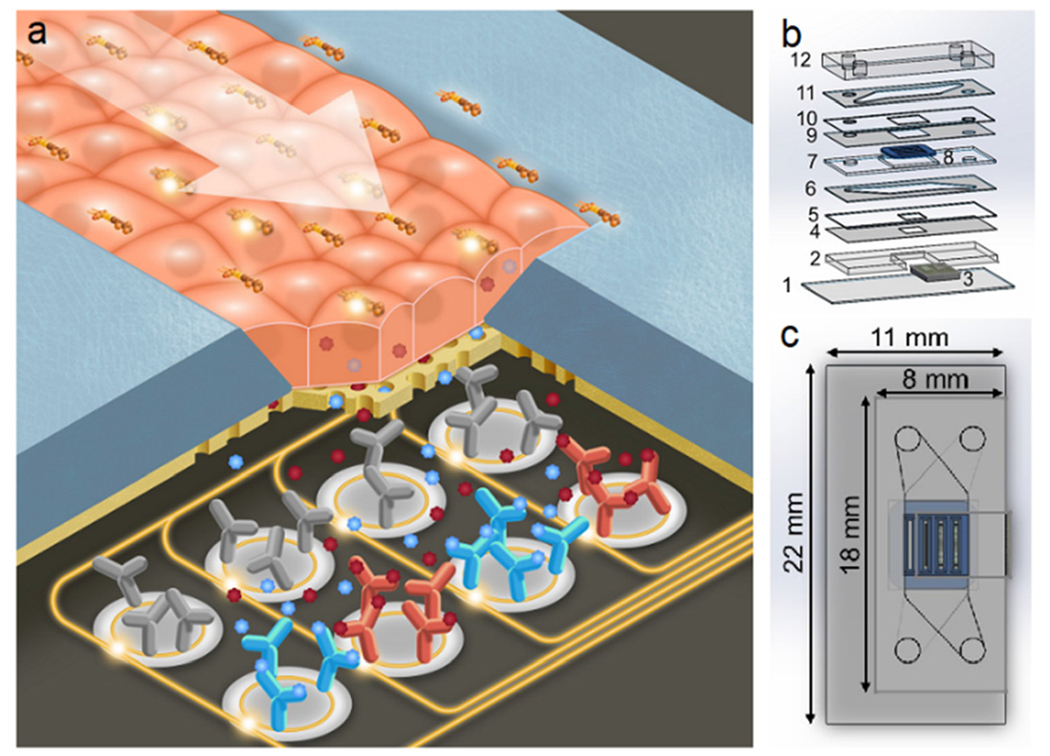
Photonic sensor-enabled tissue chip. a) Schematic of the working principle of the device. b) Exploded view with layers: 1) 170 μm glass coverslip, 2) 762 μm photonic chip holder, 3) photonic chip, 4) 57 μm adhesive sealing layer, 5) 127 μm silicone sealing layer, 6) 127 μm adhesive bottom channel, 7) 300 μm membrane chip holder, 8) four-slot nanoporous membrane chip, 9) 57 μm adhesive membrane sealing layer, 10) 100 μm silicone sealing layer, 11) 127 μm adhesive top channel, and 12) ~2 mm PDMS cap with inlets and outlets. c) Top view with outer dimensions of the device.
Photonic biosensors, and in particular ring resonators, have been studied extensively due to their label-free nature and high sensitivity.30,31 Ring resonator biosensors have also been commercialized (Genalyte, San Diego, CA; SiPhox, Burlington, MA, among others). Typically fabricated using standard CMOS processes in silicon or silicon nitride, ring resonators work by coupling light from a bus waveguide into adjacent rings producing resonances at certain wavelengths, according to the geometry of the ring and the effective refractive index of the medium in which the ring resonator sits. Since the electromagnetic field is not completely confined to the waveguides, it creates an evanescent field which decays in strength as a function of distance from the waveguide surface. This means that the resonant wavelength is affected by the refractive index of materials near (within ~100 nm) the waveguide. Thus, binding of high-refractive index materials (e.g., proteins) to antibody-functionalized waveguides will result in a shift of the resonant wavelength toward the red end of the spectrum in a manner that can be calibrated to provide a quantitative readout as a function of analyte concentration.
Resonance-based photonic sensors have been shown to have very high sensitivity when operating in label-free mode, and signal enhancement via flowing a sandwich antibody or other strategies can push this to the pg mL−1 level.32,33 However, the detection limits needed for a tissue chip platform are unclear. Clinical studies measure serum concentrations at single pg mL−1 or below.34,35 Dilution into the serum means that the concentrations of analytes near the tissue of interest are likely to be much higher. For example, a recent study found single-cell secretion of cytokines to be in the ng mL−1 range within a few tens of microns of the cell.36 Levels near fully developed tissue cultures or TC systems are unknown, and represent an important target of study and further motivation for our work.
For these experiments, bronchial epithelial cells of the 16HBE cell line were used, as they readily form tight monolayers in vitro.38,39 We have previously studied these cells in vitro in Transwells™ as a model barrier system for testing tight junction-disrupting peptides (TJDPs) and have verified that they produce a robust network of tight junctions.40 16HBEs have been shown to secrete inflammatory cytokines in response to stimulation with the bacterial endotoxin lipopolysaccharide (LPS), with an explicit timecourse.41–43 As a proof-of-concept, we sought to replicate this time course in our sensor-enabled microfluidic device by continuously flowing LPS over a monolayer of HBE cells, measuring the sensor response continuously over the course of several hours, with a photonic sensor chip functionalized with antibodies for IL-1β, IL-6, and CRP. Additionally, we demonstrated the utility of this platform for monitoring barrier integrity, by flowing CRP in the top channel and measuring it in the bottom channel before and after TJDP-mediated barrier disruption.
Methods
Photonic sensor chip design, fabrication, and functionalization
In collaboration with AIM Photonics in Albany, NY, we have developed designs and scalable manufacturing processes for silicon nitride photonic ring resonators, and have validated their use as biosensors.30,44,45 Results with these sensors suggested that their incorporation into a TC could suitably measure the secretion kinetics and concentrations of analytes. To that end, photonic ring resonator chips consisted of two banks of 14 ring resonators each. Each bank has an edge-coupled 8-waveguide array, with one input waveguide splitting into seven waveguides, and two ring resonators on each waveguide. The overall chip footprint is 5.8 × 4.0 mm, with the rings in a 7 × 2 ring array with 350 μm pitch in both directions (Fig. 2a). The rings on each waveguide were designed to resonate around 1550 and 1551 nm, with a free spectral range of 2.2 nm. Waveguide dimensions and coupling gaps were optimized based on simulation and previous work30,44 to provide the sharpest possible resonance peaks (i.e. highest possible quality factor, or Q) at these wavelengths, as narrow resonances allow for higher sensitivity measurements.31,46
Fig. 2.
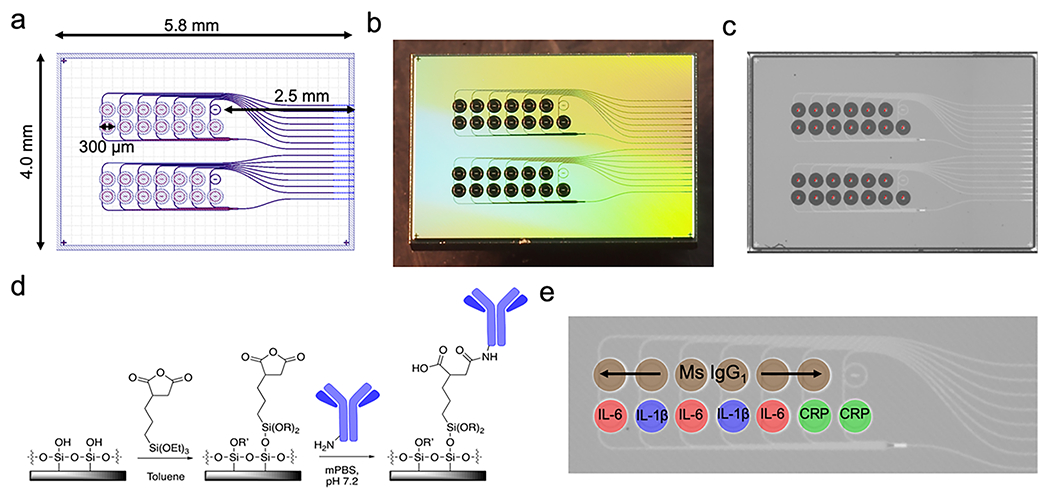
Photonic chip layout. a) Design in GDS (graphic design system) format used to produce photolithographic masks for the photonic chip. The overall footprint is 5.8 × 4.0 mm, with 2 banks of 7 × 2 ring resonators, each with a total diameter of 300 μm including the trench (open area in the top layer of SiO2 allowing direct contact between the ring resonator and analyte-containing solution). One temperature control ring (under oxide) is also provided in each bank. b) A photograph of the chip after fabrication and dicing. c) An image acquired by the microarrayer immediately after spotting shows reproducible spotting of antibody solutions and StabilGuard over the rings. The dark spots are ~250 pL drops settled in the ring trenches. d) Functionalization chemistry using a succinic anhydride-bearing silane. e) Photomicrograph of a ring bank, with the antibody layout superimposed.
Photonic sensor chips were fabricated using the 300 mm AIM Photonics fabrication line in Albany, NY that has been previously described,47 using proprietary photolithography protocols. Briefly, about 220 nm of silicon nitride is deposited on top of 5.3 μm of oxide and patterned to form the waveguides. A subsequent 5 μm oxide layer is deposited on top. This oxide layer is then patterned with photoresist and selectively etched, to reveal the ring resonators. The 5 μm-deep trenches surrounding the rings are accessible to spotting of specific antibodies or analytes directly on individual ring waveguides. Prior to functionalization, chips were cleaned with a 1 : 1 mixture of methanol and concentrated aqueous hydrochloric acid, rinsed three times with Nanopure water, and dried with a stream of nitrogen gas. They were then silanized via incubation in a 1% solution of 3-(triethoxysilyl)propyl succinic anhydride (Gelest, Morrisville, PA) in anhydrous toluene (distilled from Na metal under N2 atmosphere), rinsed for 5 minutes in pure anhydrous toluene, dried with N2 gas, and incubated at 110 °C for 30 minutes to allow the functional layer to completely anneal and evaporate any residual toluene. The functional chemistry is visualized in Fig. 2c.
After silanization, antibody solutions were printed on the rings using a Scienion SX SciFLEXarrayer piezoelectric microarrayer equipped with a PDC-60 capillary nozzle. The microarrayer produces droplets of a particular size depending on the diameter of the capillary nozzle and the electrical settings on the piezoelectric controller. Here, droplets of about 250 pL each were dispensed, and the number of droplets was chosen to yield about 3 nL total spotted on each ring. This results in the antibody solution filling the trench around each ring without spilling to the neighboring trenches. In these experiments, the top ring (as viewed in Fig. 2e) on each waveguide was spotted with mouse IgG1 isotype control antibody (R&D Systems, Minneapolis, MN) at 1000 μg mL−1. Mouse IgG1 isotype control antibodies were chosen to ideally match the nonspecific binding characteristics of the capture antibodies we used, which were all of the mouse IgG1 isotype. Subtracting the response of the control rings from the capture rings yields the response due only to specific binding of antibody/antigen pairs. The bottom rings were spotted with antibodies to IL-1β (R&D Systems) at 500 μg mL−1, IL-6 (Biolegend, San Diego, CA) at 650 μg mL−1, IL-8 (Sino Biological, Wayne, PA) at 1000 μg mL−1, and C-reactive protein (CRP; Ortho-Clinical Diagnostics, Rochester, NY) at 990 μg mL−1 (Fig. 2d). When dilution was necessary from the stock concentration, antibodies were diluted with PBS at pH 5.8. After allowing the antibodies to covalently attach to the functionalized rings for 30 minutes, StabilGuard (Surmodics, Inc., Edin Prairie, MN) was overspotted on the rings as a stabilizer, keeping the chips shelf-stable until they were ready to be incorporated into a device and used (Fig. 2e).
Nanoporous silicon nitride (NPN) membrane cell culture substrates
NPN membrane chips were purchased from SiMPore, Inc. (West Henrietta, NY). Nanoscale porous membranes were chosen for this research because their thinness allows for free diffusion of analytes, in contrast to popular polymer track-etched membranes, which are about 10 μm thick. NPN membranes have been demonstrated to be excellent cell culture substrates.48,49 Additionally, their thinness (approximately 70 nm) means that they are optically clear, enabling high-quality transmission microscopy. A four-slot/four-membrane design was chosen so that one membrane could be overhung beyond the silicon photonic sensor chip, allowing visualization of the cell monolayer via transmission-based phase contrast microscopy through the device, while the other three membranes are situated directly above the sensor chip. The membrane slots are 3 mm long by 300 μm wide, on a 5.4 × 5.4 mm silicon chip frame. The silicon is 310 μm thick. Due to anisotropic etching of the silicon, the trench opposite each membrane is wider than 300 μm, which needed to be accounted for when designing microfluidic sealing layers. Membrane chip dimensions are shown in Fig. 3.
Fig. 3.
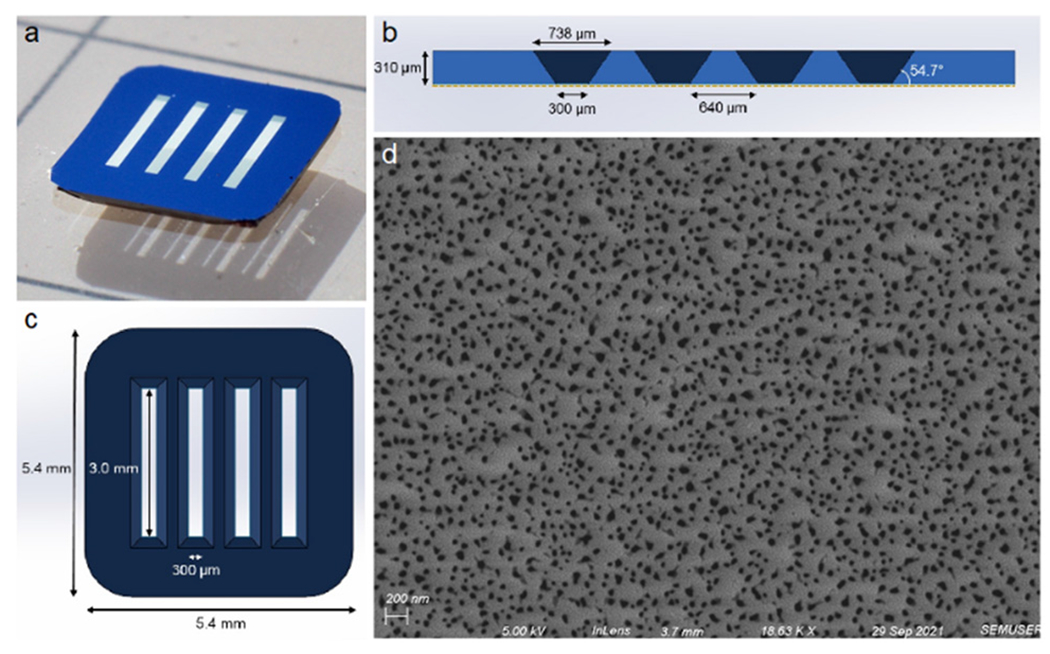
Membrane Chip Design. a) Photograph of a four-slot NPN membrane chip (color is due simply to lighting), with the etching trenches face down. b) Schematic cross section of the chip showing the anisotropically etched trenches opposite the nanoporous membrane (shown as a gold dotted line). c) Top view schematic of the 5.4 × 5.4 mm chip, with membrane slots that are 3.0 mm × 300 μm. d) An SEM image of the membrane, showing a heterogenous distribution of pores, averaging 28 nm in diameter. The membrane has an overall 13.5% porosity.
Microfluidic device design and fabrication
The devices used here required the incorporation of a membrane chip for cell culture sandwiched between two microfluidic channels, with a photonic chip incorporated at the base of the bottom channel. This introduced several design constraints. First, the multichannel design required a layered approach to construction. Thus, layers of silicone and adhesive tape were cut using a commercial craft cutter (Cameo 3, Silhouette America, Lindon, UT) and stacked via UV/ozone bonding37,50,51 to both hold the membrane and photonic chips, and form channels. Second, as the photonic chip requires input from and output to an optical fiber array on the side of the chip, layers were designed to allow exposure of edge couplers on the photonic chip had to project from one side of the device. The membrane chip was placed such that one of the four membranes overhangs the photonic chip, enabling monitoring of the cell culture by microscopy.
With these constraints in mind, we designed a two-channel device stack to include a 170 μm thick glass coverslip (cut in half for a 22 × 11 mm footprint), 762 μm silicone (Specialty Manufacturing Inc., Saginaw, MI) to hold the photonic chip in place, then two identical sealing layers, first of 57 μm adhesive (3M, Maplewood, MN), then of 127 μm silicone (SMI). The membrane chip is encased in a layer made from 300 μm silicone (Trelleborg Sealing Solutions, Trelleborg, Sweden), and sealed with two more identical layers: 57 μm adhesive, and 100 μm silicone (Trelleborg). The top channel is also 127 μm adhesive. The device is finally closed with polydimethylsiloxane (PDMS, Sylgard 184, Dow-Corning, Corning, NY) with two inlet and two outlet holes, made with 21-gauge blunt dispensing tips (Jensen Global, Santa Barbara, CA). The device layer stack is seen in Fig. 1b.
All silicone, glass, and PDMS was activated with UV/ozone (Novascan PSDP, Novascan Inc., Boone, IA) for 5 minutes prior to adhesion. Device layers were aligned manually with forceps and pressed firmly together to ensure a good seal. The membrane chip plus sealing layers were heated at 70 °C for about 5 minutes to ensure a good seal. Manual assembly of these devices took about an hour and a half, though multiple devices could be assembled in parallel to increase throughput.
For analyte calibration experiments, a single-channel device design was used. This device consists of the coverslip, 762 μm silicone chip holder with the photonic chip nested inside it, 57 μm adhesive seal, 127 μm silicone seal, 127 μm adhesive channel, and PDMS. These devices took about 15 minutes to assemble. The single-channel device stack can be seen in Fig. S1.† For each assay, known concentrations (in factors of ten from 10 pg mL−1 to 10 μg mL−1 for CRP and to 1 μg mL−1 for the other analytes) were flowed over the chip for 25 minutes each, a sufficient time for equilibrium to be reached as determined by no further shift in sensor resonance occurring. Sensor responses (relative shift at each concentration) were fit to a four-parameter logistic curve using Origin graphing analysis software (OriginLab Corp, Northampton, MA).
Cell culture
Human bronchial epithelial cells (16HBE line) were cultured in DMEM media (Gibco, Bleiswick, Netherlands), supplemented with 10% fetal bovine serum (Gibco), 1% HEPES (Gibco), and 1% penicillin/streptomycin. Cells were cultured in T25 flasks to confluency, which usually took 5–7 days, and passaged.
Prior to seeding cells in a device, the membranes were coated with extracellular matrix proteins to facilitate cell adhesion. To do this, silicone tubing with a 0.02” inner diameter (Cole-Parmer, Vernon Hills, IL) was inserted into the inlets and outlets with a 21-gauge 90° cannula (Jensen Global). The bottom channel was injected with PBS (pH 7.4), and the top channel was filled with a mixture of rat tail type I collagen (Sigma Aldrich, St. Louis, MO) at about 100 μg mL−1, and human fibronectin (Gibco) at 50 μg mL−1 in PBS, and the tubing sealed with binder clips. The device was placed in a custom 3D-printed holder to hold the tubing in place while moving it, as tension in the tubes could cause them to detach or damage the device. It was then moved to an incubator for 2 hours. Media was then injected into the device to wash out any unattached matrix proteins. Meanwhile, cells from one T25 flask were pelleted, then reconstituted in 700 μL of media. This yielded an appropriate density for the cells to achieve a monolayer on the membrane quickly. Once cells were injected into the top channel, they were moved to the incubator and allowed to adhere to the membrane without flow for about 3 hours. At this point the device was taken out of the incubator, and a cannula was inserted between the top channel outlet and the bottom channel inlet, so that media could circulate continuously through both channels. A syringe was used to manually push out any bubbles that had formed. The device was then attached to a peristaltic pump (P-1, Cytiva, discontinued) in the incubator, with care to avoid introducing bubbles into the tubing.
The peristaltic pump was connected through the same 0.02” silicone tubing to two fluid reservoirs made from glass vials with 21-gauge cannula inlets sealed with silicone adhesive, which in addition to preventing bubbles from entering the tubing going to the device, also dampened the peristaltic flow from the pump, as previously described.49 The pump was then turned on at the lowest setting, corresponding to about 30 μL min−1, and left overnight for an experiment to be done the next day. This is because in our experience, sustained levels of high shear stress result in poor cell health.
For long-term cultures under such low flow rates, bubbles spontaneously form over the membranes. By covering the device in the incubator with a 3D-printed enclosure, with two 15 mL conical tube caps filled with distilled water, the local humidity was increased to a level that prevented and eliminated existing bubbles completely over the course of all long-term incubations. The incubator setup is shown in Fig. 6a.
Fig. 6.
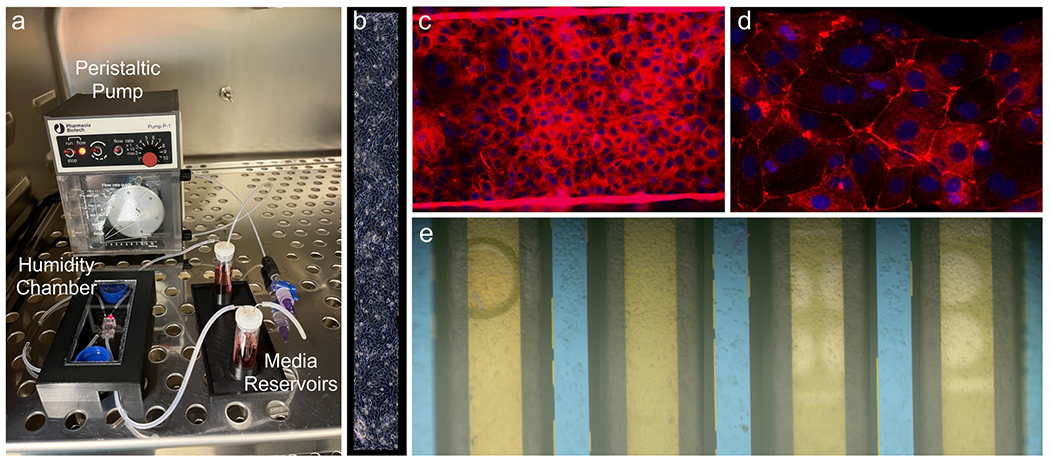
Cell culture. a) Incubator pump/device interface. b) Phase contrast image of the overhung membrane with a monolayer of HBEs. c) Tight junction staining of HBEs on a membrane (the bright lines represent cells growing up the edge of the membrane suspended between edges of the etched silicon substrate) (20×) and d) the silicon supports between the suspended membranes. (40×) e) Stitched brightfield image of all four membranes with cellular monolayers prior to a sensing experiment. The photonic ring resonator trenches (white) are visible underneath the two right-most membranes. While bubbles over or in close proximity to the ring resonators alter their resonance wavelengths, the bubble seen on the fourth (leftmost) membrane here will not interfere with cell secretion measurements as it is far away from the sensors.
Optical configuration
To acquire resonance shift information from the sensors in real time, the microfluidic device with integrated photonic sensors needed to be coupled to a light source and detector. To accomplish this, the device was situated on an aluminum stage fitted with a thermoelectric coupler (TEC) and thermistor to maintain the device at 37 °C. Light from a tunable laser source (Keysight 81606A) was guided through a polarization controller via an FC/APC single-mode fiber (Thorlabs Inc., Newton, NJ) and approximately polarized with TE orientation relative to the rectangular waveguides of the photonic chip. It was then routed into the first fiber of an 8-fiber linear fiber array with a 127-μm pitch (Oz Optics, Rochester, NY). The 7 output fibers were attached to an optical power meter (Keysight N7745C). The 8-fiber array was then aligned to the 1-input-7-output waveguide array on the right edge of the photonic chip (Fig. 4), visualizing with both a visible camera (Thorlabs DCC1645C) and an IR camera (WiDy InGaAs 650) and adjusting with micrometers, until the power registered in the output channels was maximized. Though there are two banks of rings on these chips, only one was used for these experiments due to the use of 8-channel detectors. In the future, more ring banks can be utilized by using detectors with more channels or by configuring multiple detectors.
Fig. 4.
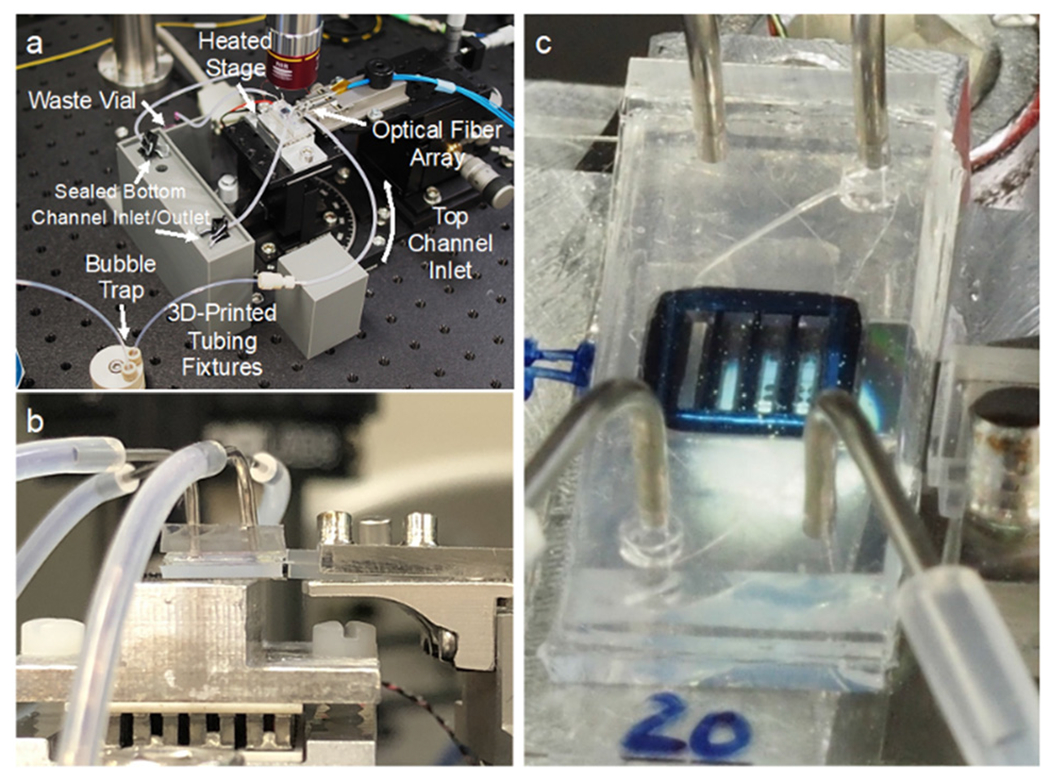
Optical configuration. a) The device is situated on a heated aluminum stage to be addressed by a fiber array. Fluidic tubing for both channels is held in place by custom 3D-printed fixtures. The bottom channel remains sealed for the duration of the experiment. b) A side view of the fiber array approaching the photonic chip from the right side with the device on a heated aluminum stage. c) A closeup of the device and fiber array, with rings under the membranes, photonic waveguides, and optical fibers visible.
Fluid delivery was controlled with a pressure driven fluidic pump (Aria Cell Perfusion System, Fluigent Inc., Le Kremlin-Bicêtre, France), that can be preloaded with up to ten different samples. A switch allowed seamless transition between samples, and a bubble trap prevented air from disrupting the cells in the device.
Data analysis
To calculate the resonance shift due to binding, resonance peak locations had to be extracted from the raw data. A custom Python script converts Keyence .omr spectral files into a single .parquet file, described previously.44 Then a user interface allows the user to choose an experiment and channel, and then finds and plots peak locations across the entire experiment (Fig. S2†). The user manually assigns peaks to either the “control” or “capture” rings, and the script subtracts the control shift from the capture shift. The resulting “relative shift” represents the shift in the experimental rings due only to the capture of specific analytes. These values are all exported as .csv files.
Immunocytochemistry
To confirm the ability of HBE cells to form a robust barrier in the device, cells were cultured in a device for four days under minimum flow conditions (for the peristaltic pump used, the minimum was about 30 μL min−1), and then stained for ZO-1, a common marker of tight junctions.52 Fixation and staining were done in the closed device by injection of reagents through the tubing with a syringe. On the fourth day cells were fixed with 4% paraformaldehyde at room temperature for 1 hour, then methanol at −20 °C for 20 minutes. After washing 3× with PBS (pH 7.4), cells were blocked with 1% bovine serum albumen (BSA) in PBS. Then primary antibody, mouse anti-ZO-1 (Invitrogen, Waltham, MA), diluted 1 : 300 in 1% BSA solution, was added and incubated at room temperature for 2.5 hours. After 3 more rinses with PBS, secondary antibody, Alexa-568-conjugated donkey anti-mouse (Life Technologies, Carlsbad, CA) diluted 1 : 1000 in 1% BSA, plus DAPI (Molecular Probes, Eugene, OR) diluted 1 : 1000, was added and incubated at room temperature for 1.5 hours. After three more rinses in PBS the entire device was imaged via fluorescence microscopy (Olympus BX-60) with PBS still in the channels.
Cytokine sensing experiments following LPS stimulation
Sensing experiments were conducted one day after seeding cells in a device, and had a full or near-monolayer of cells covering all four membrane slots. Fluid reservoirs of the Fluigent Aria were pre-filled with all of the solutions to be used. The cell- and sensor-containing device was adhered to the aluminum optical stage with adhesive, and the TEC element was set to 37 °C. In the incubator, media was recirculated from the top channel outlet to the bottom channel inlet. However, for sensing experiments, the two channels were disconnected from each other and the bottom channel was sealed with binder clips in order to allow for analyte capture by passive diffusion from the cells. The top channel inlet tubing of the device was connected to the outlet tubing of the Fluigent pump, and media was flowed at 30 μL min−1 continuously through the top channel. The photonic chip was then aligned to the fiber array, and spectral measurements then began immediately (typically within 5 minutes of placing the device on the optical stage). The laser was set to scan a 6-nm wavelength range (1547–1553 nm) at 1 pm resolution at 19-second intervals continuously throughout the duration of the experiment. After 30 minutes of media, 100 ng mL−1 LPS (O55:B5, Sigma-Alrich, Inc., St. Louis, MO) was flowed continuously for two hours. At the end of the experiment, the fluidic inlet was disconnected from the top channel and reconnected to the bottom channel of the device, and recombinant CRP (OrthoClinical Diagnostics, Rochester, NY) was flowed for 15 minutes.
Occasionally, as is typical with microfluidics experiments, a bubble would appear in the top channel, in which case flow would be briefly disconnected to force the bubble out with a media-filled syringe. Then the chip would be realigned to the fiber array, if necessary. This usually only manifested as a transient bump in the spectral peaks, but for both experimental and control rings equally, thus not affecting outcomes. However, a bubble in the bottom channel was more problematic, as a low-refractive index mass nonuniformly distributed over the rings drastically altered spectral features. Therefore, any experiments with significant bubble interference in the bottom channel were unusable, and that data was discarded.
Sensing of analytes through disrupted barrier
16HBE cells were seeded in a device and allowed to form a tight barrier under minimal flow conditions (~30 μL min−1). Cells had formed a full monolayer after 1 day. After 4 days, the barrier was presumed to have formed tight junctions (based on the ZO-1 staining experiments described above), such as to prevent the passage of large analytes through the paracellular spaces. The device was moved to the optical setup and continuous spectra were taken, while first flowing media for 30 minutes to allow the sensors to equilibrate, followed by 1 hour of CRP at 1 μg mL−1.
Before reattaching the device to the peristaltic pump, the media was supplemented with tight junction-disrupting peptides (TJDPs) at 10 μM (dosage demonstrated previously40), and the peptides were allowed to flow over the chip overnight. Approximately 22 hours later (day 5), the device was reattached and the again media was flowed for 30 minutes followed by CRP at 1 μg mL−1 for 1 hour. Then the pump inlet was switched to the bottom channel, to allow CRP to flow directly over the sensors. This was done as a positive control, which also yielded information about the relative amount of CRP that was able to diffuse through the disrupted barrier.
Results
Photonic chip sensitivity
Photonic ring resonator biosensors yield transmission spectra containing troughs at the wavelength resonant for the effective refractive index of their environment. These resonance wavelengths occur at λ = ((2πneff)/m), where m is an integer and neff is the effective refractive index. In order for them to produce a signal that is specific for an analyte, an antibody or other capture molecule must be attached to the sensor surface. Quantitative performance of the sensor is determined based on the shift (λ – λ0) as a function of target concentration established in a calibration curve. Sensor chips used here contained waveguides with two ring resonators each, with one designed to have a resonance trough at 1550 nm and the other at 1551 nm, by altering the diameter of the rings by a minute amount. The rings each have a free spectral range of about 2.2 nm, leaving enough distance between repeating comb features to prevent the crossing of peaks for the shifts seen here. The rings used here have quality (Q) factors (a measure of the sharpness of the resonance troughs) above 105, in line with current state-of-the-art for photonic biosensors.31 An example set of spectra for all 7 channels of a representative sensor is shown in Fig. S2a.†
Using single-channel fluidic devices, sensor calibration experiments were performed for four analytes. C-reactive protein (CRP) was used as a positive control for sensor function, and a negative control for cell stimulation. While CRP is a common marker of inflammation, it is not produced by HBE cells,53 and with a mass of 120 kDa, the CRP pentamer is easily sensed in a label-free assay. IL-1β (17.5 kDa) and IL-6 (21 kDa) are common pro-inflammatory cytokines, and were calibrated on the same multiplex chip, which had four waveguides functionalized for IL-6 and three for IL-1β. While IL-8 (8.5 kDa) was not directly studied in the context of the HBE culture systems described here, we also carried out a calibration experiment for this important pro-inflammatory cytokine in order to further show versatility of the platform. Calibrations were conducted by flowing the indicated analytes at concentrations of 0, 0.01, 0.1, 1, 10, 100, 1000, and 10 000 ng mL−1 in serum-containing media across the sensor.
For a high concentration of 1 μg mL−1 of analyte, the various protein markers yielded responses roughly proportionate to their molecular weight. CRP had a relative (i.e. control-subtracted) shift of 92 pm (n = 6 channels), IL-1β (n = 3), with IL-6 (n = 3), and IL-8 (n = 6) shifting 27, 45, and 27 pm, respectively. Measured lower limits of detection for these analytes were 1.5, 3.1, 7.6, and 20.7 ng mL−1, for IL-1β, CRP, IL-6, and IL-8, respectively. However, as mentioned earlier, the actual concentration near tissue will likely be much higher. Additionally, the consistency of ring-to-ring response within a single chip allows for the rigorous quantification of secreted analytes in our cellular devices. While duplicate rings on a single chip produced nearly identical results, chip-to-chip and wafer-to-wafer variability has yet to be assessed yet, and will need to be examined further. We anticipated that these limits of detection would be sufficient for our planned experiments, but, as mentioned previously, sandwich assays and other strategies could be used to enhance signal as needed.33
Cell viability in devices
To demonstrate that 16HBE cells behave as expected in the context of our microfluidic system, and in a manner consistent with other studies,54,55 we stained them for the tight junction marker ZO-1 after four days. The images shown in Fig. 6 indicate the presence of tight junctions in cells growing both on the free-standing NPN membrane (Fig. 6c) and on the silicon-backed regions between membranes (Fig. 6d). The ZO-1 is diffuse in the membrane domains compared to tight junction staining seen on 16HBEs in literature, but it can be clearly visualized in the silicon-backed regions of the membrane chip (Fig. 6d). Though experiments employing LPS stimulation did not require tight junctions, longer-term culture and an intact barrier were required for experiments testing analyte diffusion through a TJDP-disrupted barrier.
Visualizing cells via phase contrast microscopy (Fig. 6b) or fluorescent staining (Fig. 6c) was easily done via on the membrane overhanging the silicon photonic chip. However, cells on other membranes were also easily visualized with reflective brightfield microscopy on the optical setup. When performing a sensing experiment, cell morphology was monitored throughout the duration of the experiment by focusing on the membranes with the visible light camera, allowing the extent of the monolayer or loss of cells under flow to be observed (Fig. 6e).
Nonspecific binding control and diffusion through bottom channel
To understand nonspecific binding over timescales relevant to cell sensing experiments, and to prove that analytes originating at the level of the membrane could reach the level of the sensors on a short timescale, an experiment was done with a two-channel, membrane- and sensor-containing device lacking cells. Media was flowed for three hours followed by 1 μg mL−1 of IL-1β, IL-6, and IL-8 in the top channel, in a similar manner to the single-channel calibration experiments. Despite the use of isotype-matched antibody controls, small differences in nonspecific binding between control and capture rings result in drifting relative shift over time when the shift of the control peak is subtracted from the shift of the capture peak. No drift in the temperature control ring was observed. However, as can be seen in Fig. S3(b, d and f),† there are slight linear signal drifts that differ for each analyte. These represent subtle differences in nonspecific binding between experimental and control antibodies, despite the use of class-matched controls. Importantly, the nonspecific shifts seen here are small enough that specific shifts due to binding of target analytes are readily observable. Once the analyte cocktail was added, relative shifts on par with single-channel experiments can be seen, with a 5–10 minute delay from when the analyte enters the top channel until it reaches the sensors at the floor of the bottom channel (Fig. S3c, e and g†). This highlights the potential for our system to acquire time-resolved data of cellular response to stimuli added to the top channel.
To develop a more detailed theoretical understanding of analyte and fluid flows in the device, a COMSOL simulation was run, mimicking the device’s geometry exactly (Fig. S4a–d†). A steady-state velocity profile (Fig. S4e†) shows that when the bottom channel is sealed, the membrane effectively isolates the bottom channel from flow in the top channel. This isolation is presumably enhanced with a cell monolayer cultured on the membrane. A separate simulation set the inflow concentration in the top channel at 1 μg mL−1, and the diffusion coefficient set to 2.7 × 10⁻⁷ cm2 s−1 to approximate that of IL-6 in solution.56 A time-dependent simulation was then run to calculate analyte concentrations at 10-second intervals for up to ten minutes. The resulting simulation shows that the concentration at the level of the sensor reaches 50% of the input 1 μg mL−1 at about 90 seconds, and after 5 minutes about 95% of the input concentration. Concentration profiles and a graph of concentration at the level of the sensor are shown in Fig. S5,† and a GIF file of the concentration profile over the first 5 minutes is shown in Fig. S6.† This suggests that we can sense relevant quantities of secreted analytes on a timescale of minutes.
Sensing of cellular secretions
As a proof-of-concept experiment, we tested the ability of our device to sense the secretion of cytokines from HBEs in response to stimulation with LPS. By flowing LPS in the top channel, cells are stimulated to produce and secrete inflammatory cytokines into the bottom channel. While the apical/basal secretion preference of 16HBE cells is unclear,57,58 some other cell types have been shown to preferentially secrete cytokines basally,59 i.e. opposite the side of stimulation. If the bottom channel is sealed, the secreted cytokines are allowed to diffuse to the level of the photonic sensor chip, situated at the bottom of the channel.
As seen in Fig. 7, our experiments demonstrate the sensing of interleukins secreted in response to LPS stimulation, with a similar time course to previous experiments with HBEs. In the experiment shown here, media was flowed for 30 minutes, followed by LPS at 100 ng mL−1 for two hours. About one hour after the introduction of LPS, the sensor response, as represented by an increase in the relative shift of the IL-1β- or IL-6-functionalized rings, begins to increase steadily. After 90–120 minutes, the response levels off as the cell secretion level/analyte binding reaches equilibrium. The CRP-functionalized ring serves as an additional negative control (besides the Ms IgG1 control rings), and the trace shown in Fig. 7c has no increasing trend like any of the cytokine-functionalized rings, confirming the specificity of the response to cytokines secreted by the HBEs. The slight negative drift for the CRP subtracted trace (and return to baseline drift after the deviation around 120–140 min.) likely represents a mismatch in the nonspecific response between the CRP antibody and the mouse control antibody, as discussed above.
Fig. 7.
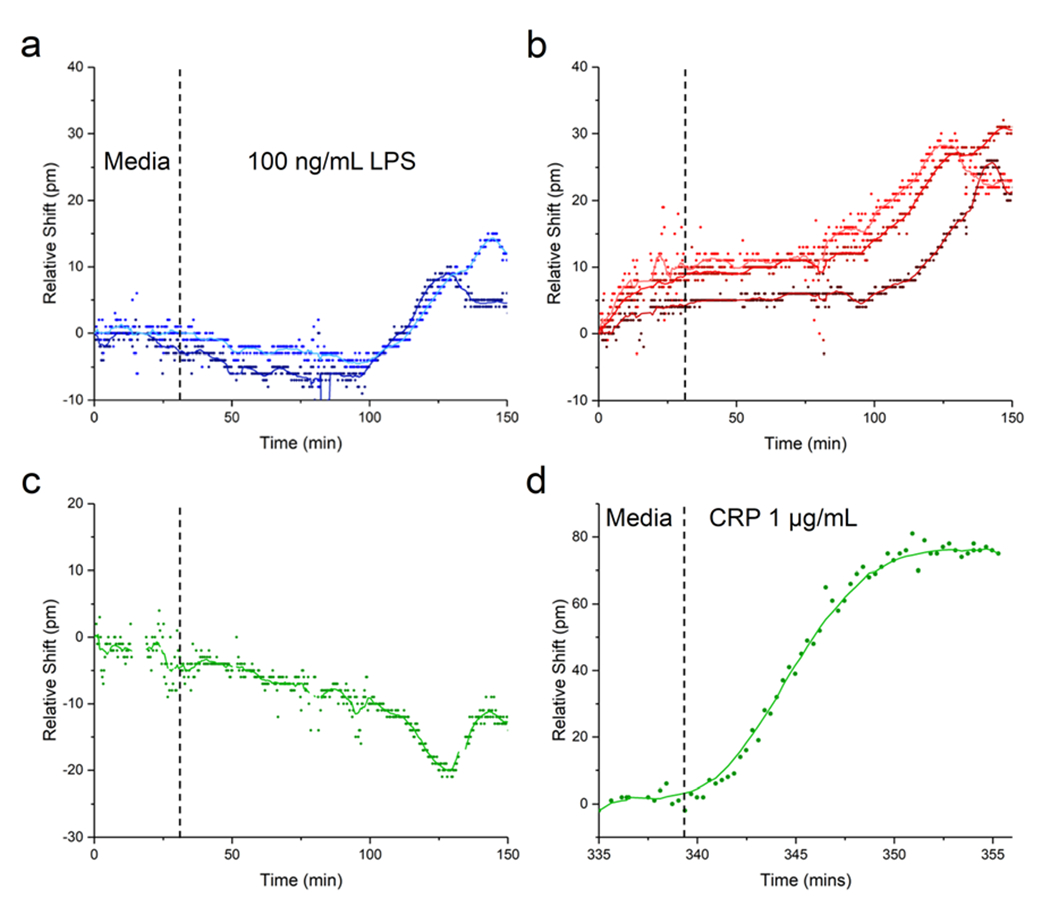
Sensing of secreted cytokines. Media flowed for 30 minutes before 100 ng mL−1 LPS was injected into the top channel and flowed for two hours. a) Response for two IL-1β channels, with the control response subtracted from the anti-IL-1β-functionalized ring response. The different shades of blue correspond to the two individual IL-1β-functionalized channels. b) Subtracted response for three IL-6 channels. c) Subtracted response for CRP (i.e. negative control channel). d) The same CRP channel when recombinant CRP was added at the end of the experiment.
The CRP ring also serves as a positive control to verify that sensor responses seen are in fact due to antigens binding to antibodies bound to the rings, and that the sensor is still functional at the end of the experiment. In Fig. 7d the trace for this ring is shown, in response to flowing 1 μg mL−1 of CRP in the bottom channel (i.e. directly over the rings) over the last 30 minutes of the experiment. There is a marked redshift in the resonance, with time-dependent binding response consistent with Langmuir binding behavior. The relative shift reaches a maximum of about 80 pm, compared with about 90 pm for the calibration experiment shown in Fig. 5. None of the rings functionalized for other analytes showed this response (data not shown).
Fig. 5.
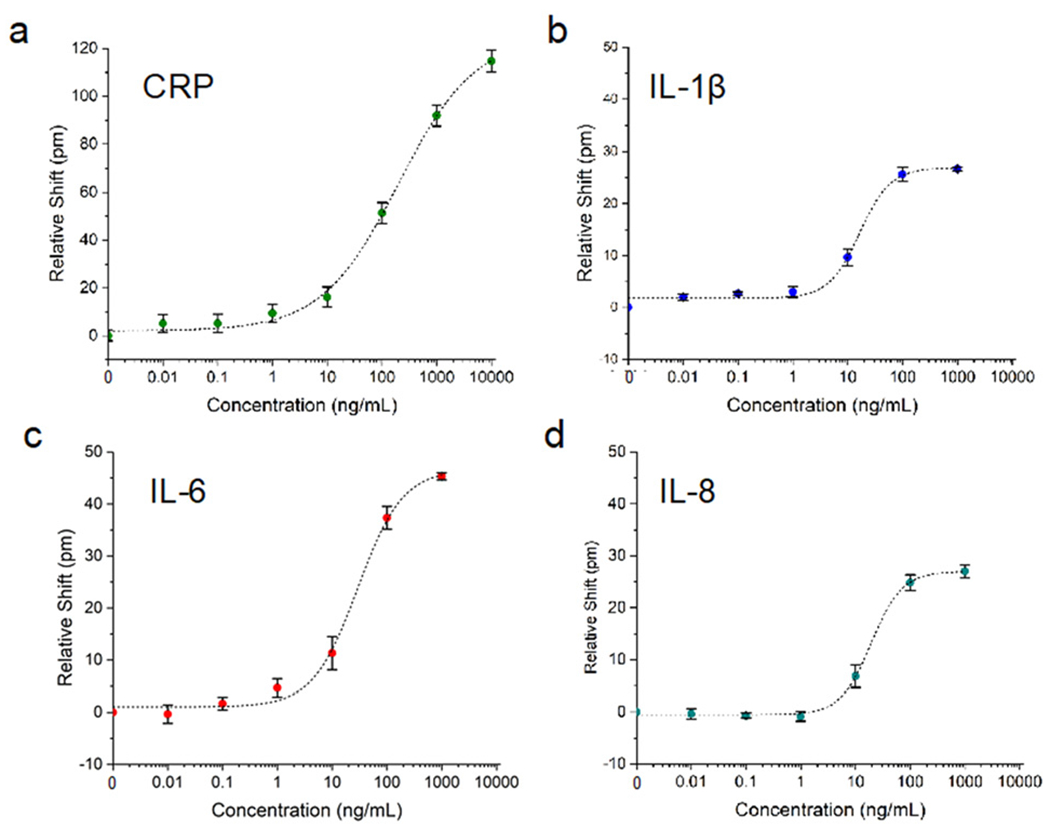
Photonic sensor validation in a single-channel microfluidic device. Photonic sensor calibration for various analytes: a) CRP (n = 6 channels), b) IL-1β (n = 3), c) IL-6 (n = 3) and d) IL-8 (n = 4). All responses were fit with four-parameter logistic curves. Error bars represent standard error of the mean.
A separate experiment in which cells had peeled off the two right-most membranes prior to LPS stimulation provided an opportunity to test spatially-resolved sensing. LPS was flowed at 10 ng mL−1 and the sensor response was measured over the course of 4 hours. Fig. S7† shows the responses across 6 channels, for IL-1β (Fig. S7c†) and IL-6 (Fig. S7d†). The control-subtracted shift ranges from 1–15 pm, showing a decrease relative to the higher concentrations of LPS used earlier, as well as a temporal delay in the onset of response occurring at about three and a half hours. Additionally, there is an increased response with increasing channel number. Thus channel 7, which is the furthest channel to the left (closest to the remaining cells), had the highest response, with decreasing shifts for channels 6–4, until there was essentially no response in channels 3–1 (farthest away from the cells). Due to the loss of cells on the right side of the membrane chip, this demonstrates a graded response in accordance with the presence of full cell layers on the left two membranes. To corroborate this, a COMSOL model using the two left-most membranes as an areal concentration source of analyte was run. A horizontal slice of the computed concentration profile (Fig. S7f) as well as the linear and surface concentration gradients at the level of the sensor (Fig. S7h and i,† respectively) both correlate very well with the experimental data shown in Fig. S7e.† A GIF file of the concentration profile over the first 500 seconds is shown in Fig. S8.†
Sensing of analytes through disrupted tissue barrier
Finally, we tested sensor response to a large analyte (CRP) before and after selective HBE tissue barrier disruption using TJDPs to demonstrate the utility of this platform for measuring barrier integrity and paracellular analyte transport in addition to cellular secretion. Development of a tissue barrier in vitro takes several days, so functionalized devices need to be able to maintain their functionality for days under flow in a 37 °C environment. To test this, single-channel devices were tested after 0, 4, and 6 days in the incubator. The results shown in Fig. S9† confirm no loss of sensor functionality after 6 days. In previous work,42 we have demonstrated that TJDPs based on the amino acid sequence of claudin-1 reversibly reduce barrier in HBEs, facilitating paracellular passage of large molecules in cell culture. Here, we first flowed CRP for 1 hour in the top channel of the device, and observed a modest 4 pm shift from the sensor in the bottom channel (Fig. 8). This is consistent with the inability of the large CRP pentamer to permeate the barrier, which has formed tight junctions over the course of 4 days. Next, a TJDP was flowed at a concentration of 10 mM overnight, disrupting the barrier. After TJDP treatment, the sensors showed an 18 pm shift. As a positive control, CRP was briefly flowed in the bottom channel to directly address the sensors, yielding a 49 pm shift. Thus, a significant portion of the 1 μg mL−1 of CRP in the top channel was able to reach the sensors.
Fig. 8.
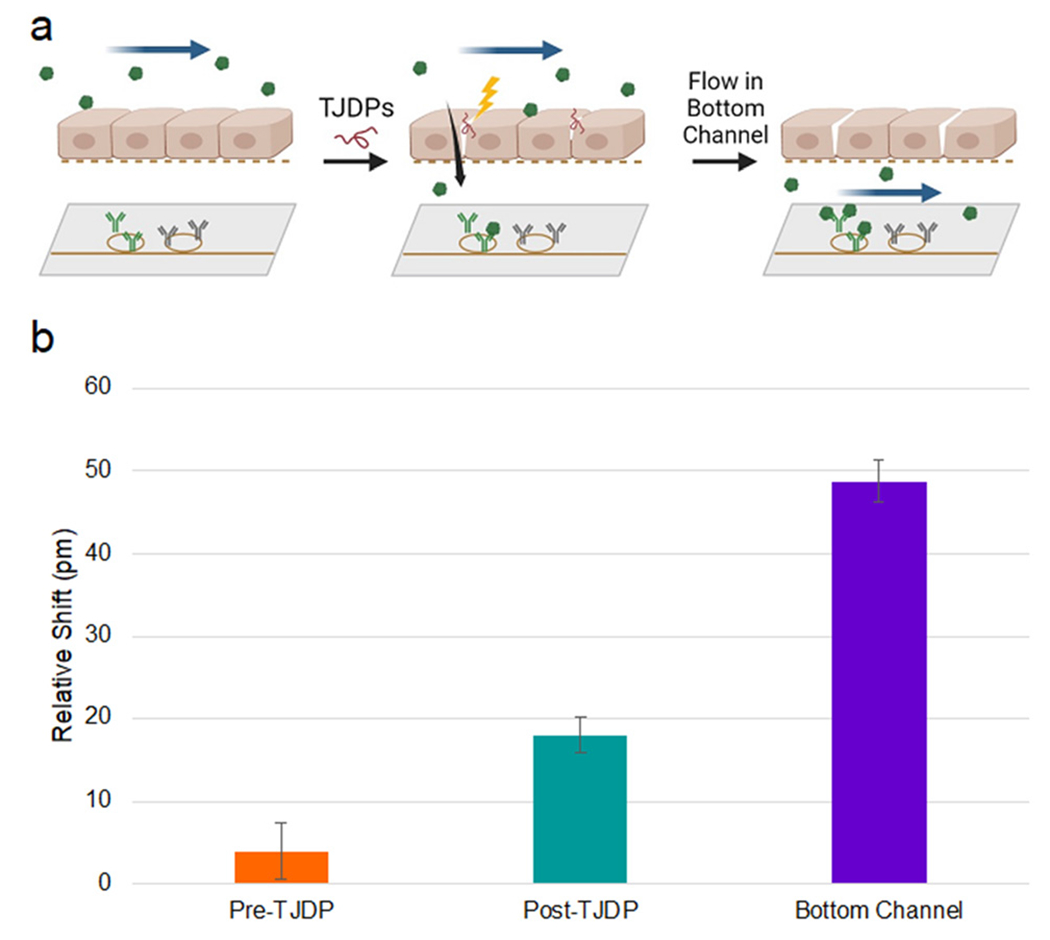
Barrier disruption sensing. a) Experimental diagram: CRP is flowed in the top channel before and after disruption with TJDPs and sensed in the bottom channel. Finally, CRP is flowed directly into the bottom channel to confirm antibody reactivity. b) Quantification of shifts seen in each segment of the experiment. Error bars represent standard error of the mean, n = 7.
Conclusions
Existing in vivo and in vitro disease models have recognized shortcomings in their ability to facilitate understanding of human disease and predict therapeutic response.60 The genetic heterogeneity of human clinical studies, the challenges of translating results of animal studies to humans, and the lack of temporally resolved information of appropriate biological complexity provided by in vitro cell culture systems all drive the need for new TC devices using human cells. Given the possibility of constructing such systems from iPSCs derived from an individual patient, TCs have immense promise in enabling patient-centric analysis of therapeutics, also known as the “n-of-1 clinical trial”.61 For TCs to reach their full potential, methods must be available to provide real-time data on the TC via incorporation of biosensors as near as possible to the cells under study. Photonic ring resonator biosensors are ideal for this application for several reasons, including their sensitivity, label-free nature, small footprint/large multiplexing capability, and scalable manufacture. Hence, we have integrated photonic ring resonators into a microfluidic system to sense the secretion of analytes from cells in real time.
The data described above confirms that our device design allows for culturing cells over the course of days, and performing experiments while attached to an optical setup used for sensing. Our photonic chips are able to sense physiologically relevant concentrations of analyte, reporting on the quantity of cytokines secreted by inflamed epithelial cells in real time following LPS stimulation. We also demonstrate detection of CRP, a large (120 kDa pentamer) protein passing through a disrupted cellular barrier. A particularly intriguing result is that these sensors may also be used to provide spatially- as well as temporally-resolved information. These results provide proof of concept for incorporating photonic sensors into a broad range of more complex TC systems.
While these results represent a significant step forward in the development of tissue chip technology, there are a few limitations to our platform as currently constructed. In particular, the photonic sensors can quickly sense an increase in analyte concentrations, but not a decrease. This is due to the low off-rates of the antibodies with which the sensor is functionalized. One could envision using regeneration solutions to remove proteins from their corresponding antibodies, returning the sensor response to baseline. However, most common regeneration protocols involve extremes of pH or high salt concentrations62,63 that would lead to quick death of the TC under study. Thus, new regeneration protocols are needed that are safe for cells, or more sophisticated microfluidics that prevent regeneration solutions from coming into direct contact with the cells are required. Alternatively, modular systems in which new sensors are swapped into the microfluidic circuit when one set becomes saturated can also be envisioned.
The work presented here opens new opportunities for the study of physiological processes in TCs. While the inflammatory responses and conditional through-barrier transport measured here serve as useful proof-of-concept, the potential for this platform for studying basic biology is substantial. The NPN membranes used as a culture substrate are ideal for modelling various tissue barriers and the diseases that alter them, including intestinal endothelium (Crohn’s disease64), skin (atopic dermatitis65), or the blood–brain barrier (Alzheimer’s,66 traumatic brain injury67,68). All these tissue barriers have multiple cell types that secrete paracrine markers affecting neighboring cell types. We anticipate that our new sensor-integrated platform can be used to determine the exact kinetics of protein release from varying cell types, leading to new understanding of disease pathophysiology. To further increase the kinds of data available from one of these experiments, sensors could also be situated in the top channel to enable assessment of the apical/basal secretion dynamics of tissue barriers. Finally, this approach should also be useful in drug discovery and development, and through the use of TCs constructed using single-donor induced pleuripotent stem cells (iPSCs) may facilitate individualized, “patient-centric” therapeutic selection.
Supplementary Material
Funding:
this work was supported by National Institutes of Health contract 1UG3TR003281 (BLM, JLM) and the New York State Empire State Development Fund (BLM). The authors thank Michael Osadciw, for providing the illustration in Fig. 1, Michael Pomerantz for producing custom aluminum heated stages, Ethan Luta for acquiring SEM images, and Dr. Dean Johnson for help with modeling nanoporous membranes in COMSOL.
Footnotes
Electronic supplementary information (ESI) available. See DOI: https://doi.org/10.1039/d2lc00864e
Conflicts of interest
JLM is a shareholder in and advisor to SiMPore, Incorporated. JSC, BLM, and JLM are named inventors on a patent application describing the TC technology discussed herein. All other authors declare they have no competing interests.
References
- 1.Ledford H, Nature, 2011, 477(7366), 526–528. [DOI] [PubMed] [Google Scholar]
- 2.Latta CH, Brothers HM and Wilcock DM, Neuroscience, 2015, 302, 103–111. [DOI] [PMC free article] [PubMed] [Google Scholar]
- 3.Low LA and Tagle DA, Lab Chip, 2017, 17(18), 3026–3036. [DOI] [PMC free article] [PubMed] [Google Scholar]
- 4.Donoghue L, Nguyen KT, Graham C and Sethu P, Micromachines, 2021, 12(2), 139. [DOI] [PMC free article] [PubMed] [Google Scholar]
- 5.Sharma A, Sances S, Workman MJ and Svendsen CN, Cell Stem Cell, 2020, 26(3), 309–329. [DOI] [PMC free article] [PubMed] [Google Scholar]
- 6.Chang CY, Ting HC and Liu CA, et al. , Molecules, 2020, 25(8), 2000. [DOI] [PMC free article] [PubMed] [Google Scholar]
- 7.Zirath H, Rothbauer M and Spitz S, et al. , Front. Physiol, 2018, 9, 815. [DOI] [PMC free article] [PubMed] [Google Scholar]
- 8.Moya A, Ortega-Ribera M and Guimerà X, et al. , Lab Chip, 2018, 18(14), 2023–2035. [DOI] [PubMed] [Google Scholar]
- 9.Bavli D, Prill S and Ezra E, et al. , Proc. Natl. Acad. Sci, 2016, 113(16), E2231–E2240. [DOI] [PMC free article] [PubMed] [Google Scholar]
- 10.Shaegh SAM, De Ferrari F and Zhang YS, et al. , Biomicrofluidics, 2016, 10(4), 044111. [DOI] [PMC free article] [PubMed] [Google Scholar]
- 11.Tang Y, Zhen L, Liu J and Wu J, Anal. Chem, 2013, 85(5), 2787–2794. [DOI] [PubMed] [Google Scholar]
- 12.Zhang YS, Aleman J and Shin SR, et al. , Proc. Natl. Acad. Sci, 2017, 114(12), E2293–E2302. [DOI] [PMC free article] [PubMed] [Google Scholar]
- 13.Misun PM, Rothe J, Schmid YRF, Hierlemann A and Frey O, Microsyst. Nanoeng, 2016, 2, 16022. [DOI] [PMC free article] [PubMed] [Google Scholar]
- 14.Adriani G, Ma D, Pavesi A, Kamm RD and Goh ELK, Lab Chip, 2017, 17(3), 448–459. [DOI] [PubMed] [Google Scholar]
- 15.Zakharova M, Palma Do Carmo MA and Van Der Helm MW, et al. , Lab Chip, 2020, 20(17), 3132–3143. [DOI] [PubMed] [Google Scholar]
- 16.Wevers NR, Kasi DG and Gray T, et al. , Fluids Barriers CNS, 2018, 15(1), 1–12. [DOI] [PMC free article] [PubMed] [Google Scholar]
- 17.Morales AW, Zhang YS and Aleman J, et al. , Frontiers in Biological Detection, 2016, vol. 9725. [Google Scholar]
- 18.Ortega MA and Fernández-Garibay X, et al. , Lab Chip, 2019, 19, 2568–2580. [DOI] [PubMed] [Google Scholar]
- 19.Vunjak-Novakovic G, Ronaldson-Bouchard K and Radisic M, Cell, 2021, 184(18), 4597–4611. [DOI] [PMC free article] [PubMed] [Google Scholar]
- 20.Jeong S, Kim S and Buonocore J, et al. , IEEE Trans. Biomed. Eng, 2018, 65(2), 431–439. [DOI] [PMC free article] [PubMed] [Google Scholar]
- 21.Zoio P, Lopes-Ventura S and Oliva A, Micromachines, 2021, 12(7), 816. [DOI] [PMC free article] [PubMed] [Google Scholar]
- 22.Renous N, Kiri MD, Barnea RA, Rauti R, Leichtmann-Bardoogo Y and Maoz BM, Lab Chip, 2021, 22(1), 71–79. [DOI] [PubMed] [Google Scholar]
- 23.Basan M, Ham D and Park H, et al. , Lab Chip, 2022, 22(7), 1286–1296. [DOI] [PMC free article] [PubMed] [Google Scholar]
- 24.Noah TL and Becker S, Am. J. Physiol, 1993, 265(5), L472–L478. [DOI] [PubMed] [Google Scholar]
- 25.Scannapieco FA, Wang B and Shiau HJ, Ann. Periodontol, 2001, 6(1), 78–86. [DOI] [PubMed] [Google Scholar]
- 26.Grammas P and Ovase R, Neurobiol. Aging, 2001, 22(6), 837–842. [DOI] [PubMed] [Google Scholar]
- 27.Blum-Degena D, Müller T, Kuhn W, Gerlach M, Przuntek H and Riederer P, Neurosci. Lett, 1995, 202(1–2), 17–20. [DOI] [PubMed] [Google Scholar]
- 28.Brewer MG, Yoshida T, Kuo FI, Fridy S, Beck LA and De Benedetto A, Int. J. Mol. Sci, 2019, 20, 361–369. [DOI] [PMC free article] [PubMed] [Google Scholar]
- 29.Yamanaka KI and Mizutani H, Curr. Probl. Dermatol, 2011, 41, 80–92. [DOI] [PubMed] [Google Scholar]
- 30.Miller BL, Bryan MR, Steiner DJ and Cognetti JS, Chemical, Biological, Radiological, Nuclear, and Explosives (CBRNE) Sensing XIX, SPIE, 2018, vol. 34. [Google Scholar]
- 31.Steglich P, Hülsemann M, Dietzel B and Mai A, Molecules, 2019, 24(3), 519. [DOI] [PMC free article] [PubMed] [Google Scholar]
- 32.Luchansky MS and Bailey RC, Anal. Chem, 2010, 82(5), 1975–1981. [DOI] [PMC free article] [PubMed] [Google Scholar]
- 33.Kindt JT, Luchansky MS, Qavi AJ, Lee SH and Bailey RC, Anal. Chem, 2013, 85(22), 10653–10657. [DOI] [PubMed] [Google Scholar]
- 34.Michalaki V, Syrigos K, Charles P and Waxman J, Br. J. Cancer, 2004, 90(12), 2312–2316. [DOI] [PMC free article] [PubMed] [Google Scholar]
- 35.Swardfager W, Lanctôt K, Rothenburg L, Wong A, Cappell J and Herrmann N, BPS, 2010, 68, 930–941. [DOI] [PubMed] [Google Scholar]
- 36.Li X, Soler M and Szydzik C, et al. , Small, 2018, 14, 1800698. [DOI] [PubMed] [Google Scholar]
- 37.Smith KJP, May M, Baltus R and McGrath JL, Sep. Purif. Technol, 2017, 189, 40–47. [Google Scholar]
- 38.Striemer CC, Gaborski TR, McGrath JL and Fauchet PM, Nature, 2007, 445(7129), 749–753. [DOI] [PubMed] [Google Scholar]
- 39.Godfrey RWA, Microsc. Res. Tech, 1997, 38(5), 488–499. [DOI] [PubMed] [Google Scholar]
- 40.Brewer MG, Anderson EA and Pandya RP, et al. , J. Invest. Dermatol, 2020, 140(2), 361–369. [DOI] [PubMed] [Google Scholar]
- 41.Sun J, Huang N, Ma W, Zhou H and Lai K, Mol. Med. Rep, 2019, 19(3), 1817–1823. [DOI] [PubMed] [Google Scholar]
- 42.Shi L, Dong N and Ji D, et al. , Cell Biol. Toxicol, 2018, 34(1), 39–49. [DOI] [PMC free article] [PubMed] [Google Scholar]
- 43.Shirasaki Y, Yamagishi M and Suzuki N, et al. , Sci. Rep, 2014, 4(1), 1–8. [DOI] [PMC free article] [PubMed] [Google Scholar]
- 44.Cognetti JS, Steiner DJ and Abedin M, et al. , Lab Chip, 2021, 21, 2913–2921. [DOI] [PubMed] [Google Scholar]
- 45.Cognetti JS and Miller BL, Sensors, 2021, 21(17), 5857. [DOI] [PMC free article] [PubMed] [Google Scholar]
- 46.Sun Y and Fan X, Anal. Bioanal. Chem, 2011, 399(1), 205–211. [DOI] [PubMed] [Google Scholar]
- 47.Fahrenkopf NM, McDonough C, Leake GL, Su Z, Timurdogan E and Coolbaugh DD, IEEE J. Sel. Top. Quantum Electron, 2019, 25(5), 8201406. [Google Scholar]
- 48.Mossu A, Rosito M and Khire T, et al. , J. Cereb. Blood Flow Metab, 2019, 39(3), 395–410. [DOI] [PMC free article] [PubMed] [Google Scholar]
- 49.Salminen AT, Zhang J and Madejski GR, et al. , Small, 2019, 15(6), e1804111. [DOI] [PMC free article] [PubMed] [Google Scholar]
- 50.Chung HH, Chan CK and Khire TS, et al. , Lab Chip, 2014, 14(14), 2456–2468. [DOI] [PMC free article] [PubMed] [Google Scholar]
- 51.Khire TS, Salminen AT and Swamy H, et al. , Cell. Mol. Bioeng, 2020, 13, 125–139. [DOI] [PMC free article] [PubMed] [Google Scholar]
- 52.Citi S, J. Cell. Biol, 1993, 121, 485–489. [DOI] [PMC free article] [PubMed] [Google Scholar]
- 53.Hurlimann J, Thorbecke GJ and Hochwald GM, J. Exp. Med, 1966, 123(2), 365–378. [DOI] [PMC free article] [PubMed] [Google Scholar]
- 54.Zhang F, Tian C and Liu W, et al. , ACS Sens, 2018, 3(12), 2716–2725. [DOI] [PubMed] [Google Scholar]
- 55.Qin YX, Yang ZH and Du XH, et al. , Chin. Med. J, 2018, 131(10), 1191–1198. [DOI] [PMC free article] [PubMed] [Google Scholar]
- 56.Ao X and Stenken JA, Methods, 2006, 38(4), 331–341. [DOI] [PubMed] [Google Scholar]
- 57.Kube D, Sontich U, Fletcher D and Davis PB, Am. J. Physiol, 2001, 280, L493–L502. [DOI] [PubMed] [Google Scholar]
- 58.Richards LB, Li M, Folkerts G, Henricks PAJ, Garssen J and van Esch BCAM, Int. J. Mol. Sci, 2021, 22(1), 65. [DOI] [PMC free article] [PubMed] [Google Scholar]
- 59.Verma S, Nakaoke R, Dohgu S and Banks WA, Brain, Behav., Immun, 2006, 20(5), 449–455. [DOI] [PubMed] [Google Scholar]
- 60.Kilic T, Navaee F, Stradolini F, Renaud P and Carrara S, Microphysiol. Syst, 2018, 2, 5. [Google Scholar]
- 61.Lillie EO, Patay B, Diamant J, Issell B, Topol EJ and Schork NJ, J. Pers. Med, 2011, 8(2), 161. [DOI] [PMC free article] [PubMed] [Google Scholar]
- 62.Andersson K, Hämäläinen M and Malmqvist M, Anal. Chem, 1999, 71(13), 2475–2481. [DOI] [PubMed] [Google Scholar]
- 63.Goode JA, Rushworth JVH and Millner PA, Langmuir, 2015, 31(23), 6267–6276. [DOI] [PubMed] [Google Scholar]
- 64.Yoo JH and Donowitz M, World J. Gastroenterol, 2019, 25(30), 4125. [DOI] [PMC free article] [PubMed] [Google Scholar]
- 65.Brewer MG, Monticelli SR, Moran MC, Miller BL, Beck LA and Ward BM, Cell, 2022, 11(8), 1337. [DOI] [PMC free article] [PubMed] [Google Scholar]
- 66.Sweeney MD, Sagare AP and Zlokovic BV, Nat. Rev. Neurol, 2018, 14(3), 133–150. [DOI] [PMC free article] [PubMed] [Google Scholar]
- 67.Blyth BJ, Farhavar A and Gee C, et al. , J. Neurotrauma, 2009, 26(9), 1497–1507. [DOI] [PMC free article] [PubMed] [Google Scholar]
- 68.Shlosberg D, Benifla M, Kaufer D and Friedman A, Nat. Rev. Neurol, 2010, 6(7), 393–403. [DOI] [PMC free article] [PubMed] [Google Scholar]
Associated Data
This section collects any data citations, data availability statements, or supplementary materials included in this article.