Figure 7.
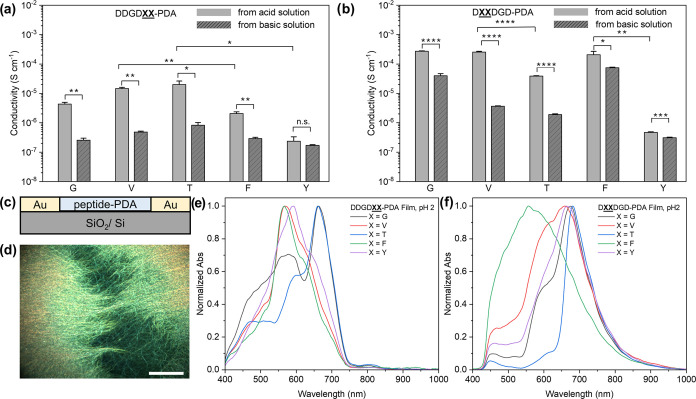
Electrical and optical properties of peptide-PDA films. The conductivity of (a) DDGDXX-PDA and (b) DXXDGD-PDA dried films from 1 mM peptide-PDA solution with varied pH conditions. Error bars = standard error of the mean; n ≥ 4. For the statistical analyses, p-values were determined using t-test (two-sample unequal variance test, one-tail distribution) See Tables S3 and S4 for detailed information; *p < 0.05; **p < 0.01; ***p < 0.001; ****p < 0.0001; n.s. (not significant; p > 0.05). (c) Schematic of conductivity measurement setup for peptide-PDA films. Scale bar = 50 μm. (d) Representative dark-field optical image of DDGDTT-PDA films made from pH 10 solution. Absorption spectra, taken from the hyperspectral scans of the area of interest that has the highest matching percentage, of (e) DDGDXX-PDA and (f) DXX DGD-PDA films made from 1 mM polymer solutions at pH 2.

