Abstract
Brillouin microscopy is an emerging label-free imaging technique used to assess local viscoelastic properties. Quantum-enhanced stimulated Brillouin scattering is demonstrated using low power continuous-wave lasers at 795 nm. A signal-to-noise ratio enhancement of 3.4 dB is reported by using two-mode intensity-difference squeezed light generated with the four-wave mixing process in atomic rubidium vapor. The low optical power and the excitation wavelengths in the water transparency window have the potential to provide a powerful bio-imaging technique for probing mechanical properties of biological samples prone to phototoxicity and thermal effects. The performance enhancement affordable through the use of quantum light may pave the way for significantly improved sensitivity that cannot be achieved classically. The proposed method for utilizing squeezed light for enhanced stimulated Brillouin scattering can be easily adapted for both spectroscopic and imaging applications in biology.
1. INTRODUCTION
Over the past decade, Brillouin scattering spectroscopy and microscopy have witnessed a renaissance providing solutions to fundamental problems and sparking new applications across multiple disciplines [1-6]. In the innermost part of those revolutionary advancements are new ways of improving detection either through high-resolution spectrometer [7] or through nonlinear optical excitation [8-10]. Brillouin scattering is an inelastic scattering of light by electrostrically or thermally excited acoustic waves (i.e., phonons). If a narrow linewidth (< 10 MHz) light source is used, both the redshifted (Stokes) and blueshifted (anti-Stokes) scattered light are detected, giving rise to a Brillouin spectrum. By measuring both the frequency shift and the linewidth of the spectrum, the complex viscoelastic modulus of the sample can be assessed in a single spectroscopic measurement [11]. Relatively recently, biological applications of Brillouin spectroscopy became a subject of interest [12]. Recent years brought a deeper understanding of microscopic biomechanics as one of the key governing factors in biological development and diseases such as cancer progression [13]. Brillouin scattering spectroscopy offers a noncontact, label-free method; it is therefore very suited for measurements of biomechanical properties that would be difficult to measure with other methods [14,15].
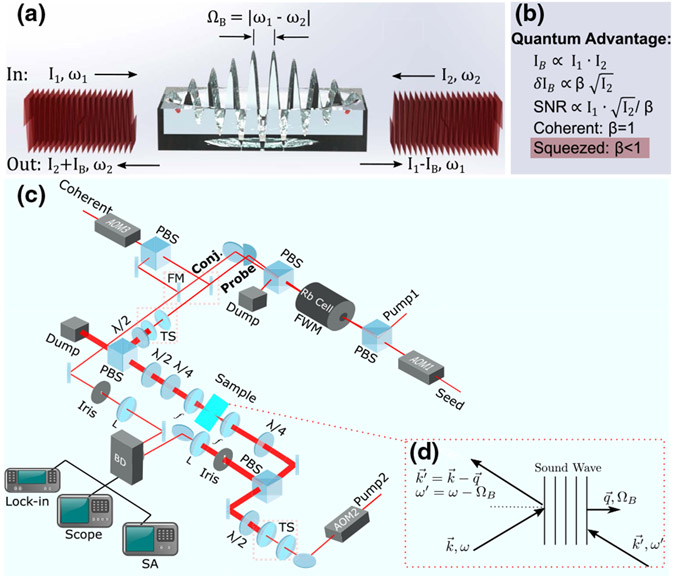
With all the advantages of Brillouin spectroscopy being able to provide unique information in a remote and noninvasive way, there are still a tremendous amount of remaining challenges to improve the accuracy and acquisition speed of such measurements in order to observe fast dynamic processes and to image large-scale objects with microscopic spatial resolution. To improve the acquisition speed and spatial resolution, and to reduce the elastic scattering background, stimulated Brillouin scattering (SBS) was proposed and was first observed by Chiao et al. [16]. Since then, SBS has been demonstrated to enable much faster acquisition times and high specificity to local viscoelastic properties of biological samples [8,10]. As shown by the diagram in Fig. 1(a), in the process of SBS, counterpropagating continuous-wave (CW) pump and probe beams at frequencies ω1 and ω2 overlap in the sample to efficiently interact with a longitudinal acoustic phonon of frequency ΩB. When ω2 is scanned around the Stokes frequency (ω1 − ΩB), the probe intensity I2 at ω2 experiences a stimulated Brillouin gain (+IB) via wave resonance, where the pump intensity I1 at ω1 shows a stimulated Brillouin loss (−IB). The opposite occurs when ω2 is scanned around the anti-Stokes frequency (ω1 − ΩB). Thus, the stimulated Brillouin gain and loss enable spectral measurements that are free of elastic background. The efficiency of phonon generation in SBS could be orders of magnitude stronger than in the scenario of spontaneous Brillouin scattering [10]. High scattered signal magnitude translates into better signal-to-noise ratio (SNR) and, consequently, faster acquisition times. With all the benefits provided by SBS, however, there are also two main technical challenges associated with it: 1) locking laser frequency to an external reference, such as a cavity or an absorption line, is required to reduce temporal drifts of laser frequency [6,17], and 2) alignment of the two counterpropagating laser beams must be very precise for a significant spatial overlap of their individual focal regions (i.e., Rayleigh ranges).
Fig. 1.
(a) Conceptual diagram of the SBS process. The stimulated Brillouin gain IB is what we measure in this work. (b) Principle of quantum advantage for the measurement of IB; (c) experimental setup: L, lens; FM, flip mirror; TS, telescope, PBS, polarizing beam splitter; BD, balanced detector; SA, RF spectrum analyzer; (d) phase-matching diagram for the SBS process [34]. The wave vectors and frequencies for the pump, probe, and sound wave are denoted by (, ω), (, ω′), and (, ΩB), respectively.
As a nonlinear optical technique, SBS benefits from the higher excitation intensity, which can also induce phototoxicity and/or thermal damage to biological samples of interest. Clearly, there is a tremendous need to improve SBS detection for low-power-light applications, and recent advancements in LIGO demonstrate a path to improve the detection limit using squeezed light spectroscopy [18,19]. Since photon shot noise is a fundamental limit for optical detection, it is thus intuitive to deploy the strategy utilizing quantum light to beat this limitation. In fact, applications of quantum light in the context of Raman spectroscopy have been discussed very recently [20-23]. In this paper, we demonstrate the very first quantum-enhanced SBS spectroscopy and imaging that is capable of improving the measurement SNR by 3.4 dB (or improving sensitivity by 1.7 dB [24]) when compared to classical excitation with the same incident light intensity. Our scheme adopts the standard “modulation–demodulation” type of approach (so that weak signal could appear within the spectrum range where the noise level is, or close to, shot-noise limited) that has been employed in some state-of-the-art demonstrations [8,10]; thus, the absolute signal size here is comparable to theirs, only because our quantum light reduces the noise level. Therefore, the SNR is enhanced with respect to classical techniques. The principle of this quantum enhancement is shown in Fig. 1(b). The physical quantity that we measure throughout this work is the stimulated Brillouin gain IB. If the uncertainty of this measurement δIB can be quantum-mechanically “squeezed (β < 1)” so that it is below the shot-noise level (β = 1), then the measurement SNR can be therefore subsequently improved by a factor of 1/β.
The quantum state of light used in this scheme is a two-mode intensity-difference squeezed light generated with the four-wave mixing (FWM) process in an atomic 85Rb vapor cell, which has proven to be a great platform for quantum sensing applications [24-30]. Major advantages of this FWM-based quantum light generation scheme are strong intensity-difference squeezing (greater than 6 dB) and narrowband twin beams (~10 MHz) [31-33], which is extremely beneficial for the intended SBS experiment, where the spectral width of the light source must be well below the Brillouin linewidth, which is typically a few hundreds of megahertz. The SNR for the twin beams, with signal defined as the difference of photon numbers in the twin beams, is better than that for coherent beams by a factor of cosh2r, where r is the well-known squeezing parameter used to characterize the two-mode squeezed state [34]. This improvement in SNR consequently translates to the quantum advantage in the SBS spectroscopy (see Eq. (10) in Supplement 1).
2. RESULTS
The schematic of our experimental setup is shown in Fig. 1(c). Two quantum-correlated beams of light, i.e., the “probe” and “conjugate” beams, are produced with the FWM process in the 85Rb vapor cell. After the cell, the probe beam is overlapped with a counterpropagating laser beam [shown in Fig. 1(c) as “Pump 2”] at a homemade sample holder filled with distilled water, to form a phase-matching geometry for the SBS process depicted in Fig. 1(d). The conjugate beam serves as a reference, and two flip mirrors (FMs) are used for the introduction of two coherent beams so that the whole setup can be converted to a classical version. The water SBS gain is expected to appear at 700 KHz (sum frequency of the amplitude modulations on the two involving beams (see Supplement 1), where the two-mode squeezing is expected to be the best [24,35]. Both pump lasers are locked to external cavities so that the relative frequency between them can be scanned with 40 MHz spectral resolution. Also note that, the SBS gain is measured by a customized balanced detector, which subtracts away common-mode technical noise of the two input beams to better than 25 dB, so that the noise level at 700 KHz (where signal appears) is shot-noise limited. Other experimental details can be found in Supplement 1.
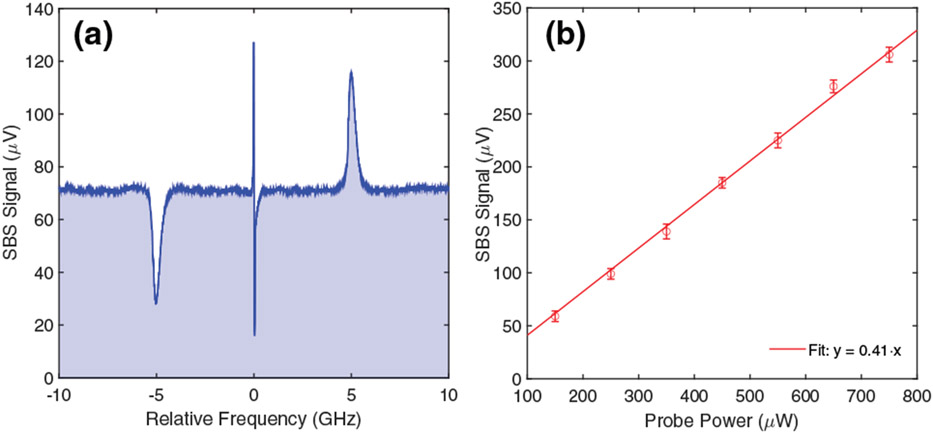
We start with classically characterizing the water SBS gain. Instead of using the squeezed twin beams, we use a balanced coherent detection [by flipping up the two FMs shown in Fig. 1(c)] for this classical measurement, since our quantum light is in a two-mode squeezed state, where, in addition to the probe beam, we always have a quantum-correlated reference/conjugate beam, and the squeezing resides in the intensity-difference of the two involving beams. Figure 2(a) shows a SBS spectrum of distilled H2O (T = 21°C) from a lock-in amplifier (with 300 ms time constant). The coherent beam in the pathway of the probe beam (i.e., the coherent probe) is locked while the pump beam of the SBS process [“Pump 2” in Fig. 1(c)] is scanned with 0.02 Hz scan frequency. The optical powers of the coherent and pump beams at the sample are 300 μW and 36 mW, respectively. From Fig. 2(a), the Brillouin shift and linewidth are measured to be ΩB/2π = 5.01 ± 0.17 GHz and ΓB/2π = 292 ± 27 MHz, which are in good agreement with previous experiments [10]. The dip on the left (at ~−5 GHz) and peak on the right (at ~5 GHz) of zero are the stimulated Brillouin loss and gain peaks, respectively. The center feature is caused by absorptive stimulated Rayleigh scattering. When we change the power of the coherent probe from 150 μW to 750 μW while keeping the pump power at 36 mW, as shown in Fig. 2(b), we clearly observe the expected linear dependency between the SBS gain and the optical power of the coherent probe [10]. Estimation of the SBS gain magnitude can be found in Supplement 1.
Fig. 2.
(a) SBS spectrum of water obtained by a lock-in amplifier; (b) linear dependency can be clearly observed between the water SBS signal (at the peak of gain) and the optical power of a coherent probe.
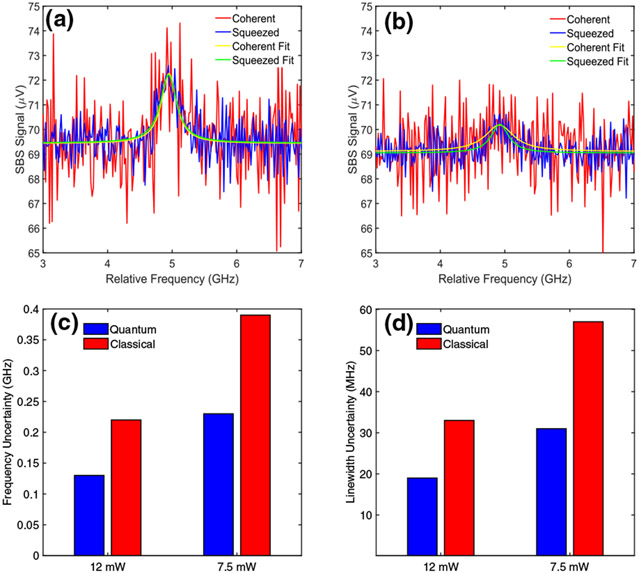
Having characterized the classical SBS process in water, in the following we demonstrate the quantum-enhanced water SBS spectra. To clearly demonstrate quantum-improved performance beyond the classical approach, we conducted the experiment both with the probe beam in a coherent state and in the two-mode squeezed state. The experimental scheme can be easily swapped between the two operations simply by flipping the two FMs up and down depicted in Fig. 1(c). We first use the lock-in amplifier to acquire Brillouin spectra of water to assess frequency shift ΩB and linewidth ΓB at different pump powers under both the quantum and classical configurations. Note that the Brillouin scattering parameters, ΩB and ΓB, are not optical power-dependent. We present quantum-enhanced estimations of the Brillouin scattering parameters in Fig. 3. Figures 3(a) and 3(b) show typical Brillouin spectra of water at room temperature for the pump powers of 12 and 7.5 mW, respectively, and show both the coherent light (red trace) and squeezed light (blue trace) experimental data with their respective Lorentzian fits. The probe power for both cases was kept at 750 μW. We took 20 spectra each for the classical and quantum cases with the two pump powers and fit these spectra with Lorentzian curves. We can clearly see the amplitude of fluctuations/noise for the coherent case (red trace) is much larger (greater than 2 times) than that for the squeezed case (blue trace). In Fig. 3(a), i.e., when the pump power was 12 mW, the fit parameters in the coherent case are: Brillouin shift ΩB/2π = 5.07 ± 0.22 GHz, and linewidth ΓB/2π = 269 ± 33 MHz, whereas in the squeezed case, these parameters are: ΩB/2π = 5.01 ± 0.13 GHz, and ΓB/2π = 277 ± 19 MHz. Error bars in the fitting parameters represent one standard deviation. Examples of these fits are shown as the yellow and green Lorentzian curves for the coherent and squeezed cases, respectively. When the pump power was 7.5 mW shown in Fig. 3(b), the Brillouin gain profile of water is almost completely buried by the fluctuations/noise in the coherent case, which renders the fit parameters with huge error bars. Here the fit parameters are: ΩB/2π = 5.14 ± 0.39 GHz, and ΓB/2π = 521 ± 57 MHz. We can clearly see a broadened linewidth from the coherent fit depicted by the yellow Lorentzian curve, which implies that the fit is not even physically meaningful under this condition, as ΓB/2π = 521 MHz is very far from the theoretical value of 289 MHz [10], whereas in the squeezed case, these fit parameters are still acceptable, with ΩB/2π = 4.91 ± 0.23 GHz, and ΓB/2π = 314 ± 31 MHz. By analyzing these data, we see that the improvement of SNR through the reduction of noise (by a factor of 2) in quantum measurements translates to a corresponding improvement of accuracy of the peak position and linewidth measurements by approximately the same amount (a factor of 2) for absolutely identical conditions of measurement (i.e., pump power, focusing spot size, detectors used, acquisition times, etc.). From the bar plots in Figs. 3(c) and 3(d), we can clearly see the improvement for quantum-enhanced measurements of the Brillouin parameters as compared to that for classical measurements.
Fig. 3.
Demonstration of quantum-enhanced estimations of the Brillouin scattering parameters (i.e., Brillouin shift and linewidth) of water, using probe power of 750 μW and pump power of (a) 12 mW and (b) 7.5 mW. The water SBS spectra were acquired by a lock-in amplifier. The red and blue spectra correspond to the configurations where the probe beam is in a coherent state and in a two-mode squeezed state, respectively. The yellow and green curves are the Lorentzian fits for the red (coherent) and blue (squeezed) spectra, respectively. The bar plots in (c) and (d) represent the uncertainties of estimations of the Brillouin parameters for both the quantum and classical configurations.
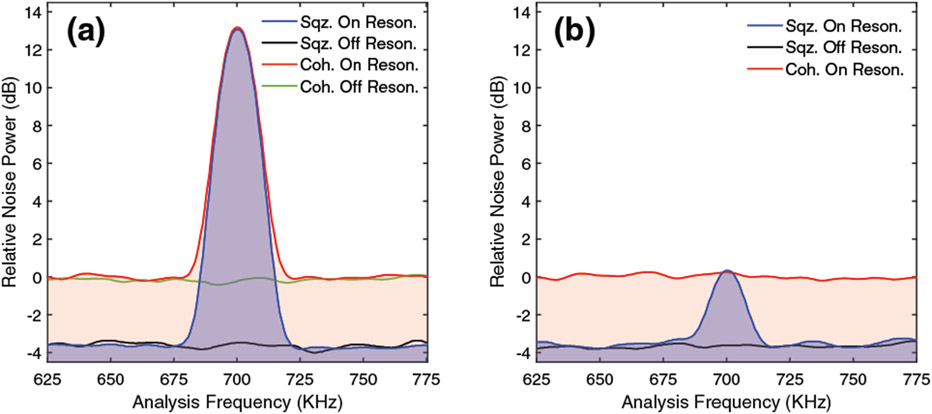
The quantum-enhanced water SBS spectra can also be acquired using an RF spectrum analyzer. The experimental results are presented in Fig. 4. In order to acquire the spectra, both lasers are locked so that their frequency difference matches the Brillouin shift of water, which in our case is 5 GHz, indicated by the gain peak in Fig. 2(a). The data presented in Fig. 4 and the following graphs have all been measured by an RF spectrum analyzer with a resolution bandwidth of 10 KHz and a video bandwidth of 10 Hz. With these bandwidths, the shot-noise level indicated by the red curve is at −69.5 dBm, whereas the electronic noise floor is at −81 dBm. There is no contribution from the stray pump light to the detection noise. We present the spectra for the Brillouin gain of water using coherent beams (red traces) and twin beams (blue traces) with 750 μW probe power, while pump power is kept at 36 mW in Fig. 4(a) and 7.5 mW in Fig. 4(b). It is clear from the spectra that the implementation of twin beams significantly improves the SNR of the SBS gain, and therefore the sensitivity of the Brillouin spectroscopy. We see in particular in Fig. 4(b) that for pump power of 7.5 mW, the Brillouin gain from two coherent beams is almost embedded in shot noise and only becomes pronounced when using twin beams. It is therefore clear that by using the two-mode squeezed light, it is possible to obtain Brillouin gain even for CW pump powers less than 8 mW. This is extremely beneficial when studying fragile biological samples where excessive optical power might damage the sample.
Fig. 4.
Demonstration of quantum-enhanced SBS spectroscopy using probe power of 750 μW and pump power of (a) 36 mW and (b) 7.5 mW. The red and blue SBS traces correspond to the configurations where the probe beam is in a coherent state and in a two-mode squeezed state, respectively. The green and black traces correspond to the realization where the two lasers are locked outside of the water SBS gain profile. All traces are normalized to the shot-noise level.
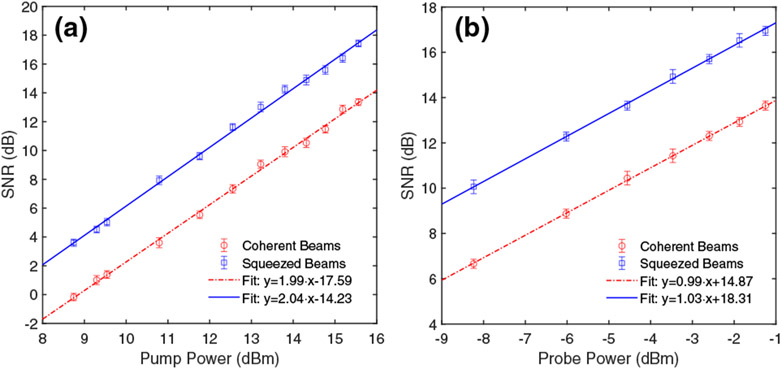
We also plot in Fig. 5 the SNR of the water SBS gain as a function of optical power (in decibels) of the two input beams [Figs. 5(a) and 5(b) are for the pump and probe beams, respectively] for the cases where the probe beam is in a coherent state (red circles) and in a two-mode squeezed state (blue squares). The probe beam power is kept at 750 μW in Fig. 5(a), and the pump beam power is kept at 36 mW in Fig. 5(b). The error bars correspond to 1 standard deviation. From the fits, we see nice linear dependence of the SBS gain on the pump power with slopes of 1.99 and 2.04 in Fig. 5(a), and on the probe power with slopes of 0.99 and 1.03 in Fig. 5(b), which matches our expectations of 2 and 1 for Figs. 5(a) and 5(b), respectively (see Supplement 1. Also notice that, the average noise suppression (in decibels) below the shot-noise level can be calculated from the fitting parameters as 17.59–14.23 = 3.36 dB and 18.31–14.87 = 3.44 dB for Figs. 5(a) and 5(b), respectively. This is the quantum advantage of the two-mode squeezed light over coherent light in the SNR of gain measurement for the SBS spectroscopy. Note that in terms of the sensitivity of the gain measurement, our scheme is also sub-shot-noise-limited , which is ~ 1.7 dB below shot-noise limit [24] (See also Supplement 1). However, for applications in biological imaging, the incident intensity is always limited by a number of effects related to phototoxicity. Thus, even a tiny enhancement (< 1 dB), as it was recently shown by Casacio et al. [20], makes a huge difference in improving image contrast, which has a tremendous impact in biological imaging.
Fig. 5.
SNR of the SBS gain peak of water as a function of optical power (in decibels) of (a) pump beam and (b) probe beam. The red circles and dotted-dashed fit line correspond to the probe beam being in a coherent state, while the blue squares and solid fit line correspond to the probe beam being in a two-mode squeezed state.
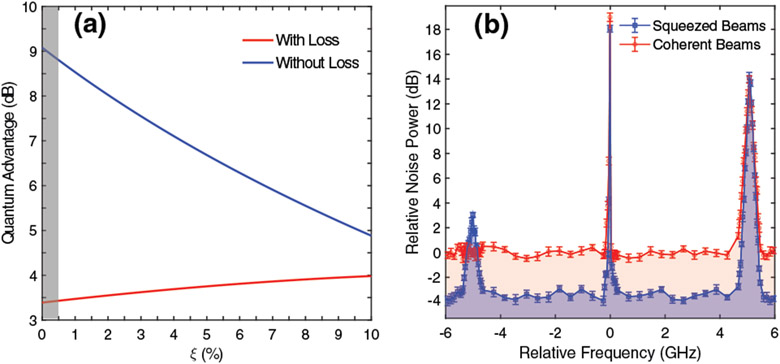
This ~3.40 dB quantum advantage can be calculated with a theoretical framework, assuming that both twin beams are in single modes (see Supplement 1). The theoretical quantum advantage (i.e., the improvement in SNR) as a function of ξ = G − 1, where G is the SBS gain, is shown in Fig. 6(a) as the red curve. Since ξ is in the range of 10−6 to 10−5 (see Supplement 1) (within the region highlighted by the gray bar), the measured (~3.40 dB quantum advantage agrees very well with our theoretical prediction. Also note that with loss absent, as shown by the blue curve, the SBS gain only degrades the quantum advantage because the gain process itself introduces noise, whereas with loss present, the SBS gain instead improves the degradation of quantum advantage due to the competition between the gain and loss.
Fig. 6.
(a) Theoretical prediction for the quantum advantage as a function of the SBS gain related parameter ξ = G − 1. The red curve is plotted with experimental conditions, while the blue curve is plotted with no loss present. (b) SBS spectrum ofwater acquired using an RF spectrum analyzer.
The SBS spectrum of water acquired by a lock-in amplifier shown in Fig. 2(a) can also be attained using the RF spectrum analyzer. The results are shown in Fig. 6(b). This requires scanning the locking frequency of the pump laser while keeping the locking frequency of the probe laser fixed. All data points are obtained by normalizing the water SBS gain at 700 KHz to the shot-noise level, and error bars correspond to 1 standard deviation. The powers of the two laser beams are the same as in Fig. 4(a). A quantum advantage of ~3.40 dB can be clearly seen from these two spectra. It is also worth pointing out that the classical approach is not able to detect the SBS loss dip at −5 GHz using a spectrum analyzer, as small differential absorption of two coherent beams would always be at the shot-noise level, whereas the SBS loss is observable with a lock-in amplifier, as shown in Fig. 2(a).
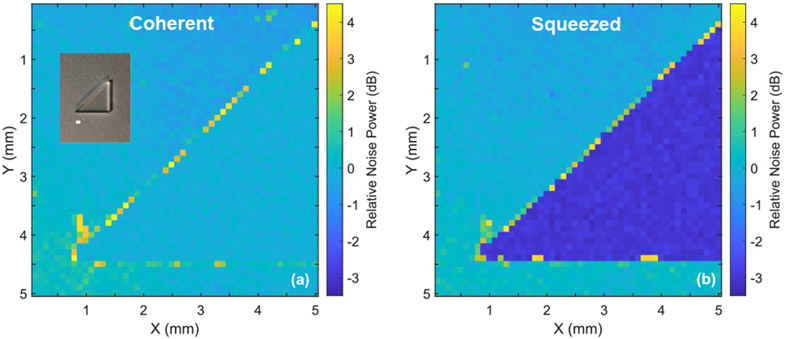
As the final step, we demonstrate that our scheme can also be utilized for microscopic imaging. We use the SBS gain of water to acquire a two-dimensional image of a piece of triangle-shaped glass, as shown in the inset of Fig. 7(a). The pump and probe powers are 7.5 mW and 750 μW, respectively (further image acquisition details can be found in Supplement 1). Pixels in Figs. 7(a) and 7(b) are registered with the probe beam being in a coherent state and the two-mode squeezed state, respectively. Obviously, the image contrast (i.e., the SNR) for the glass triangle in Fig. 7(a) is unappreciable because the coherent light-induced SBS gain of water is overwhelmed by the shot noise [see the red curve in Fig. 4(b)]. By using the two-mode squeezed light, however, a clear image contrast of more than 3 dB for the glass triangle is obtained in Fig. 7(b) [see the blue curve in Fig. 4(b)]. Notice that each pixel in Fig. 7 takes ~2 s to obtain; this seemingly slow acquisition time is not fundamentally limited by our scheme itself, but is rather technically limited by the instrument (i.e., the “write” and “read” time of the instrument-computer interface). In principle, our acquisition rate can be readily improved to be 240 ms per 4 GHz spectrum, with only 8.25 mW total excitation power (see Ref. [8] for the state-of-the-art SBS imaging performance, and Supplement 1 for a detailed discussion on our scheme’s usefulness and limitations).
Fig. 7.
Quantum-enhanced microscopic imaging using water as the signal medium. The imaging object is a triangle-shaped piece of glass shown in the inset of (a), where the white scale bar is 1 mm in horizontal direction. More than 3 dB quantum-enhanced SNR, or image contrast, is clearly visible in (b).
Note that our sample is composed of only two components: glass and water. Since glass has no Brillouin peak around 5 GHz, the SBS signal only comes from water by scanning the laser around 5 GHz. Therefore, if we were to acquire the image of a glass triangle by presenting the Brillouin shift estimation, that would look almost the same as Fig. 7, the only difference being that the acquisition time would be significantly extended due to the need to acquire the entire spectrum at each pixel. In this work, we follow the earlier established protocol for SBS microscopy (Ref. [10]) to display the intensity of signal taken at the peak of the Brillouin spectrum for a given material as a function of position.
It is also worth mentioning that our probe power can go up to almost 5 mW. The 750 μW upper bound is chosen here simply because the balanced detector would be saturated at 1 mW of input power. This limitation is, again, not fundamental to our scheme; an AC-coupled balanced detector would overcome it. The lateral and axial resolutions in this work are 5 μm and 70 μm, respectively, which can also be readily improved to be 1.5 μm and 4.5 μm, respectively, using molded aspheric lenses (see Supplement 1 for a detailed discussion).
3. CONCLUSION
In conclusion, we demonstrated a quantum-enhanced CW SBS spectroscopy and imaging scheme. As a proof-of-principle, we acquired an SBS spectrum of water and a two-dimensional microscopic image with quantum-enhanced SNR/contrast of ~3.4 dB. The quantum enhancement is achieved by using the two-mode intensity-difference squeezed light with a spectral width in the range of 10 MHz generated by the FWM process in atomic 85Rb vapor. It is very important to note that it is this unique narrowband feature of our squeezed light that makes the quantum-enhanced SBS spectroscopy and imaging system possible; for the SBS process to occur, the spectral width of the light source must be well below the Brillouin linewidth (~300 MHz MHz in this work). The low optical power (can be <8 mW) and the excitation wavelengths in the water transparency window used in this work have made our system very applicable for probing mechanical properties of biological samples, which will be the subject of our future study.
Supplementary Material
Funding.
Cancer Prevention and Research Institute of Texas (RP180588); Welch Foundation (A-1943); National Institute of General Medical Sciences (1R01GM127696, 1R21GM142107); National Cancer Institute (1R21CA269099); U.S. Army Medical Command (W81XWH2010777); Air Force Office of Scientific Research (FA-9550-20-1-0366, FA9550-20-1-0367); National Science Foundation (CMMI-1826078).
Footnotes
Disclosures. The authors declare no conflicts of interest.
Supplemental document. See Supplement 1 for supporting content.
Data availability.
Data underlying the results may be obtained from the authors upon reasonable request.
REFERENCES AND NOTE
- 1.Kargar F and Balandin AA, “Advances in Brillouin–Mandelstam light-scattering spectroscopy,” Nat. Photonics 15, 720–731 (2021). [Google Scholar]
- 2.Poon C, Chou J, Cortie M, and Kabakova I, “Brillouin imaging for studies of micromechanics in biology and biomedicine: from current state-of-the-art to future clinical translation,” J. Phys. Photon 3, 012002 (2020). [Google Scholar]
- 3.Prevedel R, Diz-Muñoz A, Ruocco G, and Antonacci G, “Brillouin microscopy: an emerging tool for mechanobiology,” Nat. Methods 16, 969–977 (2019). [DOI] [PubMed] [Google Scholar]
- 4.Palombo F and Fioretto D, “Brillouin light scattering: applications in biomedical sciences,” Chem. Rev 119, 7833–7847 (2019). [DOI] [PMC free article] [PubMed] [Google Scholar]
- 5.Scarponi F, Mattana S, Corezzi S, Caponi S, Comez L, Sassi P, Morresi A, Paolantoni M, Urbanelli L, Emiliani C, Roscini L, Corte L, Cardinali G, Palombo F, Sandercock JR, and Fioretto D, “High-performance versatile setup for simultaneous Brillouin-Raman microspectroscopy,” Phys. Rev. X 7, 031015 (2017). [Google Scholar]
- 6.Meng Z, Traverso AJ, Ballmann CW, Troyanova-Wood MA, and Yakovlev VV, “Seeing cells in a new light: a renaissance of Brillouin spectroscopy,” Adv. Opt. Photon 8, 300–327 (2016). [Google Scholar]
- 7.Scarcelli G and Yun SH, “Confocal Brillouin microscopy for three-dimensional mechanical imaging,” Nat. Photonics 2, 39–43 (2008). [DOI] [PMC free article] [PubMed] [Google Scholar]
- 8.Remer I, Shaashoua R, Shemesh N, Ben-Zvi A, and Bilenca A, “High-sensitivity and high-specificity biomechanical imaging by stimulated Brillouin scattering microscopy,” Nat. Methods 17, 913–916 (2020). [DOI] [PubMed] [Google Scholar]
- 9.Ballmann CW, Meng Z, Traverso AJ, Scully MO, and Yakovlev VV, “Impulsive Brillouin microscopy,” Optica 4, 124–128 (2017). [Google Scholar]
- 10.Ballmann CW, Thompson JV, Traverso AJ, Meng Z, Scully MO, and Yakovlev VV, “Stimulated Brillouin scattering microscopic imaging,” Sci. Rep 5, 18139 (2015). [DOI] [PMC free article] [PubMed] [Google Scholar]
- 11.Bottani CE and Fioretto D, “Brillouin scattering of phonons in complex materials,” Adv. Phys.X 3, 1467281 (2018). [Google Scholar]
- 12.Vaughan J and Randall J, “Brillouin scattering, density and elastic properties of the lens and cornea of the eye,” Nature 284, 489–491 (1980). [DOI] [PubMed] [Google Scholar]
- 13.Bausch A and Kroy K, “A bottom-up approach to cell mechanics,” Nat. Phys 2, 231–238 (2006). [Google Scholar]
- 14.Ballmann CW, Meng Z, and Yakovlev VV, “Nonlinear Brillouin spectroscopy: what makes it a better tool for biological viscoelastic measurements,” Biomed. Opt. Express 10, 1750–1759 (2019). [DOI] [PMC free article] [PubMed] [Google Scholar]
- 15.Bao G and Suresh S, “Cell and molecular mechanics of biological materials,” Nat. Mater 2, 715–725 (2003). [DOI] [PubMed] [Google Scholar]
- 16.Chiao RY, Townes CH, and Stoicheff BP, “Stimulated Brillouin scattering and coherent generation of intense hypersonic waves,” Phys. Rev. Lett 12, 592–595 (1964). [Google Scholar]
- 17.Coker Z, Troyanova-Wood M, Traverso AJ, Yakupov T, Utegulov ZN, and Yakovlev VV, “Assessing performance of modern Brillouin spectrometers,” Opt. Express 26, 2400–2409 (2018). [DOI] [PubMed] [Google Scholar]
- 18.Yu H, McCuller L, Tse M, Kijbunchoo N, Barsotti L, and Mavalvala N, and members of the LIGO Scientific Collaboration, “Quantum correlations between light and the kilogram-mass mirrors of LIGO,” Nature 583, 43–47 (2020), where they used the theoretical work developed by W. G. Unruh in Ref. [19]. [DOI] [PubMed] [Google Scholar]
- 19.Unruh WG, Quantum Optics, Experimental Gravitation, and Measurement Theory (Plenum, 1982). [Google Scholar]
- 20.Casacio CA, Madsen LS, Terrasson A, Waleed M, Barnscheidt K, Hage B, Taylor MA, and Bowen WP, “Quantum-enhanced nonlinear microscopy,” Nature 594, 201–206 (2021). [DOI] [PubMed] [Google Scholar]
- 21.de Andrade RB, Kerdoncuff H, Berg-Sørensen K, Gehring T, Lassen M, and Andersen UL, “Quantum-enhanced continuous-wave stimulated Raman scattering spectroscopy,” Optica 7,470–475 (2020). [Google Scholar]
- 22.Svidzinsky A, Agarwal G, Classen A, Sokolov AV, Zheltikov A, Zubairy MS, and Scully MO, “Enhancing stimulated Raman excitation and two-photon absorption using entangled states of light,” Phys. Rev. Res 3,043029(2021). [Google Scholar]
- 23.Dorfman KE, Schlawin F, and Mukamel S, “Nonlinear optical signals and spectroscopy with quantum light,” Rev. Mod. Phys 88, 045008 (2016). [Google Scholar]
- 24.Li F, Li T, Scully MO, and Agarwal GS, “Quantum advantage with seeded squeezed light for absorption measurement,” Phys. Rev. Appl 15, 044030(2021). [Google Scholar]
- 25.Dorfman K, Liu S, Lou Y, Wei T, Jing J, Schlawin F, and Mukamel S, “Multidimensional four-wave mixing signals detected by quantum squeezed light,” Proc. Natl. Acad. Sci. USA 118, e2105601118 (2021). [DOI] [PMC free article] [PubMed] [Google Scholar]
- 26.Prajapati N, Niu Z, and Novikova I, “Quantum-enhanced two-photon spectroscopy using two-mode squeezed light,” Opt. Lett 46, 1800–1803 (2021). [DOI] [PubMed] [Google Scholar]
- 27.Dowran M, Kumar A, Lawrie BJ, Pooser RC, and Marino AM, “Quantum-enhanced plasmonic sensing,” Optica 5, 628–633 (2018). [Google Scholar]
- 28.Anderson BE, Gupta P, Schmittberger BL, Horrom T, Hermann-Avigliano C, Jones KM, and Lett PD, “Phase sensing beyond the standard quantum limit with a variation on the SU(1,1) interferometer,” Optica 4, 752–756 (2017). [Google Scholar]
- 29.Li T, Anderson BE, Horrom T, Schmittberger BL, Jones KM, and Lett PD, “Improved measurement of two-mode quantum correlations using a phase-sensitive amplifier,” Opt. Express 25, 21301–21311 (2017). [DOI] [PubMed] [Google Scholar]
- 30.Pooser RC and Lawrie B, “Ultrasensitive measurement of microcantilever displacement below the shot-noise limit,” Optica 2, 393–399 (2015). [Google Scholar]
- 31.Li F, Li T, and Agarwal GS, “Experimental study of decoherence of the two-mode squeezed vacuum state via second harmonic generation,” Phys. Rev. Res 3, 033095 (2021). [Google Scholar]
- 32.Clark JB, Glasser RT, Glorieux Q, Vogl U, Li T, Jones KM, and Lett PD, “Quantum mutual information of an entangled state propagating through a fast-light medium,” Nat. Photonics 8, 515–519 (2014). [Google Scholar]
- 33.Glasser RT, Vogl U, and Lett PD, “Stimulated generation of superluminal light pulses via four-wave mixing,” Phys. Rev. Lett 108, 173902 (2012). [DOI] [PubMed] [Google Scholar]
- 34.Boyd RW, Nonlinear Optics (Academic, 2008). [Google Scholar]
- 35.Li T, Li F, Altuzarra C, Classen A, and Agarwal GS, “Squeezed light induced two-photon absorption fluorescence of fluorescein biomarkers,” Appl. Phys. Lett 116, 254001 (2020). [Google Scholar]
Associated Data
This section collects any data citations, data availability statements, or supplementary materials included in this article.
Supplementary Materials
Data Availability Statement
Data underlying the results may be obtained from the authors upon reasonable request.


