Abstract
Convolutional neural networks (CNNs) have been extremely successful in various medical imaging tasks. However, because the size of the convolutional kernel used in a CNN is much smaller than the image size, CNN has a strong spatial inductive bias and lacks a global understanding of the input images. Vision Transformer, a recently emerged network structure in computer vision, can potentially overcome the limitations of CNNs for image-reconstruction tasks. In this work, we proposed a slice-by-slice Transformer network (SSTrans-3D) to reconstruct cardiac SPECT images from 3D few-angle data. To be specific, the network reconstructs the whole 3D volume using a slice-by-slice scheme. By doing so, SSTrans-3D alleviates the memory burden required by 3D reconstructions using Transformer. The network can still obtain a global understanding of the image volume with the Transformer attention blocks. Lastly, already reconstructed slices are used as the input to the network so that SSTrans-3D can potentially obtain more informative features from these slices. Validated on porcine, phantom, and human studies acquired using a GE dedicated cardiac SPECT scanner, the proposed method produced images with clearer heart cavity, higher cardiac defect contrast, and more accurate quantitative measurements on the testing data as compared with a deep U-net.
Index Terms—: Deep Learning, Dedicated Cardiac SPECT, Few-angle Imaging, GE Discovery NM 530/570c, Transformer
I. Introduction
According to the World Health Organization (WHO), cardiovascular diseases (CVDs) are major causes of death globally. Around 17.9 million people died from CVDs in 2019, accounting for 32% of all global deaths [1]. Single-photon emission computed tomography (SPECT) is a major tool used to detect and manage CVDs. For cardiac imaging, conventional dual-head SPECT scanners subject to various limitations and drawbacks such as long acquisition time, high radiation dose, low photon sensitivity, etc. The introduction of dedicated cardiac SPECT systems addressed the disadvantages of conventional SPECT systems and substantially advanced the field [2].
The GE Discovery NM 530/570c (DNM) dedicated cardiac SPECT scanner is one of the available SPECT scanners in the field [3]. It consists of 19 cadmium zinc telluride (CZT) detector modules, each with a pinhole collimator. The detector array is designed to acquire 19 projections simultaneously over a 180-degree arch for stationary imaging. We previously developed an approach to acquire multiple projection angle sets by rotating and translating the detector and reconstructing the images with 76 projection views (19 projections × 4 angles) [4]. However, because rotating and translating the detector array are not practical in reality, a deep convolutional neural network (CNN) was also proposed to learn the mapping between one-angle images (19 projections) and four-angle images (76 projections) [4]. In this way, the image quality could be improved for data with stationary acquisition of 19 projections. Previous results showed that the proposed multi-angle reconstruction protocol and deep CNN improved the image quality with potentially better defect measurements. Sample reconstructed slices from a porcine study using one-angle data (19 projections) and four-angle data (76 projections) are presented in Fig. 1.
Fig. 1.
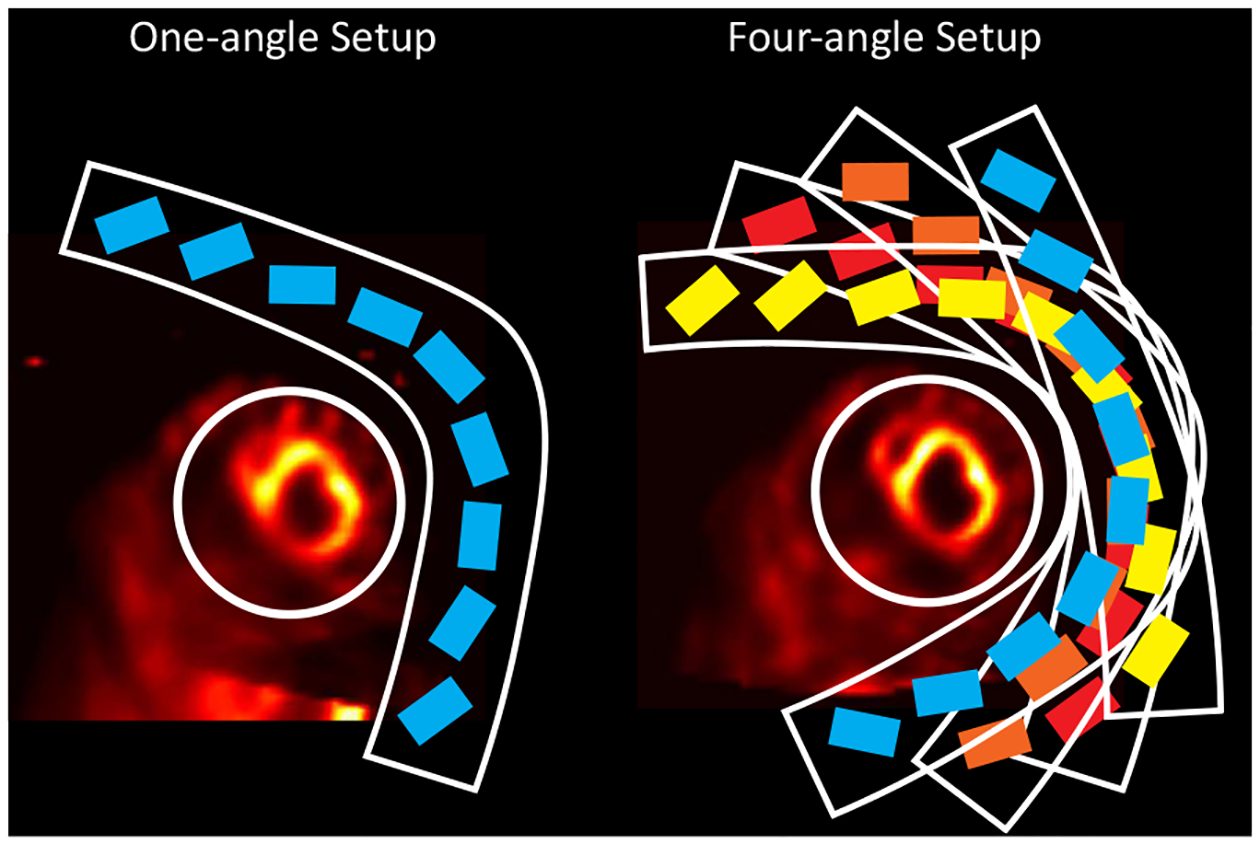
A porcine study reconstructed using one-angle data and four-angle data. Note that the image resolution significantly improved using four-angle data with the proposed multi-angle reconstruction protocol in our previous work [4]. rectangles enclosed by the L-shape arc represent CZT detector modules in the scanners. Mounted on an L-shaped arc, all the 19 CZT detectors in the detector array were arranged in three rows. The center row has 9 detectors and each of the outer two rows has 5 detectors. The white circles denote the FOV of the scanner.
In the past years, CNNs have been applied to different medical imaging tasks [5]–[7]. However, because the dimension of the convolutional kernel used in a CNN is much smaller compared to the image size, CNN has a strong spatial inductive bias and lacks a global understanding of the input images [8]. Therefore, designing a network that can capture global information of the images could potentially improve the image reconstruction results. Transformer [9] is a possible network architecture to overcome the limitations of CNNs for image-reconstruction tasks.
Transformer, originally designed for natural language processing (NLP) [9], takes the whole language sentence as input to the network. By doing this, Transformer addresses the long-range dependencies problem in recurrent neural network (RNN) [10] and its variants [11]. Recently, Transformer has been adapted for image-related tasks. For example, vision Transformer (ViT) [12] was proposed for image recognition task. ViT crops the input images to fixed-size patches as input to the network, and the attention layers in ViT allow it to integrate global information across all the patches.
Inspired by the original Transformer network [9] and the ViT [12], we proposed a slice-by-slice 3D Transformer (SSTrans-3D) for 3D cardiac SPECT image reconstruction. Because it is computationally challenging to reconstruct the entire 3D volume directly using Transformer, images are reconstructed in a slice-by-slice manner in SSTrans-3D. Both input and output to the SSTrans-3D are 3D image volumes, and the network can still obtain a global understanding of the input image volume due to the attention mechanism in Transformer. We also took advantage of the slice-by-slice reconstruction scheme by utilizing the already-reconstructed slices as additional inputs to the network. Because already-reconstructed slices are expected to have higher quality than original input (one-angle images), SSTrans-3D can potentially obtain more informative image features from these slices.
II. Materials and Methods
A. Datasets and Acquisition
A total of eight porcine 99mTc-tetrosfomin SPECT/CT studies were acquired prospectively. Five of the SPECT/CT image sets were acquired in normal control animals without cardiac defects. The remaining three pigs were injected with 99mTc-tetrosfomin during angioplasty balloon occlusion of the left anterior descending coronary artery for 90 minutes, creating an anteroseptal myocardial infarct and regional myocardial perfusion defect. The SPECT detector array was rotated to four different angles for data acquisition. Four projection-sets were acquired at 300°, 305°, 310°, and 315° respectively. Detector angle at 315° is the default acquisition angle for routine clinical use. The detector array was also translated along the diagonal direction to ensure the heart is inside the fully reconstructable field-of-view (FOV), which is about 19 cm in diameter. Similar to the porcine studies, two physical phantom scans were acquired using the Data Spectrum cardiac torso phantom. One of the physical phantom scans is completely normal and has no perfusion defect. The other physical phantom scan has two defects that were inserted in the mid-ventricle and the basal regions, respectively. The defect placed in the basal region is exactly two times larger than that in the mid-ventricle region. Twenty clinical anonymized 99mTc-tetrofosmin human studies were also included for evaluation. Note that we have not acquired multi-angle data for human studies yet. The use of animal and human data in this study was approved by the Institutional Animal Care & Use Committee (IACUC) and Institutional Review Board (IRB) of Yale University, respectively.
B. Multi-angle Reconstruction with DNM
Because of the special geometry of the scanner, when the detector array is rotated/translated to different positions, the center of the FOV is also altered, and system matrix for multi-angle reconstructions was not available. Hence, we were unable to combine projections acquired at different angles directly. During the multi-angle reconstruction process, the amount of rotation (5 degrees in this work) and the distance between the centers of FOVs were incorporated into the maximum likelihood expectation maximization (MLEM) algorithm [13]. Computed tomography (CT) attenuation maps acquired at 315° were used for attenuation corrections (AC).
C. U-net Structure
The proposed Transformer network was compared with the 3D CNN network we proposed previously [4]. The 3D CNN adapted a U-net-like [14] structure with four down-sampling and four up-sampling layers. 3D convolutional layers with 32 filters and 1 × 3 × 3 kernel were used for down-sampling and up-sampling, so that the number of slices did not change throughout the network. A four-layer dense-net [15] was added after each down-sampling and up-sampling layer. Each 3D convolutional layer in dense-net block had 32 kernels with dimension 3 × 3 × 3. Conveying paths were used to connect earlier layers to later layers. Both input and output to the network are a batch of 3D image volumes with dimension Nb × 50 × 70 × 70, where Nb denotes the number of input batches. Rectified Linear Unit (ReLU) was used as the activation function after each convolutional layer. Stride equaled 1 in all convolutional layers. Zero-padding was not implemented. The overall network structure of the U-net is presented in Fig. 2.
Fig. 2.
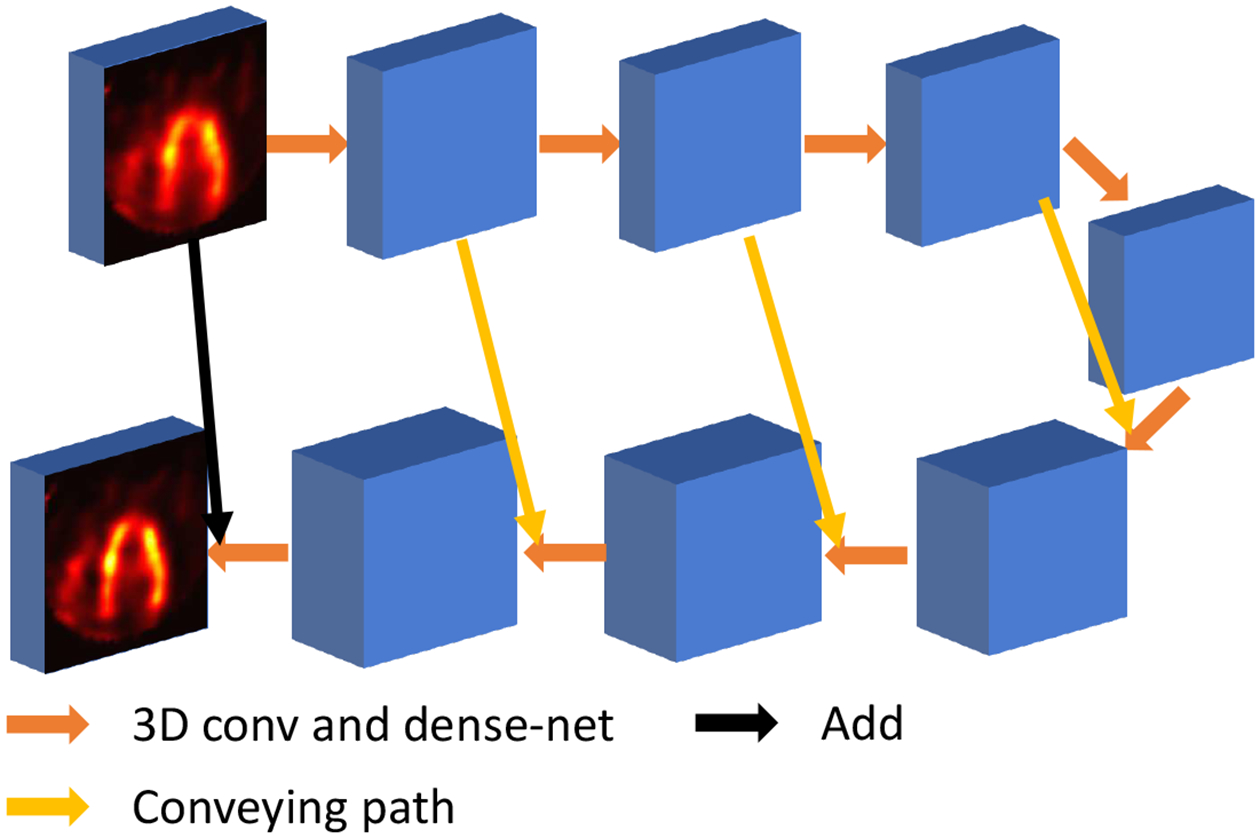
U-net structure proposed in our previous work [4].
D. Transformer Network Structure
Here, we proposed a slice-by-slice Transformer network (SSTrans-3D) for 3D SPECT cardiac image reconstructions. The overall structure of SSTrans-3D is presented in Fig. 3. The input to the Transformer is a batch of 3D image volumes with dimension Nb × 50 × 70 × 70. In ViT, input images are divided into small patches and then fed into the Transformer blocks. These divided patches can be understood as individual words in the case of NLP. Similarly, in SSTrans-3D, the input image volumes are divided into 50 patches/slices as the input to the Transformer blocks (i.e., each slice is treated as a patch in SSTrans-3D). Each patch/slice is projected to a vector with dimension 1 × 500. Trainable position encoding was also implemented in SSTrans-3D. The structures of the Transformer encoder and Transformer decoder are similar to that proposed in the original Transformer [9]. No normalization layer was implemented in SSTrans-3D. The outputs from both Transformer encoder and decoder are projected to a vector with dimension 70 × 70, and then added together to generate one reconstructed slice. This whole process is repeated 50 times to generate the entire volume with dimension 70×70×50, with a voxel size of 43mm3. An eight-layer CNN is added afterward to further remove artifacts and noise. These eight convolutional layers have 32 kernels with dimension 3 × 3 × 3, followed by ReLU as the activation function. The one-angle image volumes are added to the output from CNN for final reconstructions. Note that the red patches/slices in Fig. 3 represent the slices reconstructed by the network during the repeating process. Because these reconstructed slices are expected to have better quality than the original input slices, using these reconstructed slices as the input could help the network to gather more informative features and potentially improve the final results. To be specific, the network loops 50 times to generate the whole reconstructed volume. In the ith loop, the patches/slices before ith patch/slice are replaced by the reconstructed slices. Each loop has different trainable parameters.
Fig. 3.
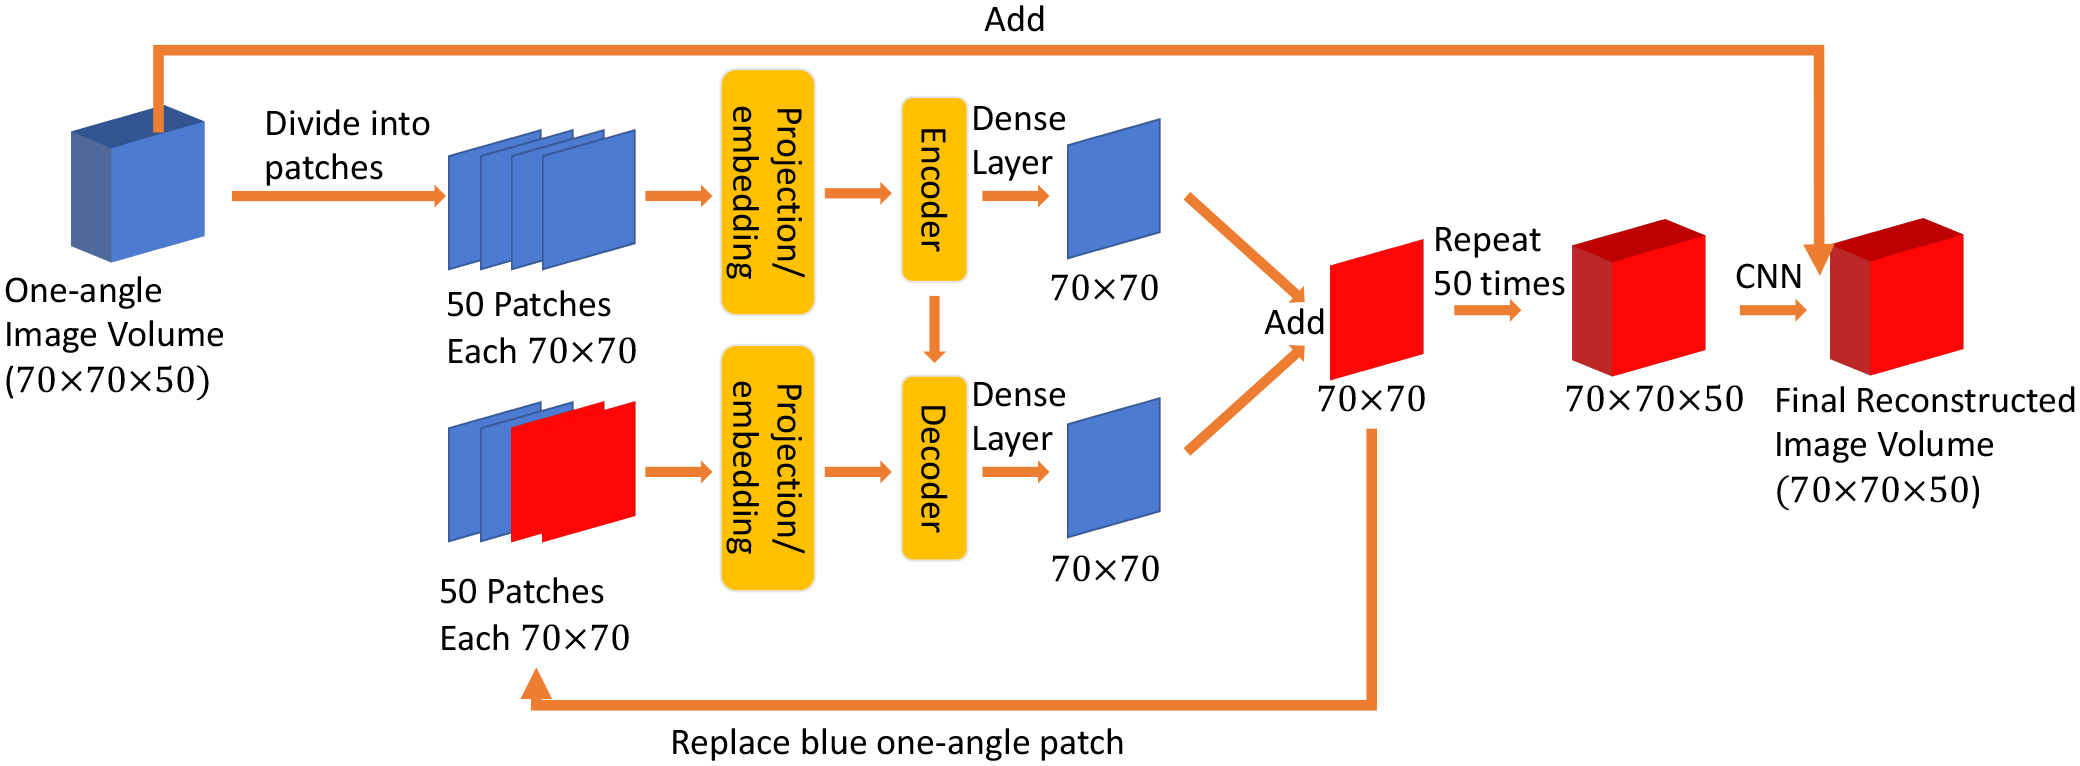
Proposed SSTrans-3D. The slices/volumes in red represent the network-reconstructed results. The patches in blue represent the input to the network (images reconstructed using one-angle data). Structures of encoder and decoder are the same as the proposed in the original Transformer without normalization layers. During the repeating process, already reconstructed slices (red) are used to replace the one-angle patches in the input to the decoder part of the network.
E. Optimization and Training
The objective function used to optimize both U-net and SSTrans-3D includes mean-absolute-error (MAE), and structural similarity index measurement (SSIM) [16]. The composite loss function for both networks can be formulated as:
| (1) |
where G denotes either the U-net or SSTrans-3D, and θG represents the trainable parameters of G. λa denotes a hyper-parameter used to balance the MAE loss ℓMAE and SSIM loss ℓSSIM. Ione and Ifour represent image volumes reconstructed using one-angle data and four-angle data respectively. λa = 0.8 was fine-tuned experimentally.
SSIM measures structural similarity between two images. The Gaussian filter size used to measure SSIM is set as 11×11. The maximum possible value for SSIM is 1 when two images are identical. Hence, ℓSSIM is defined as:
| (2) |
where Xij and Yij represent 2D image slices in a batch of 3D image volumes.
The Adam method [17] was used to optimize both U-net and SSTrans-3D with two exponential decay rates β1 = 0.9 and β2 = 0.999. The Xavier method [18] was used for parameter initialization. Due to the limited amount of multi-angle data, both networks were first pre-trained with 250 volumes of simulated 4D extended cardiac-torso (XCAT) phantoms [19] and then fine-tuned using multi-angle porcine and physical phantom data. The 250 volumes of XCAT phantom were simulated with varying heart sizes, genders, heart orientations, body anatomy, etc.
For XCAT phantom simulations, projection data were simulated by multiplying the system matrix and the simulated XCAT volumes. Projection data at different angles were acquired by rotating the simulated phantom volumes along the center axis, so that the centers of FOV are consistent and the problem mentioned above can be avoided. Also, because there was no attenuation effect during the simulations, AC was not considered for XCAT phantoms. Lastly, because the DNM scanner has a small FOV, 50 × 70 × 70 is not sufficiently larger to cover all the tissues in the simulated phantoms. For a more realistic simulation, a larger system matrix covering 150 × 150 × 150 was used to generate projection data and then reconstructed into the 50×70×70 matrix size. Calculated based on NVIDIA Quadro RTX 8000 GPUs, training time of U-net and SSTrans-3D for one update with one image volume were 0.3 and 6.2 seconds, respectively. The corresponding testing time for one image volume were 0.2 and 2.6 seconds respectively.
F. Statistical and Clinical Evaluations
In this work, network performance was evaluated using root-mean-square error (RMSE), peak signal-to-noise ratio (PSNR), and SSIM [16]. Paired t-test was used to test the statistical significance in this study (p-value p < 0.05 indicates statistical significance)
The FDA 510(k)-cleared Wackers-Liu Circumferential Quantification (WLCQ™, VoxelOn Inc., Watertown, CT) software [20] was used to calculate the myocardial perfusion defect size. Defect size was calculated based on the circumferential count profiles of the short axis (SA) and horizontal long axis (HLA). Specifically, the circumferential count profiles were compared with a normal database precalculated from a population of normal subjects. WLCQ quantified the defect size into four anatomical regions, including apical, mid-ventricle, basal, and apex. The calculated defect size is expressed as a percentage of left ventricular myocardium (%LV) that has lower tracer uptake than normal subjects. Note that because a normal database was not available for porcine and physical phantom studies, a 80% threshold of the circumferential count profiles was used to calculate defect size. We expect that the network results and multi-angle reconstructions should have improved image resolution, higher measured defect size for abnormal subjects, and lower measured defect size for normal subjects. Myocardium to blood-pool ratio was also included as a metric for human, porcine, and physical phantom studies. It is defined as the ratio between the mean activities of the myocardium and the mean activities of the blood pool. We expect the image resolution to be improved after applying the neural networks, leading to higher myocardium to blood-pool ratios. For 99mTc-tetrosfomin imaging, higher ratio is favorable and typically represents higher image resolution.
III. Results
A. Physical Phantom Results
Fig. 4 presents the physical phantom scan with perfusion defects. All the cardiac images were re-sliced to SA, HLA, and vertical long axis (VLA) slices and presented in this work. Two defects in this scan were added in the mid-ventricle and basal regions, respectively. As presented in Fig. 4, the measured defect size is larger in neural networks and multi-angle reconstructions, which is consistent with our expectations and the presented polar maps. Compared with U-net, SSTrans-3D produced images with better defect contrast in the mid-ventricle regions (blue arrows in Fig. 4). Also, as shown in the SA slice, pointed by the green arrows, there are some undesired artifacts in the one-angle image, which may be noise. But U-net enhanced these undesired artifacts. SSTrans-3D, however, suppressed these undesired artifacts, producing a better reconstruction in this scan. Lastly, because the defect added in the basal region is exactly two times larger than that in the mid-ventricle region, the ratio between the defect sizes in basal and mid-ventricle regions can be computed. This ratio should be exactly 2. The calculated ratios for one-angle, U-net, SSTrans-3D, and four-angle image volumes are 1.72, 1.75, 1.86, and 2.14 respectively. Compared with the U-net results, SSTrans-3D demonstrates better defect quantification in this scan as the ratio is closer to 2.
Fig. 4.
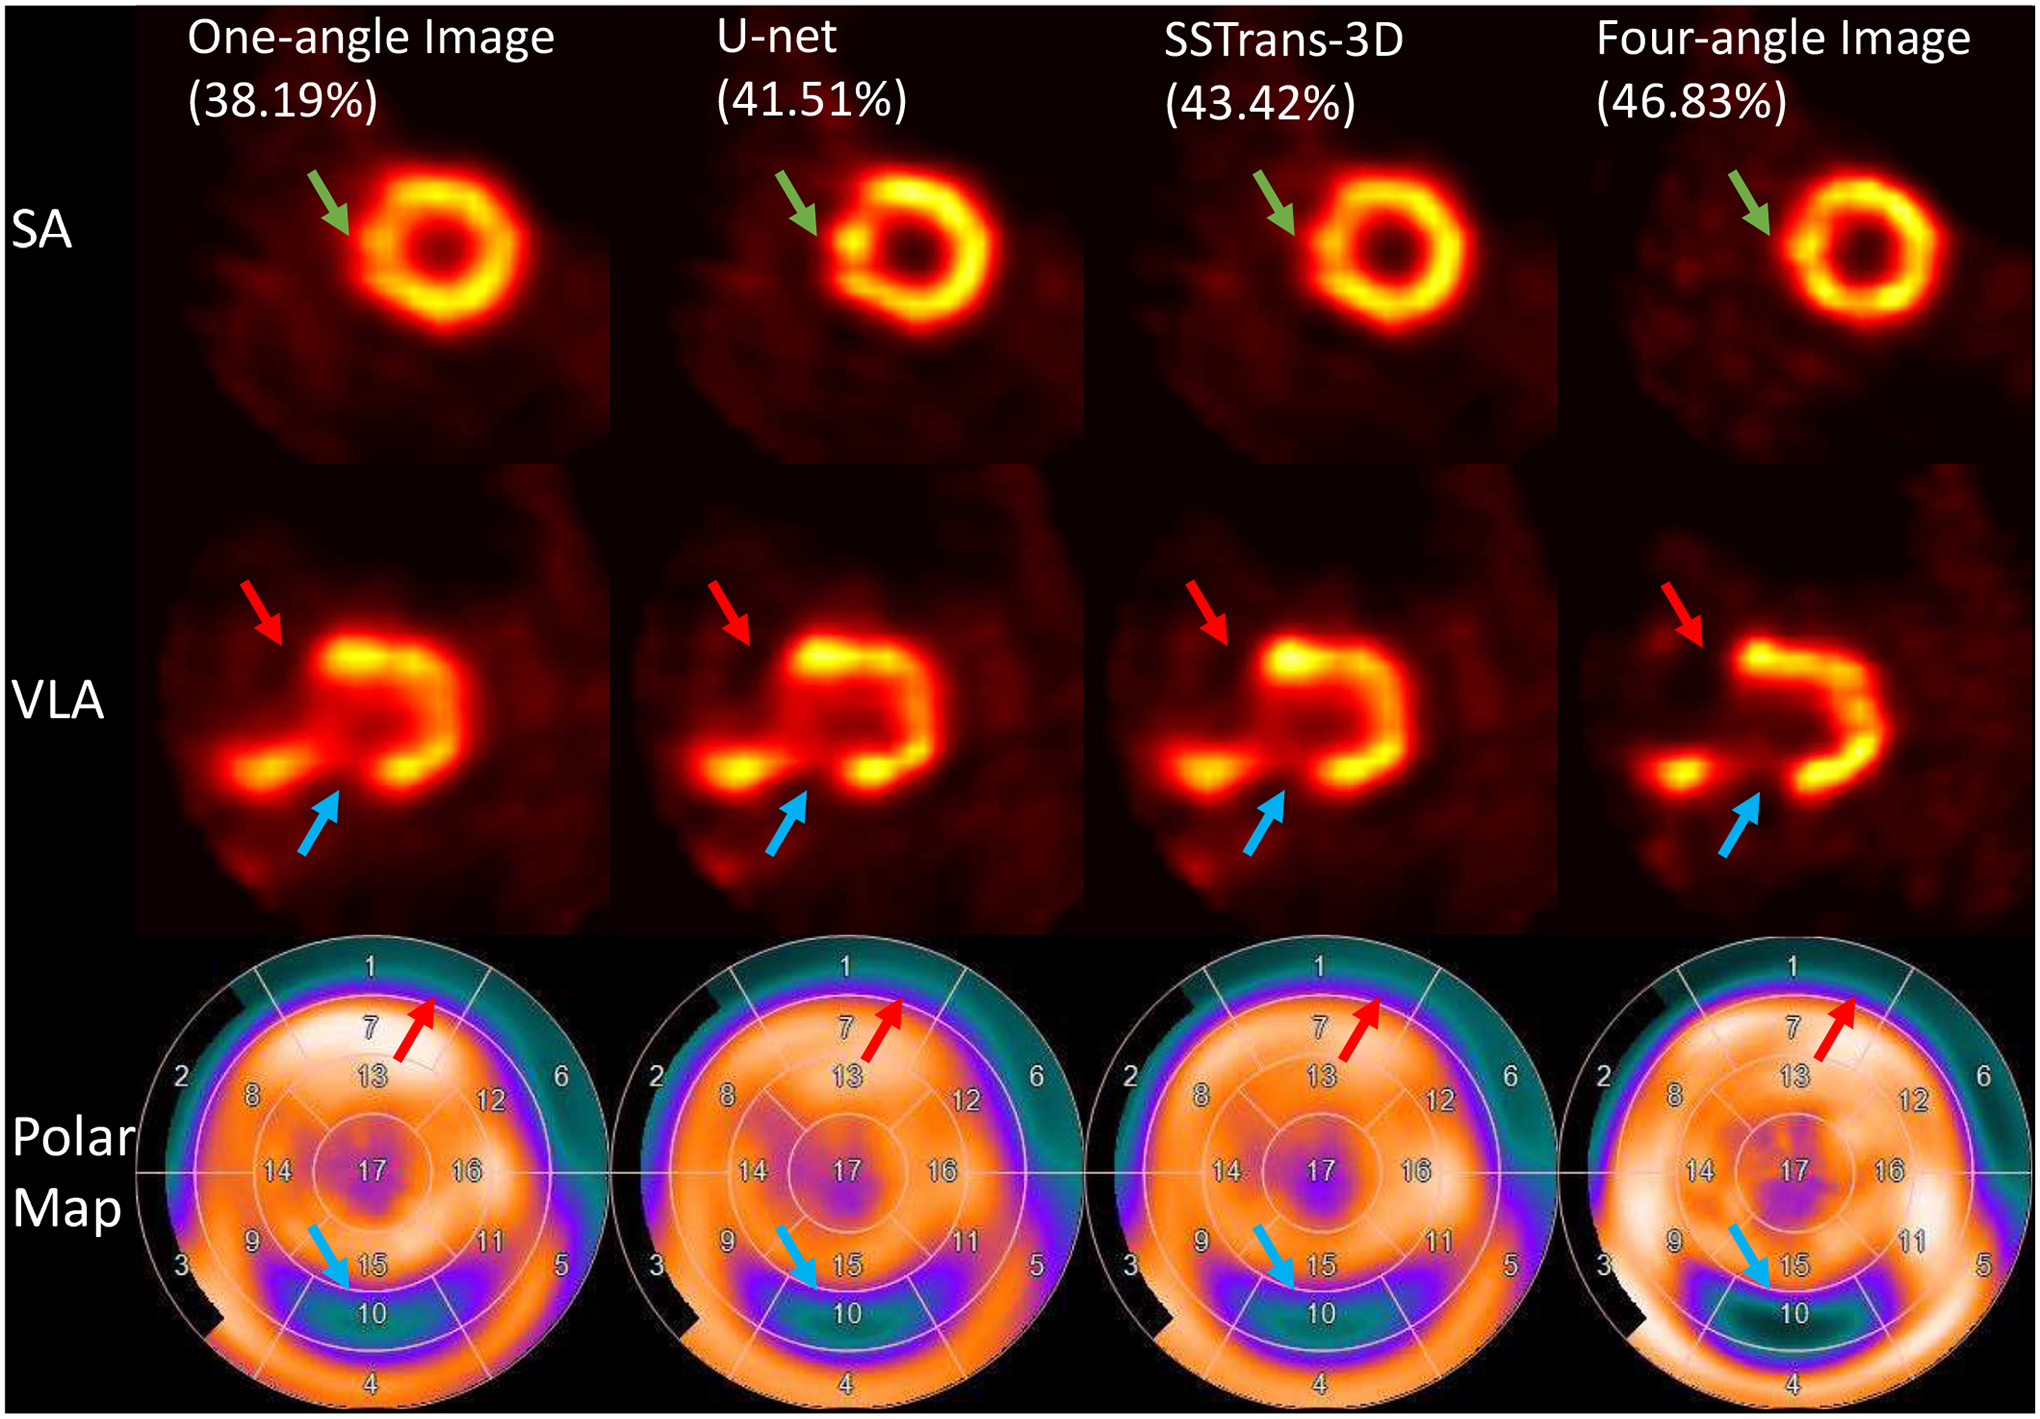
Physical phantom scan with defects reconstructed with different methods. Red and blue arrows point to the two defects added in this phantom scan. Green arrows point to some undesirable artifacts in the U-net image. Numbers in parentheses are the calculated defect sizes. The corresponding polar maps are presented in the last row.
B. porcine Results
A representative porcine study was selected and presented in Fig. 5. This pig had a large perfusion defect identified by the green arrows in the anterior septal wall corresponding to the perfusion territory of the left anterior descending artery that was injected with 99mTc-tetrofosmin during a 90 minutes coronary occlusion. U-net, SSTrans-3D, and four-angle results had improved image quality and better defect contrast. Also, as identified in the polar maps, the defect is deeper in SSTrans-3D than the U-net result.
Fig. 5.
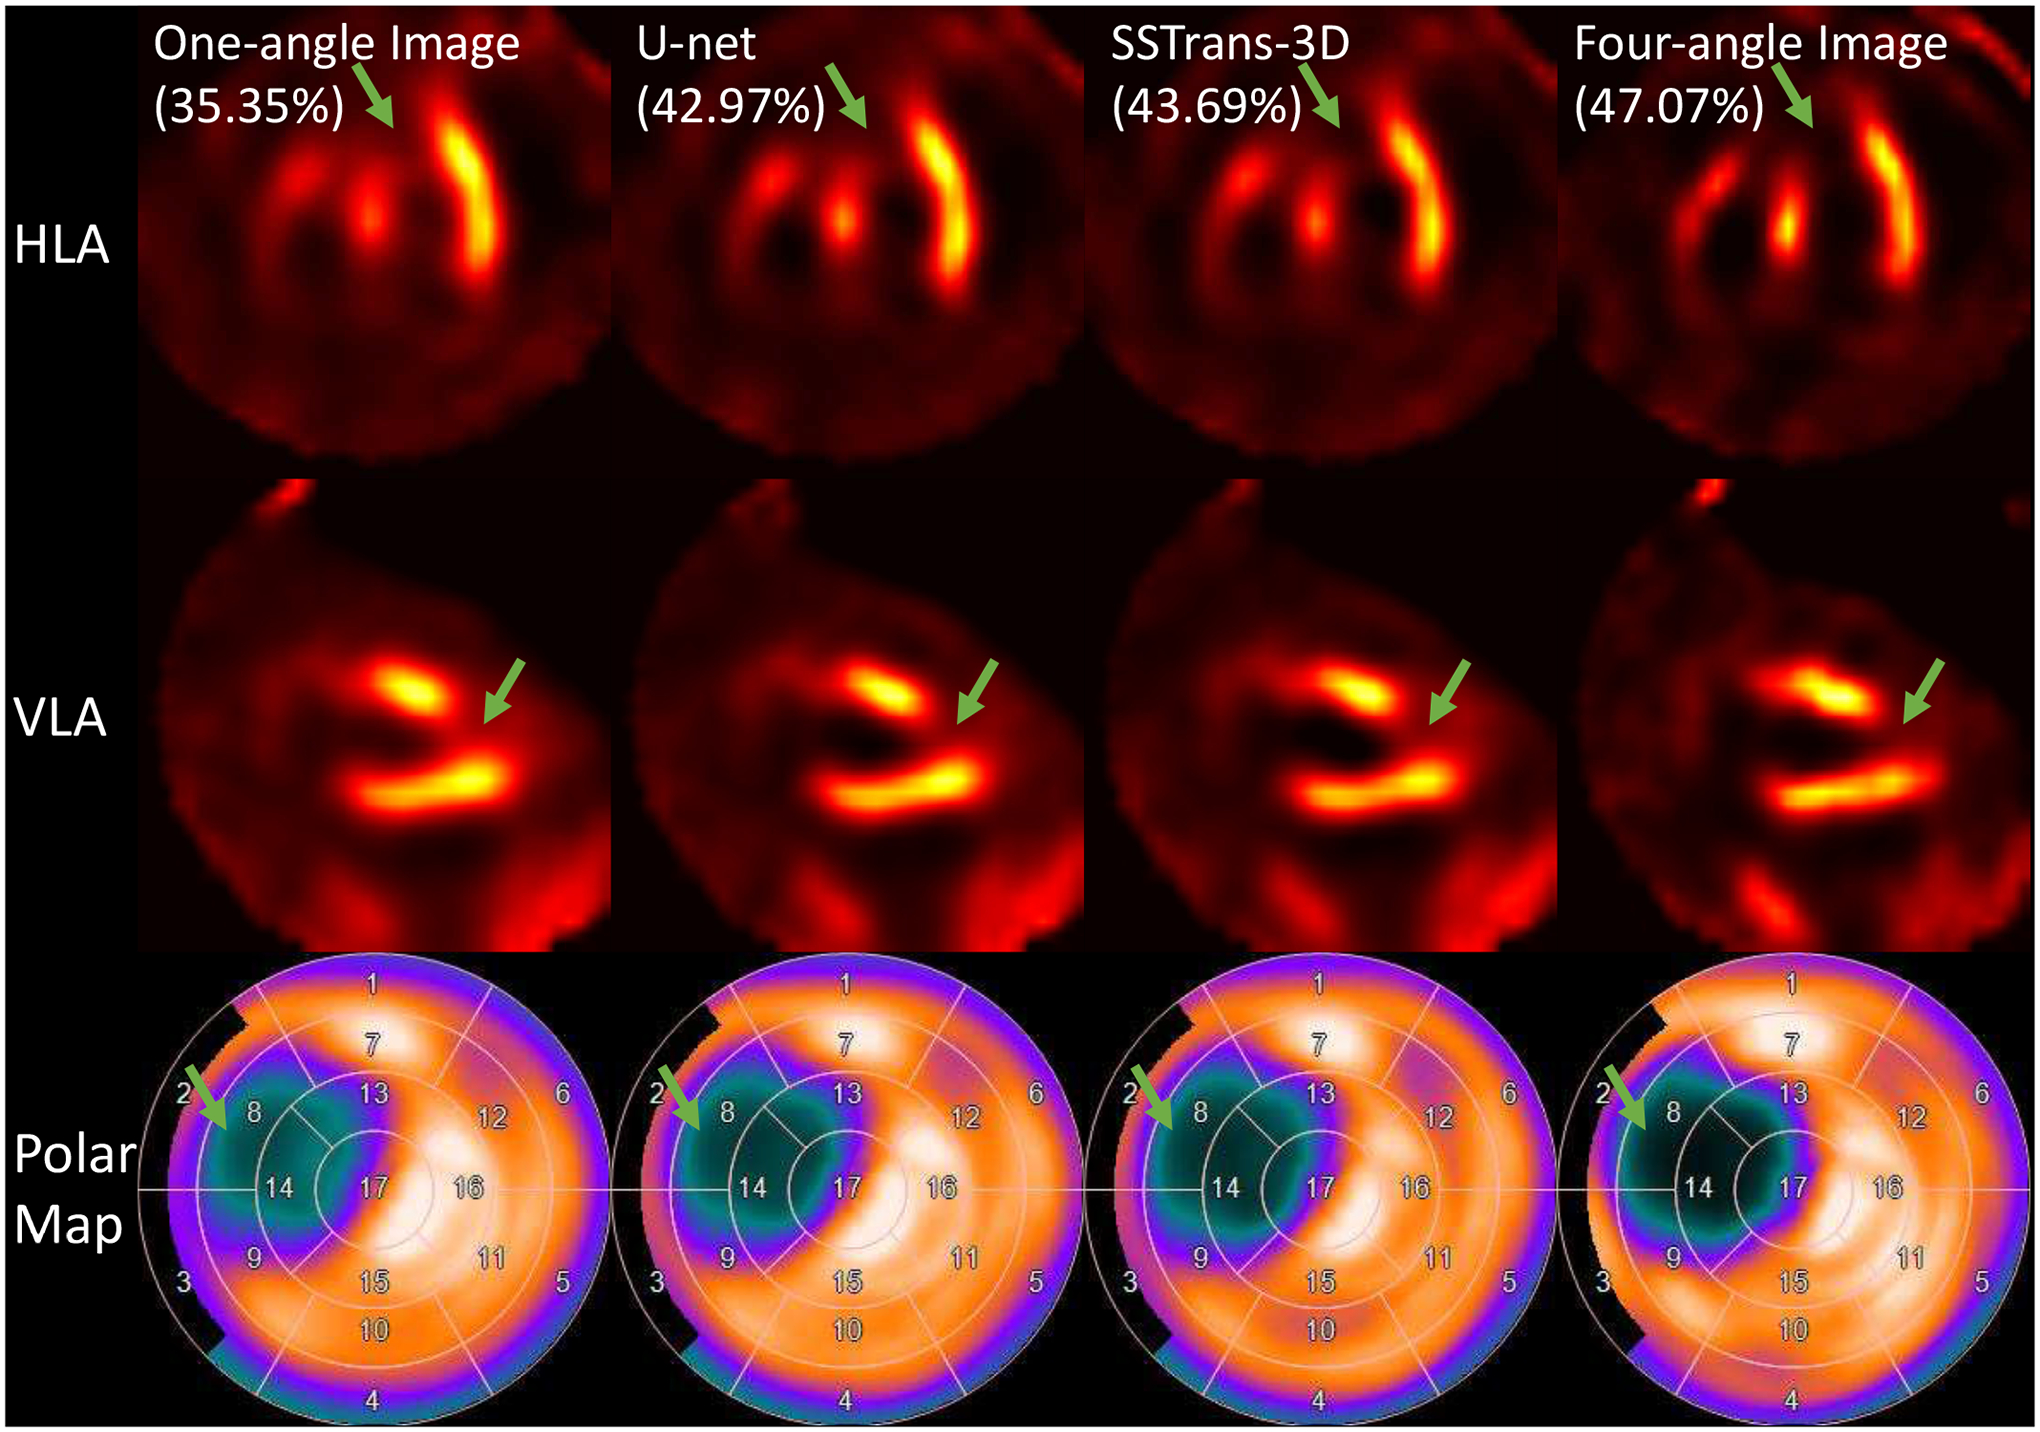
A porcine study reconstructed with different methods. Green arrows point to the defect in this porcine study. Numbers in parentheses are the calculated defect sizes. The corresponding polar maps are presented in the last row.
C. Human Results
Three representative human studies were selected and presented in Fig. 6 – 8. Cardiac defect information and diagnostic results were provided by professional radiologists at the Yale New Haven Hospital. As shown in Fig. 6, clinical diagnostic results showed that this patient had a small-size defect in the apical region, which can be clearly seen in the polar maps. Compared with U-net, SSTrans-3D produced images with a denser defect in the apical region. As identified by the green arrows in the HLA slice, the apical defect is clearly presented in images reconstructed by SSTrans-3D, but not in images reconstructed by one-angle data and U-net. SSTrans-3D also produced images with clearer contours of the right ventricle for this patient (blue arrows in Fig. 6).
Fig. 6.
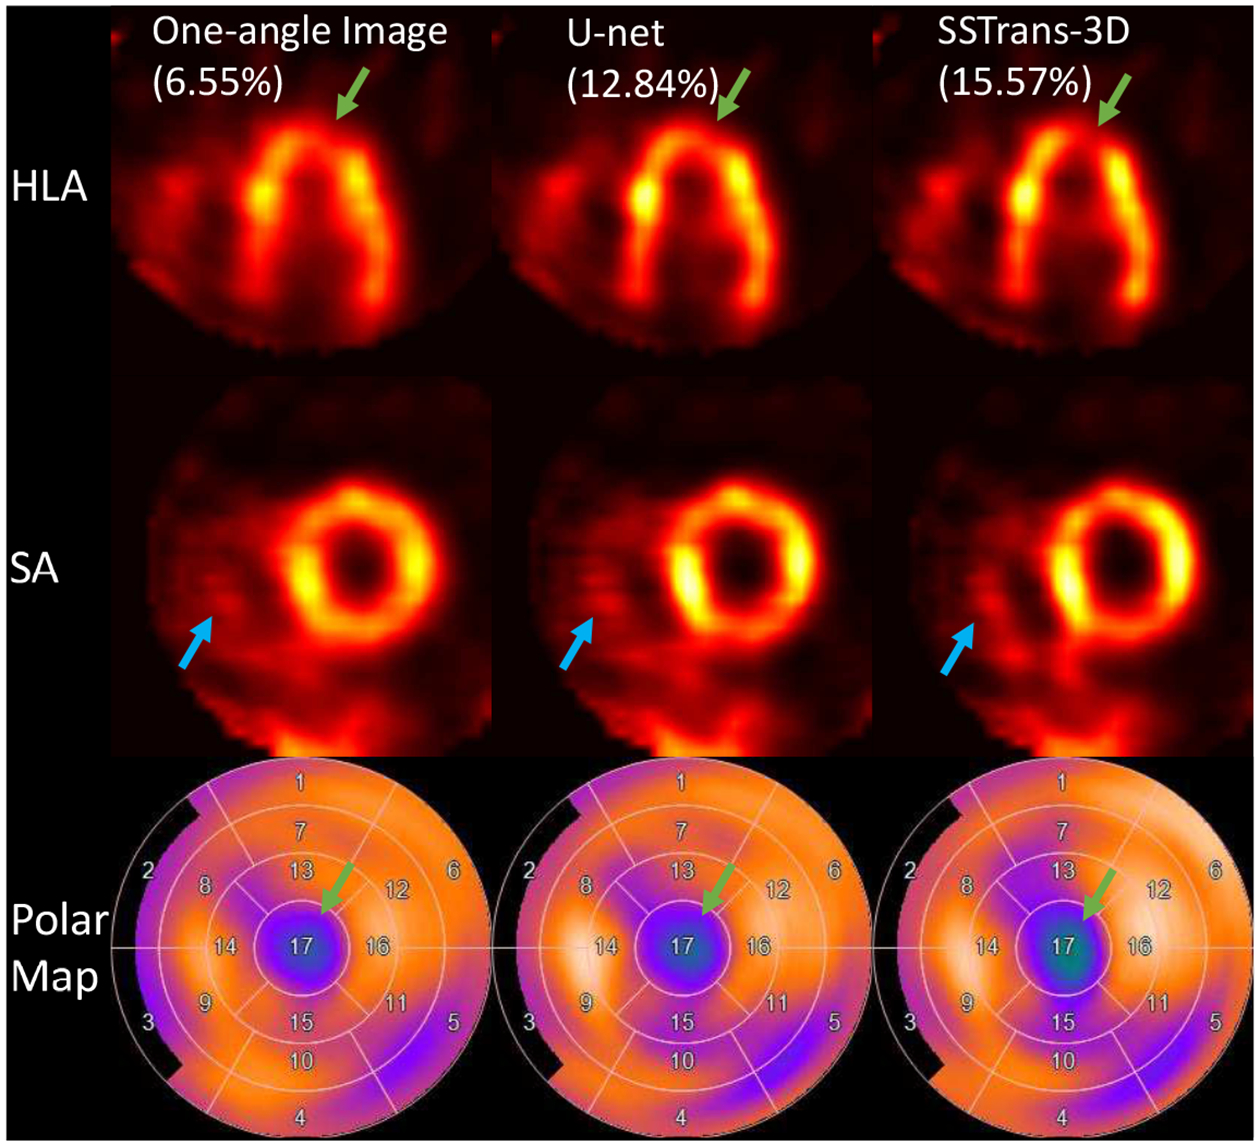
A human study reconstructed with different methods. Green arrows point to the defect in this human study. Blue arrows point to the contour of the right ventricle that was better reconstructed by SSTrans-3D. Numbers in parentheses are the calculated defect sizes. The corresponding polar maps are presented in the last row.
Fig. 8.

A human study reconstructed with different methods. Green, blue, and red arrows point to the different defects in this human study. Numbers in parentheses are the calculated defect sizes. The corresponding polar maps are presented in the last row.
For the patient presented in Fig. 7, clinical diagnostic results showed that this patient had a medium-size defect in the apical region. In this scan, both U-net and SSTrans-3D produced images with a denser defect (green arrows in Fig. 7). Also, SSTrans-3D produced images with a clearer blood pool region, especially in the second VLA slice.
Fig. 7.
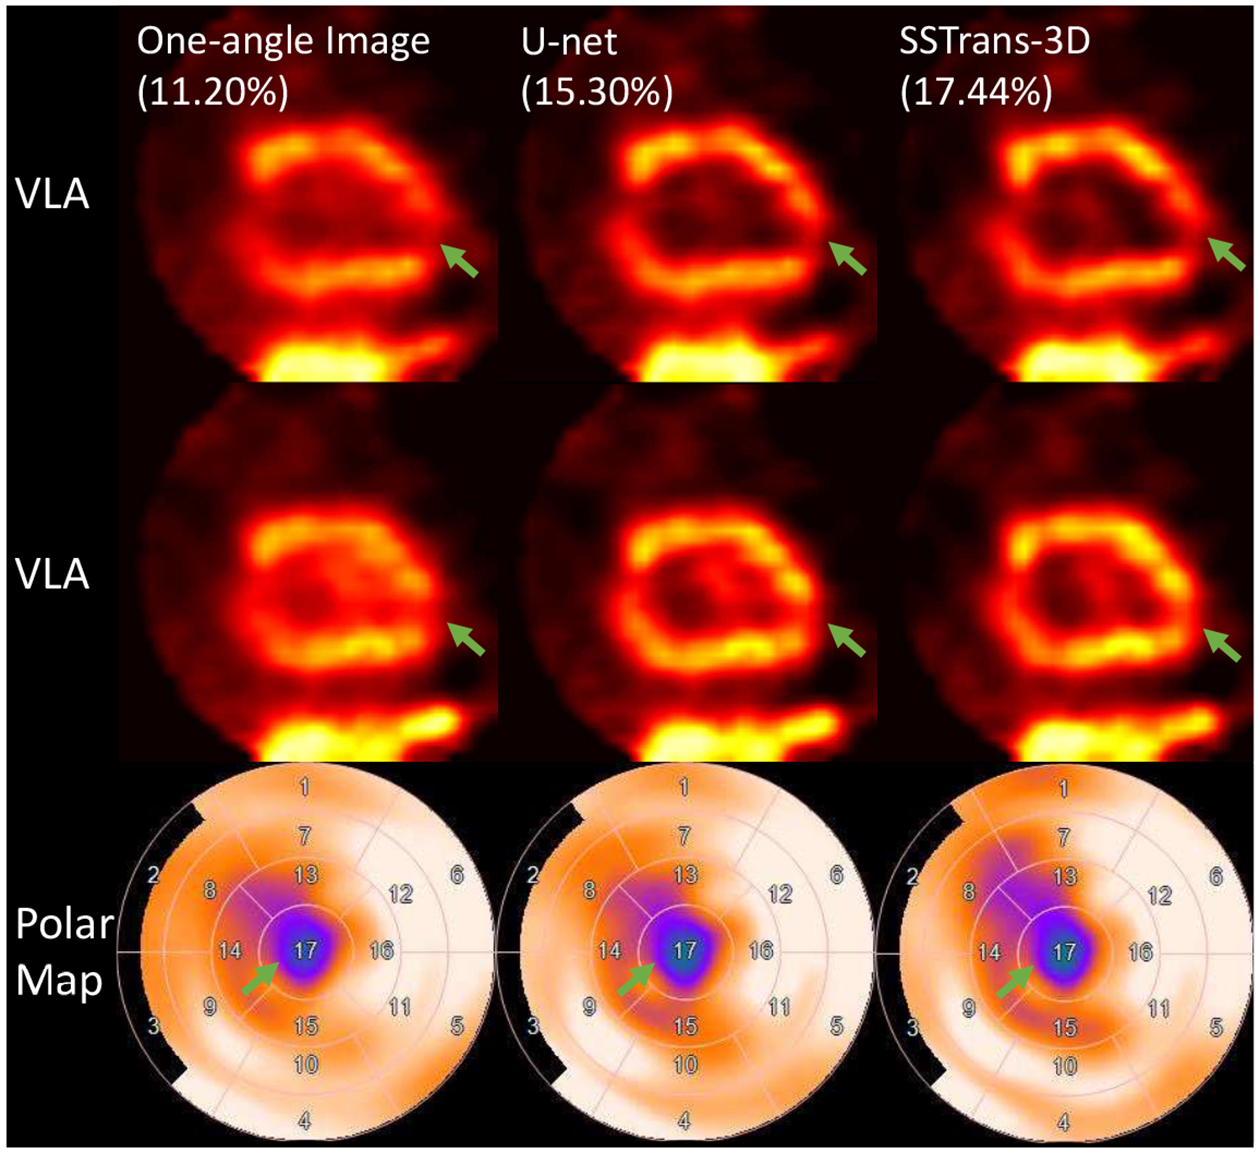
A human study reconstructed with different methods. Green arrows point to the defect in this human study. Numbers in parentheses are the calculated defect sizes. The corresponding polar maps are presented in the last row. Arrows with the same color point to the same defect.
The patient study presented in Fig. 8 had multiple perfusion defects in the basal (red and blue arrows) and apical to mid-left ventricular (green arrows) regions. Both U-net and SSTrans-3D produced images with overall better image quality and enhanced defect contrast. In the basal SA slice, the defect pointed by the red arrows is deeper and larger in the images reconstructed by SSTrans-3D. In the apical SA slice, the defect pointed by the green arrows is deeper and larger in the images reconstructed by U-net. Both U-net and SSTrans-3D produced images with similar defect contrast for the defects pointed by the blue arrows. SSTrans-3D produced images with an overall larger defect size than U-net did.
D. Quantitative Results
Quantitative results (SSIM, PSNR, and RMSE) for images reconstructed using one-angle data, U-net, and SSTrans-3D are presented in Table I. Note that because there is no multi-angle data for human studies, only porcine and physical phantoms scans were included in this quantitative analysis. Based on paired t-tests of the quantitative results, U-net and one-angle results are statistically significant different. SSTrans-3D and one-angle results are also statistically significant different. However, there is no statistically significant difference between U-net and SSTrans-3D results.
TABLE I.
Quantitative assessment for porcine and physical phantom images reconstructed with different methods (MEAN ± STD). The measurements were obtained by averaging the values on the testing dataset. Best values are marked in bold.
| One-angle Image | U-net | SSTrans-3D | |
|---|---|---|---|
| PSNR | 33.582 ± 3.822 | 34.429 ± 3.521 | 34.444 ± 3.549 |
| SSIM | 0.934 ± 0.019 | 0.938 ± 0.018 | 0.939 ± 0.019 |
| RMSE | 0.023 ± 0.009 | 0.021 ± 0.008 | 0.021 ± 0.008 |
Box plots presented in Fig. 9 summarize the measured defect sizes for all the porcine, physical phantom, and human studies used in this work. For porcine and physical phantom studies, compared with one-angle results, both SSTrans-3D and U-net demonstrated smaller measured defect sizes for studies without defects (p < 0.05), and larger measured defect sizes for studies with known defects (p < 0.05), which are consistent with our expectations. Compared with U-net results, SSTrans-3D produced images with smaller measured defect sizes for normal porcine and physical phantom studies (p < 0.05). For the abnormal subjects, neither network produced images with statistically different measurements compared with four-angle results, which may due to the limited amount of data used for statistical testing (p = 0.11 for SSTrans-3D and p = 0.14 for U-net). For the normal subjects, both networks produced images with larger measured defect sizes compared with four-angle results (p < 0.05), which served as the training labels.
Fig. 9.
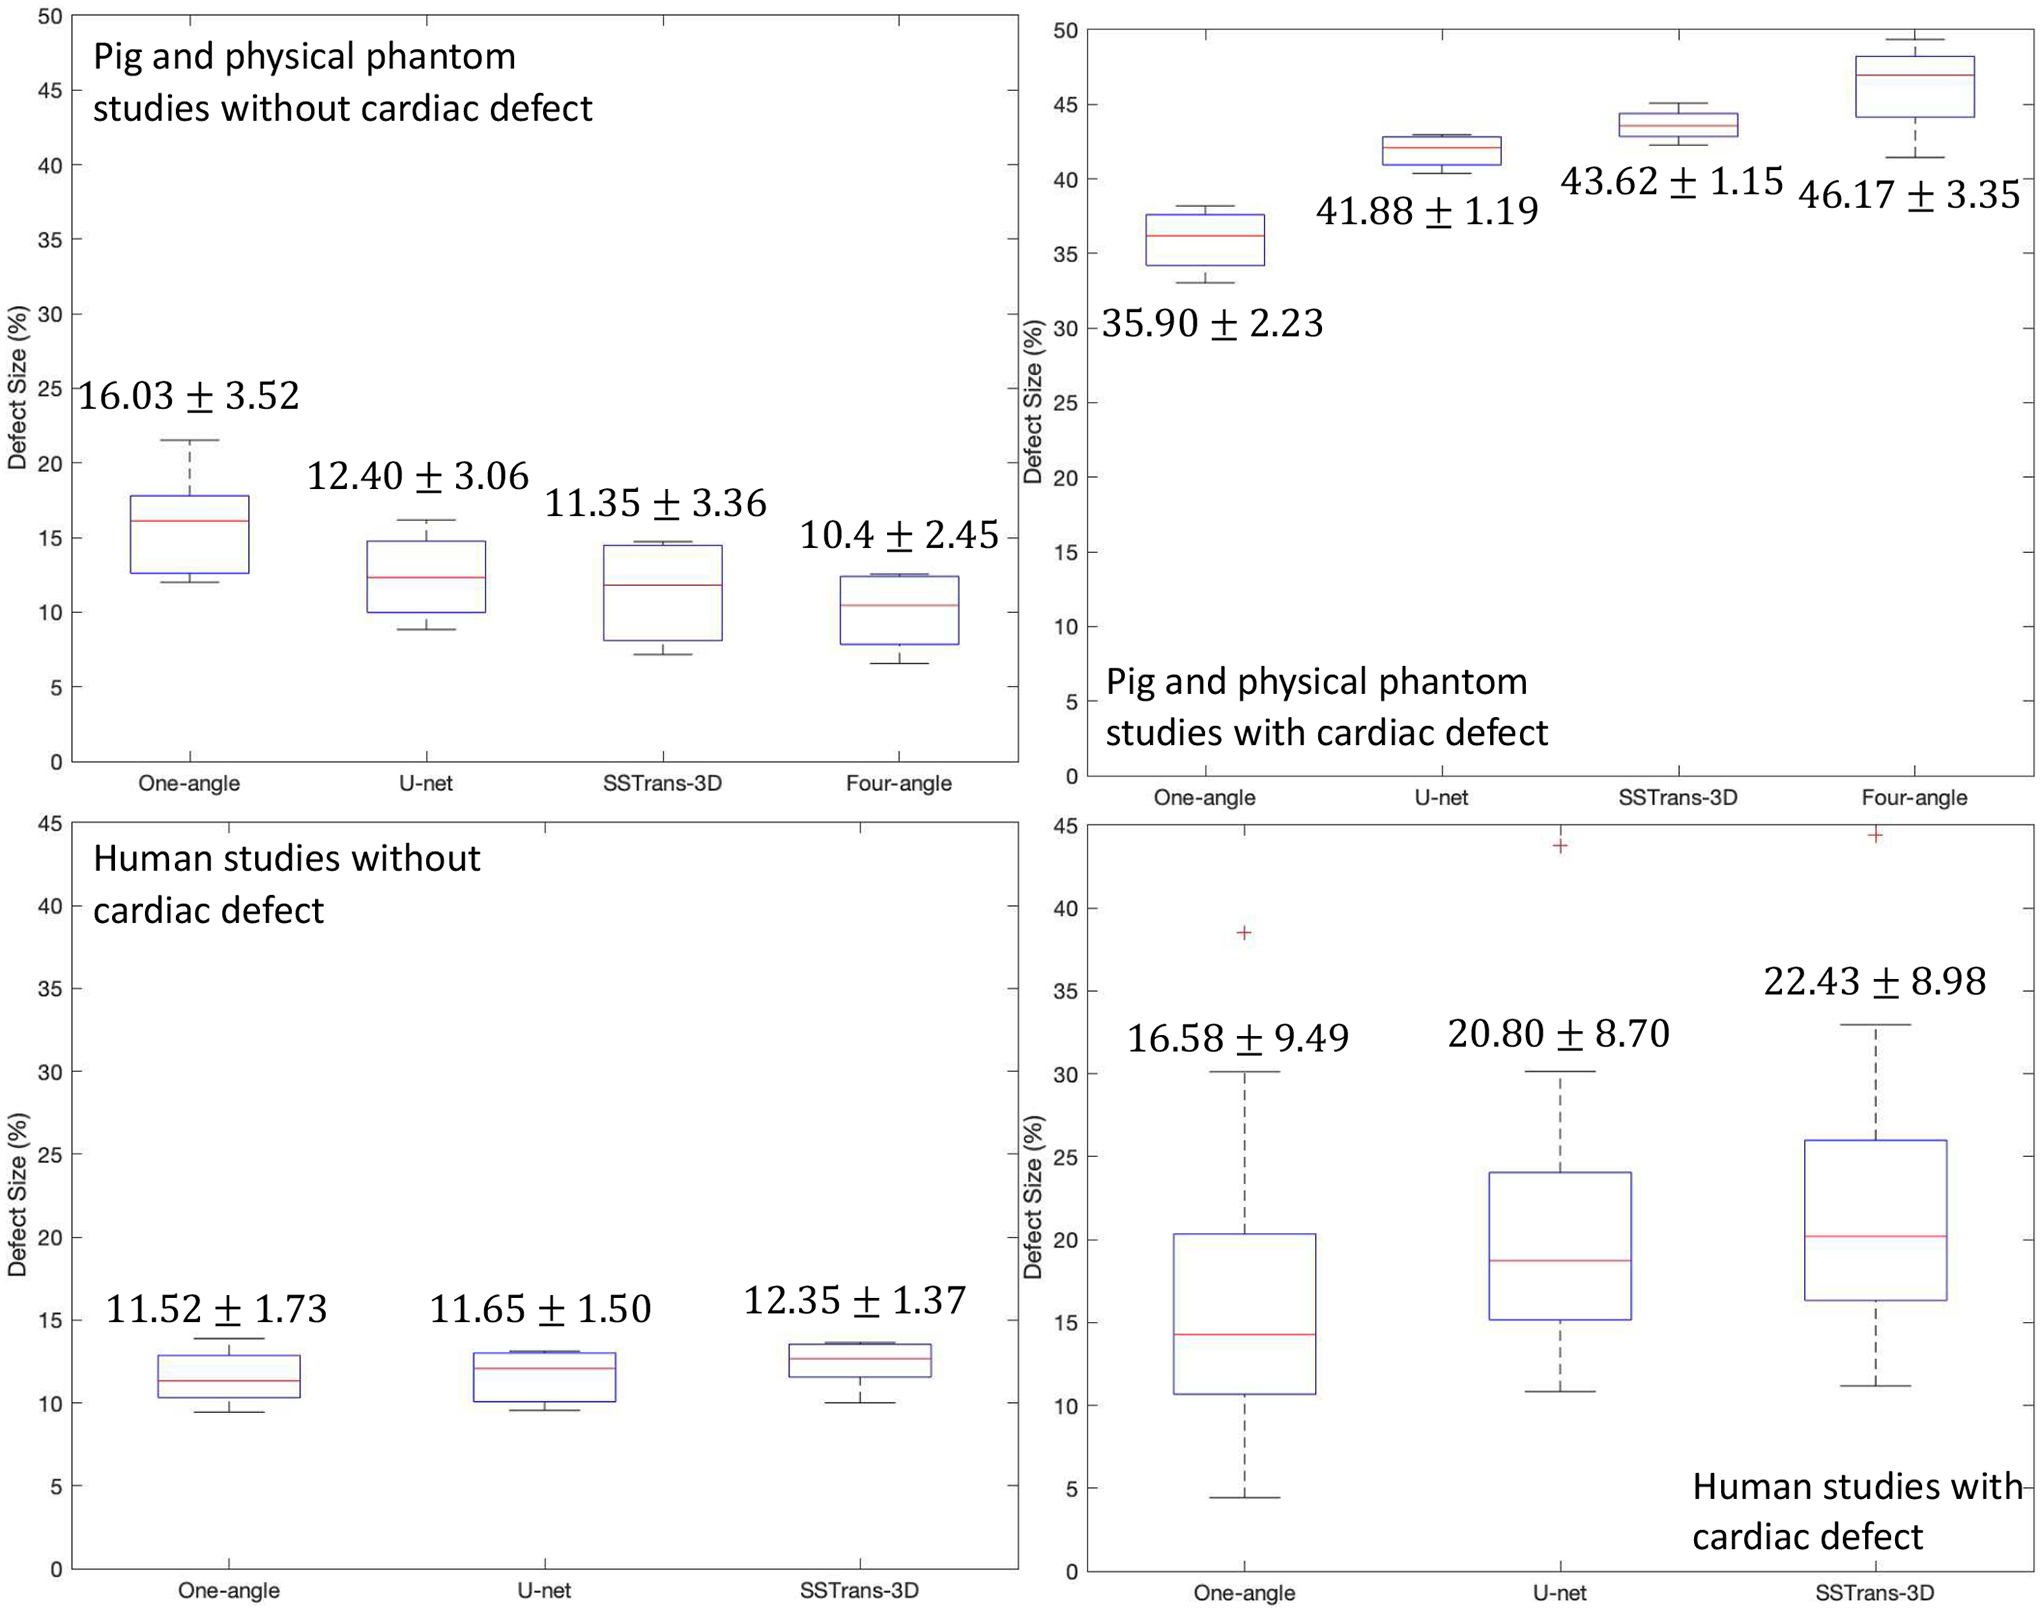
Box plots that summarize the calculated defect sizes for porcine, physical phantom, and human studies used in this work. The numbers in each column were obtained by averaging the values in each category (MEAN ± STD).
For human studies, U-net and SSTrans-3D produced images with increased measured defect sizes for normal patients, which is contrary to our expectations. However, as discussed in the original publication of the WLCQ software [20], such a small difference (less than 1% for both U-net and SSTrans-3D) may not affect clinical decisions. For the human studies with known perfusion defects, both U-net and SSTrans-3D tend to improve defect contrast and increase the measured defect sizes. Across all the human studies with cardiac defects, SSTrans-3D results had larger measured defect sizes than those of both one-angle (p < 0.001) and U-net results (p < 0.001).
For porcine and physical phantom studies, the mean myocardium to blood-pool ratios for one-angle, U-net, SSTrans-3D, and four-angle images are 4.44, 10.51, 12.03, and 19.37, respectively. The ratios derived from SSTrans-3D are higher than those of U-net ratios (p < 0.05). For human studies, the ratios for one-angle, U-net, and SSTrans-3D are 3.69, 6.09, and 6.28 respectively. SSTrans-3D also produced images with higher ratios than U-net did (p < 0.001).
IV. Discussion and Conclusion
In this work, we proposed a novel slice-by-slice Transformer network (SSTrans-3D) for mapping 3D one-angle cardiac SPECT images to four-angle counterparts. Both deep learning and multi-angle results demonstrated significantly better quality than the one-angle scans.
The proposed SSTrans-3D is adapted from the original Transformer and the vision Transformer networks. Because it is computationally difficult to reconstruct 3D image volumes using Transformer directly, 3D image volumes were reconstructed in a slice-by-slice looping manner to alleviate the memory burden in SSTrans-3D. Note that SSTrans-3D is still a fully 3D network and can obtain 3D contextual information for image reconstructions. During the looping process, the already-reconstructed slices were used as the input to the decoder part of SSTrans-3D, so that the network could obtain information from both one-angle slices and the already-reconstructed slices. By doing so, SSTrans-3D may obtain more informative image features for reconstructions. Compared with a U-net proposed in our previous work, SSTrans-3D produced images with perceivable improvement although not statistically significant quantitative differences in terms of whole image quality metrics (PSNR, SSIM, and RMSE). But we found that our proposed SSTrans-3D produced images with statistically better defect quantification based on the defect sizes calculated using the WLCQ software, especially in human studies. Because whole image quality metrics were calculated based on entire image volumes, and the scanner used in this work is a dedicated cardiac scanner with small FOV, we believe that the defect size measured by WLCQ is a more clinically-relevant image metric in this work as it only focuses on the cardiac region. Future studies with larger numbers of clinical cases are needed for more comprehensive evaluations of this approach. Also, we believe the SSTrans-3D can be directly adapted for more widely used general-purpose SPECT scanners and other dedicated SPECT scanners as the proposed method is purely image-based and it does not incorporate the scanner geometry into the network.
Because Transformer networks process images as 1D visual tokens, they have weaker spatial inductive bias than convolutional models. Thus, they typically require more data to achieve optimal training [8]. Convolutional models process images as multi-dimensional matrices, assuming a certain type of spatial structure present in the data. Limited volumes of fine-tuning data may negatively affect the performance of SSTrans-3D. In the future, we plan to further explore the possibility of Transformer in various medical imaging tasks and acquire more multi-angle data in clinical settings. Since earlier studies using projection-domain methods with CNN achieved great success, we anticipate that applying Transformer in the projection domain may offer a possible advantage and additional direction of study in the future. [21]–[23].
Acknowledgments
This work was supported by the NIH grants R01HL154345 and S10RR025555.
All authors declare that they have no known conflicts of interest in terms of competing financial interests or personal relationships that could have an influence or are relevant to the work reported in this paper.
Footnotes
This work involved human subjects or animals in its research. The use of animal and human data in this study was approved by the Institutional Animal Care & Use Committee (IACUC) and Institutional Review Board (IRB) of Yale University, respectively.
Contributor Information
Huidong Xie, Department of Biomedical Engineering..
Stephanie Thorn, Department of Internal Medicine (Cardiology) at Yale University.
Yi-Hwa Liu, Department of Internal Medicine (Cardiology) at Yale University.
Supum Lee, Department of Internal Medicine (Cardiology) at Yale University.
Zhao Liu, Department of Radiology and Biomedical Imaging at Yale University..
Ge Wang, Department of Biomedical Engineering at Rensselaer Polytechnic Institute..
Albert J. Sinusas, Department of Biomedical Engineering. Department of Internal Medicine (Cardiology) at Yale University Department of Radiology and Biomedical Imaging at Yale University..
Chi Liu, Department of Biomedical Engineering.; Department of Radiology and Biomedical Imaging at Yale University.
References
- [1].“Cardiovascular diseases (CVDs).” https://www.who.int/news-room/fact-sheets/detail/cardiovascular-diseases-(cvds). Online; accessed 16 Nov 2021.
- [2].Wu J and Liu C, “Recent advances in cardiac SPECT instrumentation and imaging methods,” Phys. Med. Biol, vol. 64, p. 06TR01, Mar. 2019. [DOI] [PubMed] [Google Scholar]
- [3].Bocher M, Blevis I, Tsukerman L, Shrem Y, Kovalski G, and Volokh L, “A fast cardiac gamma camera with dynamic SPECT capabilities: design, system validation and future potential,” Eur J Nucl Med Mol Imaging, vol. 37, pp. 1887–1902, Oct. 2010. [DOI] [PMC free article] [PubMed] [Google Scholar]
- [4].Xie H, Thorn S, Liu H, Liu Z, Chen X, Lee S, Wang G, Sinusas A, and Liu C, “Increasing angular sampling through deep learning for GE Alcyone dedicated cardiac SPECT,” Journal of Nuclear Medicine, vol. 62, pp. 1541–1541, May 2021. [Google Scholar]
- [5].Shan H, Zhang Y, Yang Q, Kruger U, Kalra MK, Sun L, Cong W, and Wang G, “3D Convolutional Encoder-Decoder Network for Low-Dose CT via Transfer Learning from a 2D Trained Network,” arXiv:1802.05656 [cs], Feb. 2018. [DOI] [PMC free article] [PubMed] [Google Scholar]
- [6].Wang G, Ye JC, Mueller K, and Fessler JA, “Image Reconstruction is a New Frontier of Machine Learning,” IEEE Trans Med Imaging, vol. 37, no. 6, pp. 1289–1296, 2018. [DOI] [PubMed] [Google Scholar]
- [7].Xie H, Shan H, and Wang G, “Deep Encoder-Decoder Adversarial Reconstruction (DEAR) Network for 3d CT from Few-View Data,” Bioengineering, vol. 6, p. 111, Dec. 2019. [DOI] [PMC free article] [PubMed] [Google Scholar]
- [8].Bhojanapalli S, Chakrabarti A, Glasner D, Li D, Unterthiner T, and Veit A, “Understanding Robustness of Transformers for Image Classification,” Mar. 2021.
- [9].Vaswani A, Shazeer N, Parmar N, Uszkoreit J, Jones L, Gomez AN, Kaiser L. u., and Polosukhin I, “Attention is all you need,” in Advances in Neural Information Processing Systems, vol. 30, 2017. [Google Scholar]
- [10].Sherstinsky A, “Fundamentals of Recurrent Neural Network (RNN) and Long Short-Term Memory (LSTM) Network,” Aug. 2018.
- [11].Staudemeyer RC and Morris ER, “Understanding LSTM – a tutorial into Long Short-Term Memory Recurrent Neural Networks,” Sept. 2019.
- [12].Dosovitskiy A, Beyer L, Kolesnikov A, Weissenborn D, Zhai X, Unterthiner T, Dehghani M, Minderer M, Heigold G, Gelly S, Uszkoreit J, and Houlsby N, “An Image is Worth 16×16 Words: Transformers for Image Recognition at Scale,” arXiv:2010.11929 [cs], Oct. 2020. [Google Scholar]
- [13].Shepp L and Vardi Y, “Maximum Likelihood Reconstruction for Emission Tomography,” IEEE Transactions on Medical Imaging, vol. 1, pp. 113–122, Oct. 1982. [DOI] [PubMed] [Google Scholar]
- [14].Ronneberger O, Fischer P, and Brox T, “U-Net: Convolutional Networks for Biomedical Image Segmentation,” in Medical Image Computing and Computer-Assisted Intervention MICCAI 2015 (Navab N, Hornegger J, Wells WM, and Frangi AF, eds.), pp. 234–241, Springer International Publishing, 2015. [Google Scholar]
- [15].Huang G, Liu Z, van der Maaten L, and Weinberger KQ, “Densely Connected Convolutional Networks,” arXiv:1608.06993 [cs], Jan. 2018. [Google Scholar]
- [16].Wang Z, Bovik A, Sheikh H, and Simoncelli E, “Image quality assessment: from error visibility to structural similarity,” IEEE Transactions on Image Processing, vol. 13, pp. 600–612, Apr. 2004. [DOI] [PubMed] [Google Scholar]
- [17].PK D and B J, “Adam: A method for stochastic optimization,” in 3rd International Conference on Learning Representations, ICLR 2015, San Diego, CA, USA, May 7–9, 2015, Conference Track Proceedings, 2015. [Google Scholar]
- [18].Glorot X and Bengio Y, “Understanding the difficulty of training deep feedforward neural networks,” in Proceedings of the Thirteenth International Conference on Artificial Intelligence and Statistics, pp. 249–256, Mar. 2010. [Google Scholar]
- [19].Segars W, Sturgeon G, Mendonca S, Grimes J, and Tsui B, “4D XCAT phantom for multimodality imaging research,” Medical Physics, vol. 37, no. 9, pp. 4902–4915, 2010. [DOI] [PMC free article] [PubMed] [Google Scholar]
- [20].Liu Y, Sinusas A, DeMan P, Zaret B, and Wackers F, “Quantification of SPECT myocardial perfusion images: methodology and validation of the Yale-CQ method,” J Nucl Cardiol, vol. 6, pp. 190–204, Apr. 1999. [DOI] [PubMed] [Google Scholar]
- [21].He J, Wang Y, and Ma J, “Radon Inversion via Deep Learning,” IEEE Transactions on Medical Imaging, vol. 39, pp. 2076–2087, June 2020. [DOI] [PubMed] [Google Scholar]
- [22].Chen H, Zhang Y, Chen Y, Zhang J, Zhang W, Sun H, Lv Y, Liao P, Zhou J, and Wang G, “LEARN: Learned Experts Assessment-Based Reconstruction Network for Sparse-Data CT,” IEEE Transactions on Medical Imaging, vol. 37, pp. 1333–1347, June 2018. [DOI] [PMC free article] [PubMed] [Google Scholar]
- [23].Xie H, Shan H, Cong W, Liu C, Zhang X, Liu S, Ning R, and Wang G, “Deep Efficient End-to-End Reconstruction (DEER) Network for Few-View Breast CT Image Reconstruction,” IEEE Access, vol. 8, pp. 196633–196646, 2020. [DOI] [PMC free article] [PubMed] [Google Scholar]


