Abstract
The mycolic acid layer of the Mycobacterium tuberculosis cell wall is essential for viability and virulence, and the enzymes responsible for its synthesis are targets for antimycobacterial drug development. Polyketide synthase 13 (Pks13) is a module encoding several enzymatic and transport functions that carries out the condensation of two different long-chain fatty acids to produce mycolic acids. We determined structures by cryogenic electron microscopy of dimeric multi-enzyme Pks13 purified from mycobacteria under normal growth conditions, captured with native substrates. Structures define the ketosynthase (KS), linker, and acyltransferase (AT) domains at 1.8 Å resolution and two alternate locations of the N-terminal acyl carrier protein (ACP1). These structures suggest intermediate states on the pathway for substrate delivery to the ketosynthase domain. Other domains, visible at lower resolution, are flexible relative to the KS-AT core. The chemical structures of three bound endogenous long-chain fatty acid substrates were determined by electrospray ionization mass spectrometry.
Editor summary:
Polyketide synthase 13 from mycobacteria, was purified endogenously ‘in action’, with wild type substrates bound. Structures by cryoEM define multiple states of acyl carrier proteins in the final step of mycolic acid synthesis, by a key drug target.
Introduction:
Mycobacterium tuberculosis (Mtb) coevolved with humans and is currently the world’s most lethal bacterium, causing over 1.3 million deaths in 20201. In Mtb and other mycobacteria including the non-pathogenic Mycobacterium smegmatis (Ms), the outer layer of the cell envelope is a waxy, ~80 Å thick “mycomembrane”2–4 primarily comprised of 2-alkyl, 3-hydroxy long chain fatty acids termed mycolic acids. This outer layer is essential for mycobacterial viability as it is the principal permeability barrier against environmental stressors including innate immune molecules and antimycobacterial drugs. Because of their central role in mycobacterial physiology, the reactions in the mycolic acid synthesis pathway are targets for antimycobacterial drugs5. Drugs that target earlier parts of the pathway in Mtb include the front-line drug isoniazid and thioamides such as ethionamide. While most strains of Mtb are susceptible to the standard regimen antibiotics, approximately a half million people are diagnosed with multi-drug resistant TB each year6. Hence steps in the pathway of mycolic acid synthesis are pursued for new effective small molecule antimycobacterial drugs that can evade currently evolved drug resistance in Mtb.7,8.
The final steps of mycolic acid synthesis ligate two very long chain fatty acid chains together in a condensation step carried out by a multi-domain polyketide synthase 13 (Pks13)9 to form an α-alkyl β-ketoacyl thioester (Fig S1). Each Pks13 polypeptide chain begins with an acyl carrier protein toward the N-terminus (ACP1) (Fig 1A,B) that is activated by attachment of a 4’-phosphopantetheinyl prosthetic group (Ppant, 1), to S38 of the ACP1 domain. One of the substrates of Pks13 is generated from a long-chain fatty acid R1, containing aliphatic chains between 48 and 62 carbons in length. AMP ligase FadD32 activates R1 by AMPylating the substrate to produce meromycolyl-AMP, 2>10–13. This meromycolyl-AMP is the equivalent of a ‘starter unit’ in a modular PKS. The terminal thiol of the Ppant group on ACP1 displaces the AMP to form a thioester with the R1 meromycolyl chain, 3. This process also requires FadD32 in a role analogous to the loading domain in other PKSs10,12,14(Fig 1B). In the amino acid sequence of Pks13 the ACP1 domain is followed by a ketosynthase domain (KS) (Fig 1A). The meromycolyl chain attached to ACP1 trans-thioesterifies on to C267 of the KS domain in preparation for the subsequent chain extension (Fig 1B).
Fig 1. Overall architecture of the mycobacterial Pks13 showing two alternate positions of the ACP1 domain.
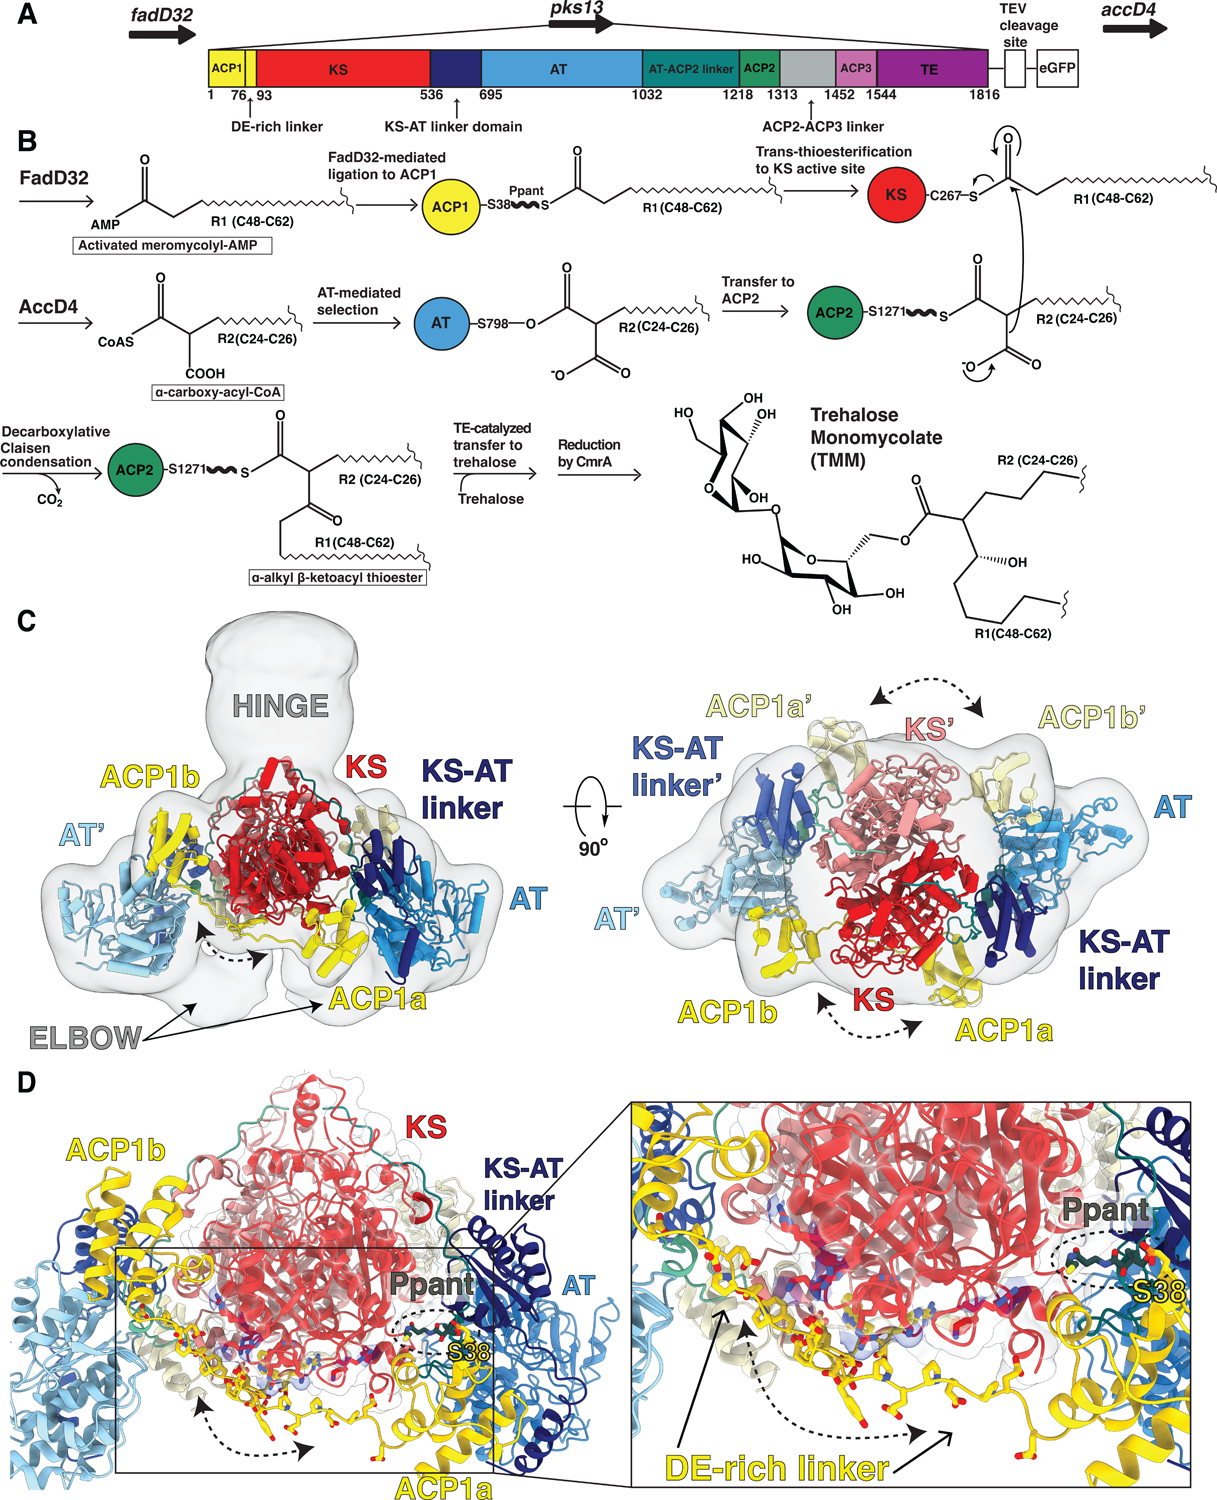
(A) Part of the Ms operon containing the fadD32 - pks13 - accD4 locus (top). Pks13 is comprised of 1816 amino acids with seven domains, and five domains of recognized function with lengths shown to scale in sequence. Colors are preserved throughout the Figures. An N-terminal acyl ACP1 (yellow) is followed by an aspartate glutamate-rich linker (DE-rich linker), KS (red), a KS-AT linker domain (navy blue), an AT (blue), AT-ACP2 linker (teal), ACP2 (green), a linker (grey), ACP3 (light purple) and TE (purple). ACP1 and ACP2 have the -DSL- motif that gets phosphopantetheinylated to receive substrate. The C-terminus of Pks13 was tagged with a TEV-cleavable eGFP. (B) Schematic of the Pks13 reaction. The meromycolyl substrate is attached to the Ppant arm (bold wave line) of the N-terminal ACP (ACP1). This is followed by trans-thioesterification to the KS. The second substrate is attached to the active site serine of AT and then transferred to ACP2 for the decarboxylative Claisen condensation. The α-alkyl β-ketoacyl thioester product is released from ACP2 by the TE that ligates it to trehalose. CmrA reduces the product to yield trehalose monomycolate (TMM). (C) A composite structure of the Pks13 homodimer showing the relative positions of ACP1a and ACP1b fitted into a composite cryo-EM map constructed from the focused reconstructions. The two protomers are distinguished from each other by darker shades of domain colors for one protomer, and lighter shades of the same color for the other. Domains in the lighter-colored protomer are labeled with the prime (‘) designation. The left ELBOW region connects the lighter colored KS and KS-AT linker domains. The right ELBOW connects the darker colored domains. The ELBOW and HINGE regions’ resolutions (~20 Å) indicate flexibility. (D) The two positions of ACP1 (ACP1a and ACP1b) are followed by acidic residues in the DE-rich linker (yellow) that lie near basic residues on the KS (highlighted blue). Ppant attached to S38 is visible in ACP1a and labeled.
The second substrate is derived from a long-chain fatty acid R2 containing aliphatic chains between 24 and 26 carbons in length. R2 is first esterified by coenzyme A (CoA) and carboxylated by an acyl-CoA-carboxylase AccD4, to yield an α-carboxy-acyl-CoA, 4 (Fig 1B). This product is analogous to the ‘extender unit’ of modular PKSs. It is notable that the genes that encode FadD32 and AccD4 flank the gene for Pks13 (Fig 1A).
A 159 amino acid linker domain follows KS in the Pks13 chain and leads into the acyl transferase domain (AT). Serine S798 of the AT domain displaces CoA to form a serine ester with the carboxyl of R2, 5. The AT is followed by a 186-residue AT-ACP2 linker to a second Ppant-activated ACP (ACP2). R2 is captured by the sulfhydryl of the Ppant prosthetic group on ACP2 for transport to the KS active center where it undergoes a decarboxylative Claisen condensation with the R1 meromycolyl chain. The condensed product results in a mycolic α−alkyl β-ketoacyl thioester, 6 attached to the Ppant arm of ACP2. This intermediate is transferred from ACP2 to a thioesterase (TE) domain at the C-terminus of Pks13, which ligates the condensed product to trehalose, 7. Subsequently the reductase CmrA reduces the ketone on the ligated intermediate to generate a mature trehalose mono mycolic acid (TMM, 8) (Fig 1B) (Fig S1A)16. A third ACP-like domain (ACP3) is also encoded in the Pks13 sequence though it does not contain the active site serine necessary for attachment of the Ppant prosthetic group. As ACP3 thus cannot perform the carrier function, its function in Pks13 remains unknown (Fig 1A).
Though Pks13 is essential for Mtb there are no drugs yet that target individual enzymatic domains of Pks13. Furthermore, the general mechanism for how long-chain substrates are chaperoned and moved between domains has so far not been accessible for antimycobacterial target strategies15. We therefore sought to define the mechanism by which Pks13 processes these large hydrophobic substrates by determining the structure of the endogenous Pks13 purified from its in vivo state, with native long-chain substrates bound, rather than purified by overexpression in an exogenous host. This approach allowed us to visualize the multi domain enzyme in action and to uncover new functional sites in the substrate pathway that are unique to mycolic acid producing bacteria.
Results:
Pks13 from native mycobacterial membranes is a stable dimer
Ms Pks13 shares 71% amino acid sequence identity with that of Mtb, carries out the same enzymatic reaction, and so is a model for Pks13 in the human pathogen Mtb9. The pks13 locus was tagged at the C-terminal end of the endogenous gene in Ms16 so as not to impair endogenous expression or function, with a TEV-cleavable Green Fluorescent Protein ‘GFP’ (Fig 1A). The GFP fusion was used to enable native purification using anti-GFP nanobody beads.
Detergent was required for solubilization and purification, consistent with Pks13 being attached to the mycobacterial plasma membrane, as suggested based on live cell imaging16. Various detergents were evaluated for optimal solubilization of Pks13 using fluorescence size exclusion chromatography (see methods), and N-dodecyl-β-D-maltoside (β-DDM, 9) was selected based on efficiency of solubilization. Following affinity purification using anti-GFP nanobody beads and on-bead cleavage by TEV, Pks13 was run through a sizing column, which gave two peaks (Extended Fig 1A). The protein in each peak was comprised of Pks13 as seen on SDS-PAGE, and was predominantly dimeric Pks13 as shown by ‘blue native’-PAGE (Extended Fig 1B,C). Therefore, the higher molecular weight peak1 resolved in SEC is a larger multimer that readily dissociates into a dimer. Liquid chromatography with tandem mass spectrometry (LC-MS-MS) confirmed the protein identity with 78.1% sequence coverage throughout the entire Pks13 (Extended Fig 1D).
Cryogenic electron microscopy (cryoEM) was used to collect images of particles from the peak1 fraction, which behaved better when frozen on grids compared to particles from peak 2 (Table 1). We added a benzofuran inhibitor of the terminal thioesterase (TE) domain17 ‘TAM16’ to part of the material, with the aim of stalling the throughput of the overall reaction, and producing a more homogeneous stable structure. Samples with and without this inhibitor produced the same structures with marginally better resolution for the sample with inhibitor. Material from the peak 1 fraction, when imaged by cryoEM, revealed multiple conformational states of the protein. Image classification and refinement revealed a well-resolved, two-fold symmetric core comprising the KS, AT, and parts of KS-AT linker domains (Fig 2A, 3A Table 1). Symmetry expansion and focused classifications were used to resolve the regions N-terminal to the KS-AT didomain core, including the two alternate ACP1 domain structures (Fig 2B, 3A,C,Table 1). There are also two lobes of density we term the ELBOW that connect the C-terminal end of the KS domain (E529) and the beginning of a well-resolved KS-AT linker domain (T588) (Fig 1C). There is additional density above the KS dimer, which we term the HINGE region (Fig 1C), indicating flexibility and dynamic motion of regions C-terminal to the AT domain.
Table 1:
Cryo-EM data collection, refinement, and validation statistics
| KS-AT consensus refinement EMD-26574 PDB 7UK4 | ACP1a-KS-AT EMD-27002 PDB 8CUY | ACP1b-KS-AT EMD-27005 PDB 8CV1 | KS-ATin EMD-27003 PDB 8CUZ | KS-ATout EMD-27004 PDB 8CV0 | |
|---|---|---|---|---|---|
| Data collection and processing | |||||
| Magnification | |||||
| Voltage (kV) | 300 | 300 | 300 | 300 | 300 |
| Electron exposure (e–/Å2) | 67 | 67 | 67 | 67 | 67 |
| Defocus range (μm) | 0.7 −1.5 | 0.7 −1.5 | 0.7 −1.5 | 0.7 −1.5 | 0.7 −1.5 |
| Pixel size (Å) | 0.4175 | 0.4175 | 0.4175 | 0.4175 | 0.4175 |
| Symmetry imposed | C2 | C1 | C1 | C1 | C1 |
| Initial particle images (no.) | 4,400,000 | 1,200,000 | 1,200,000 | 1,200,000 | 1,200,000 |
| Final particle images (no.) | 1,200,000 | 146,928 | 39,685 | 123,116 | 92,662 |
| Map resolution (Å) | 1.94 | 2.4 | 2.6 | 3.0 | 3.1 |
| FSC threshold | 0.143 | 0.143 | 0.143 | 0.143 | 0.143 |
| Map resolution range (Å) | 1.9–3.7 | 2.4–4.2 | 2.7–4.3 | 2.5–4.2 | 2.6–4.5 |
| Refinement | |||||
| Initial model used (PDB code) | De novo | 7UK4 | 7UK4 | 7UK4 | 7UK4 |
| Model resolution (Å) | 2.0 | 2.7 | 2.7 | 2.8 | 2.9 |
| FSC threshold | 0.5 | 0.5 | 0.5 | 0.5 | 0.5 |
| Map sharpening B factor (Å2) | - | 48.65 | 9.79 | - | - |
| Model composition | |||||
| Non-hydrogen atoms | 14487 | 14917 | 14771 | 14084 | 14084 |
| Protein residues | |||||
| Ligands | 1856 | 1944 | 1939 | 1850 | 1850 |
| 2 | 5 | 2 | 2 | 2 | |
| B factors (Å2) | |||||
| Protein | 45.1 | 109.8 | 82.2 | 41.0 | 41.5 |
| Ligand | 38.0 | 75.0 | 80.3 | 42.5 | 43.0 |
| R.m.s. deviations | |||||
| Bond lengths (Å) | 0.004 | 0.001 | 0.008 | 0.002 | 0.002 |
| Bond angles (°) | 0.584 | 0.360 | 0.673 | 0.576 | 0.562 |
| Validation | |||||
| MolProbity score | 1.21 | 1.21 | 1.50 | 1.49 | 1.39 |
| Clashscore | 2.57 | 4.31 | 5.50 | 2.83 | 3.08 |
| Poor rotamers (%) | 0.83 | 0.98 | 0.26 | 1.80 | 1.24 |
| Ramachandran plot | |||||
| Favored (%) | 97.08 | 98.55 | 96.79 | 96.57 | 96.63 |
| Allowed (%) | 2.92 | 1.45 | 3.06 | 3.43 | 3.37 |
| Disallowed (%) | 0.0 | 0.00 | 0.16 | 0.0 | 0.00 |
Fig 2. Single particle analysis processing workflow from movies through consensus C2 refinement and focused refinements.
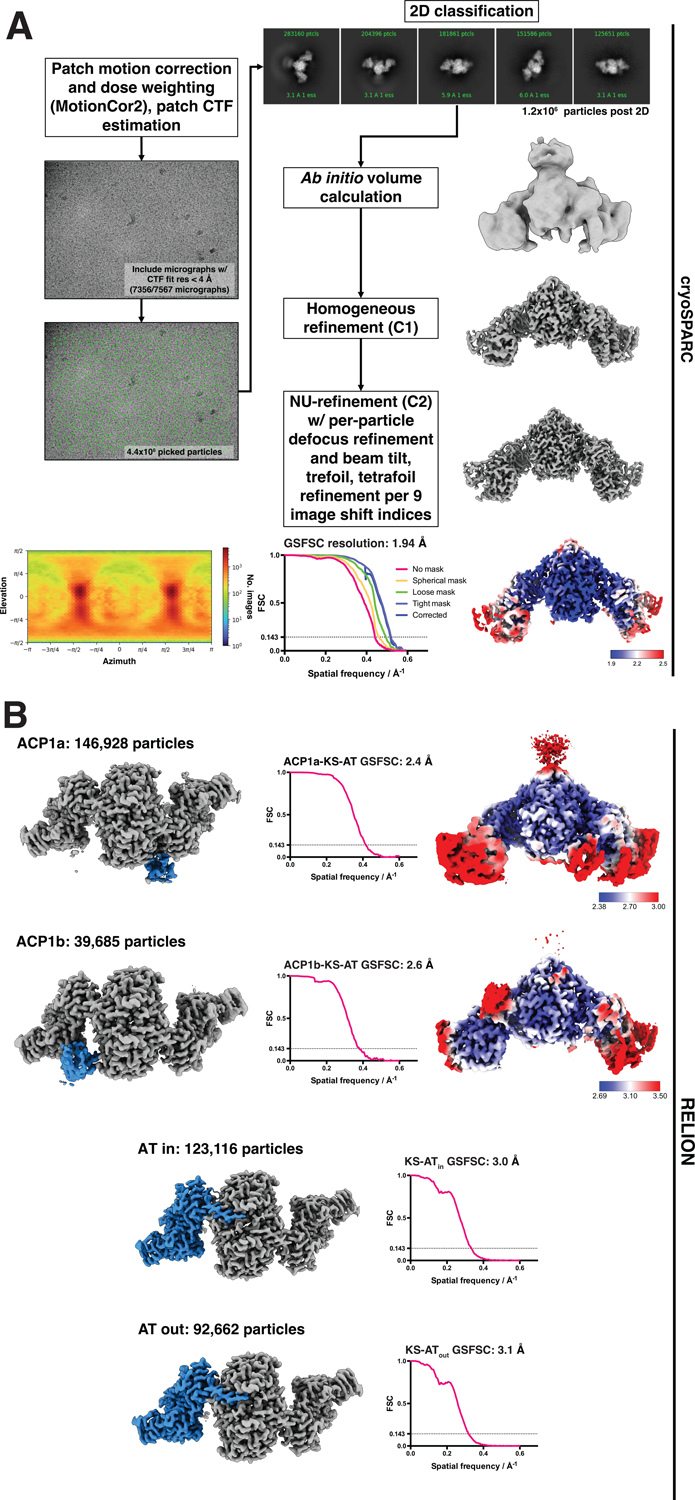
(A) Image processing workflow done in cryoSPARC for the initial consensus C2 refinement. Particle image pose heat map (displayed as blue to red, low to high numbers of images) showing an isotropic distribution, complete gold standard Fourier shell correlation plots using the FSC0.143 criterion, and the local resolution map are shown. (B) Symmetry expansion and focused classification done in RELION probing ACP1 and AT domain dynamics. Two classes were seen for positions of the ACP1, namely ACP1a (blue), and ACP1b (blue). Local resolution maps for the ACP1a and ACP1b structures illustrating lower resolution for the ACP domain are shown. The number of particles is ~3–4 times higher for ACP1a than for ACP1b indicating that if these represent similar proportions in solution, there is a very small energy difference between the two states. Two conformations of the acyl transferase domain (blue region in both) were identified and used for focused refinement. The soft masks used for focused classification encompass the blue-colored regions of each map, each dilated ~ 10 Å around the regions of interest. The maps showing the blue colored regions are viewed down the pseudo-symmetry axis, orthogonal to the viewing direction in (A). For each focused refinement, gold standard Fourier shell correlation plot using the FSC0.143 criterion is shown.
Fig 3. Map-to-model FSCs, and example EM densities.
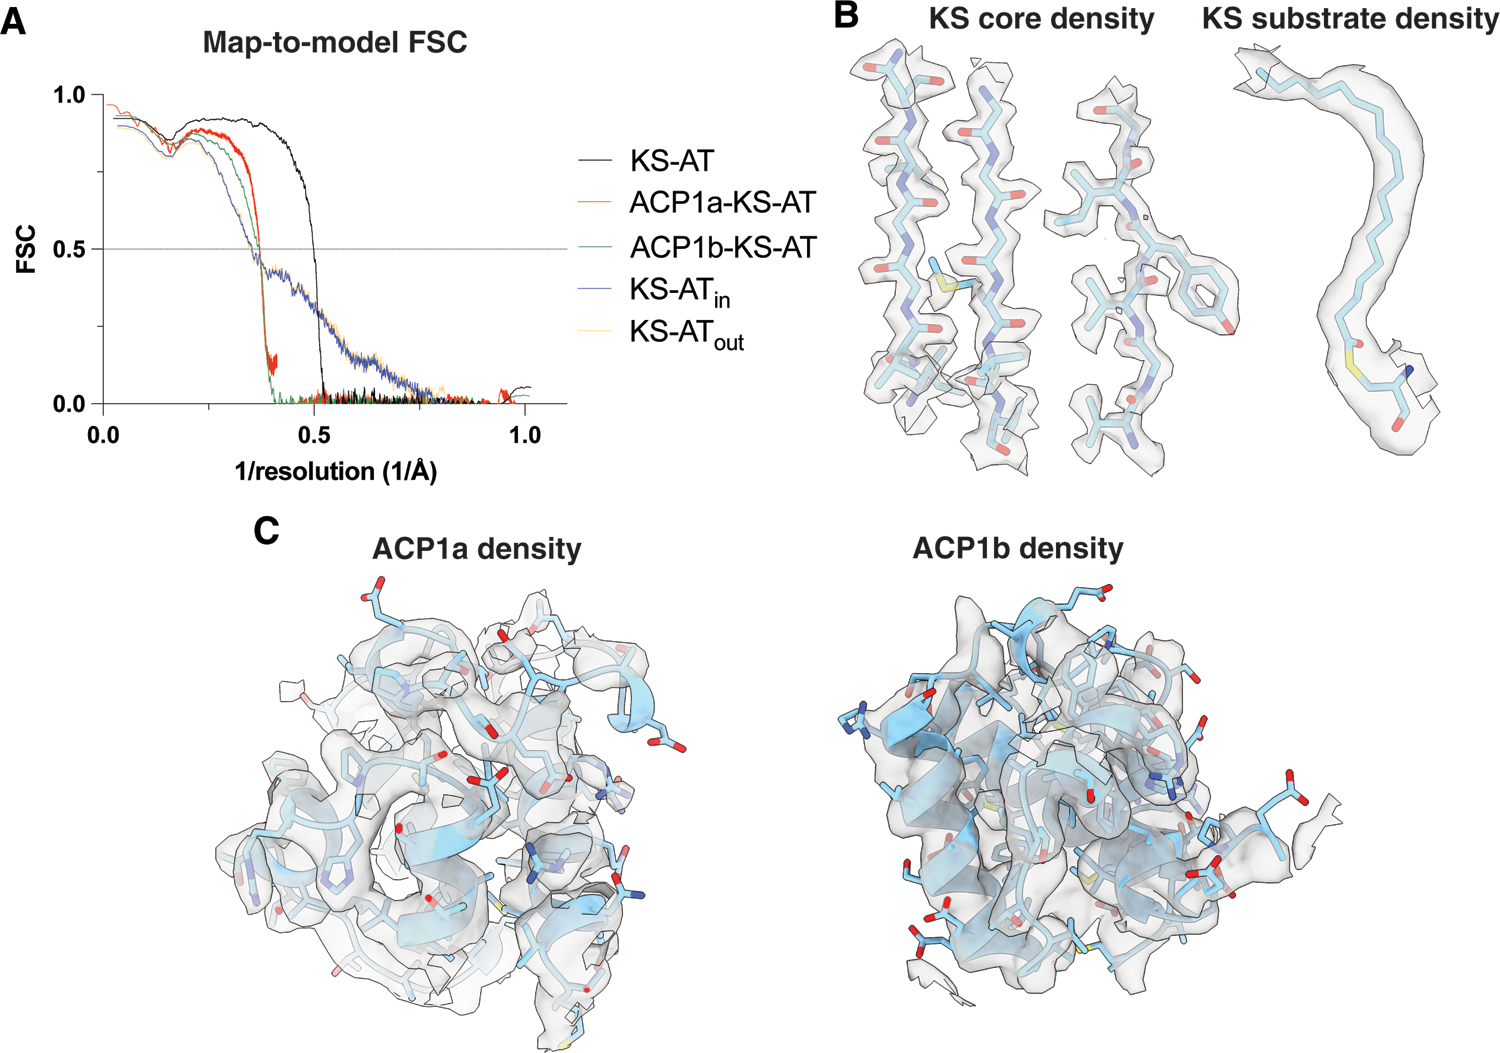
(A) Map-to-model FSC curves for all the structures described from consensus refinement and focused classifications and refinements. (B) Near-atomic resolution density in the KS core. Beta strands are shown (left) and lipid density extending upward from the KS active center C267 (right). (C) Density for ACP1a (left) and ACP1b (right).
Meromycolyl substrates are bound to the ketosynthase dimer
The most ordered parts of the structures that include the KS, KS-AT linker, and the AT domain were resolved to 1.8 Å atomic resolution from consensus C2 refinement and density modification (Fig 2A). Pks13 is a parallel homodimer of the multi-domain chains whose oligomerization is driven by the dimeric KS interface18,19 (Fig 1C). Substrate density protruding from each of the catalytic C267 residues in the KS dimer core (Fig 4) extends ‘upward’ through a hydrophobic tunnel labeled ‘KS lipid conduit’ that reaches solvent. Covalently bound fatty acid chains were identified by base hydrolysis and mass spectrometry (see methods). Following identification of the attached chains we determined that the meromycolate branch of chains attached to C267 are one of either the α2 mycolic acid (C55H106O2) ,10, or the α’ mycolic acid (C40H78O2),1120 (see below). These two alternative chains were previously activated by FadD32 AMPylation, and transferred onto the thiol of the Ppant arm attached to S38 of ACP1 with release of AMP21 (Fig 1B), and subsequently translocated into the KS active site by trans-thioesterification (Fig 1B).
Fig 4. Meromycolyl substrate in the KS active site.
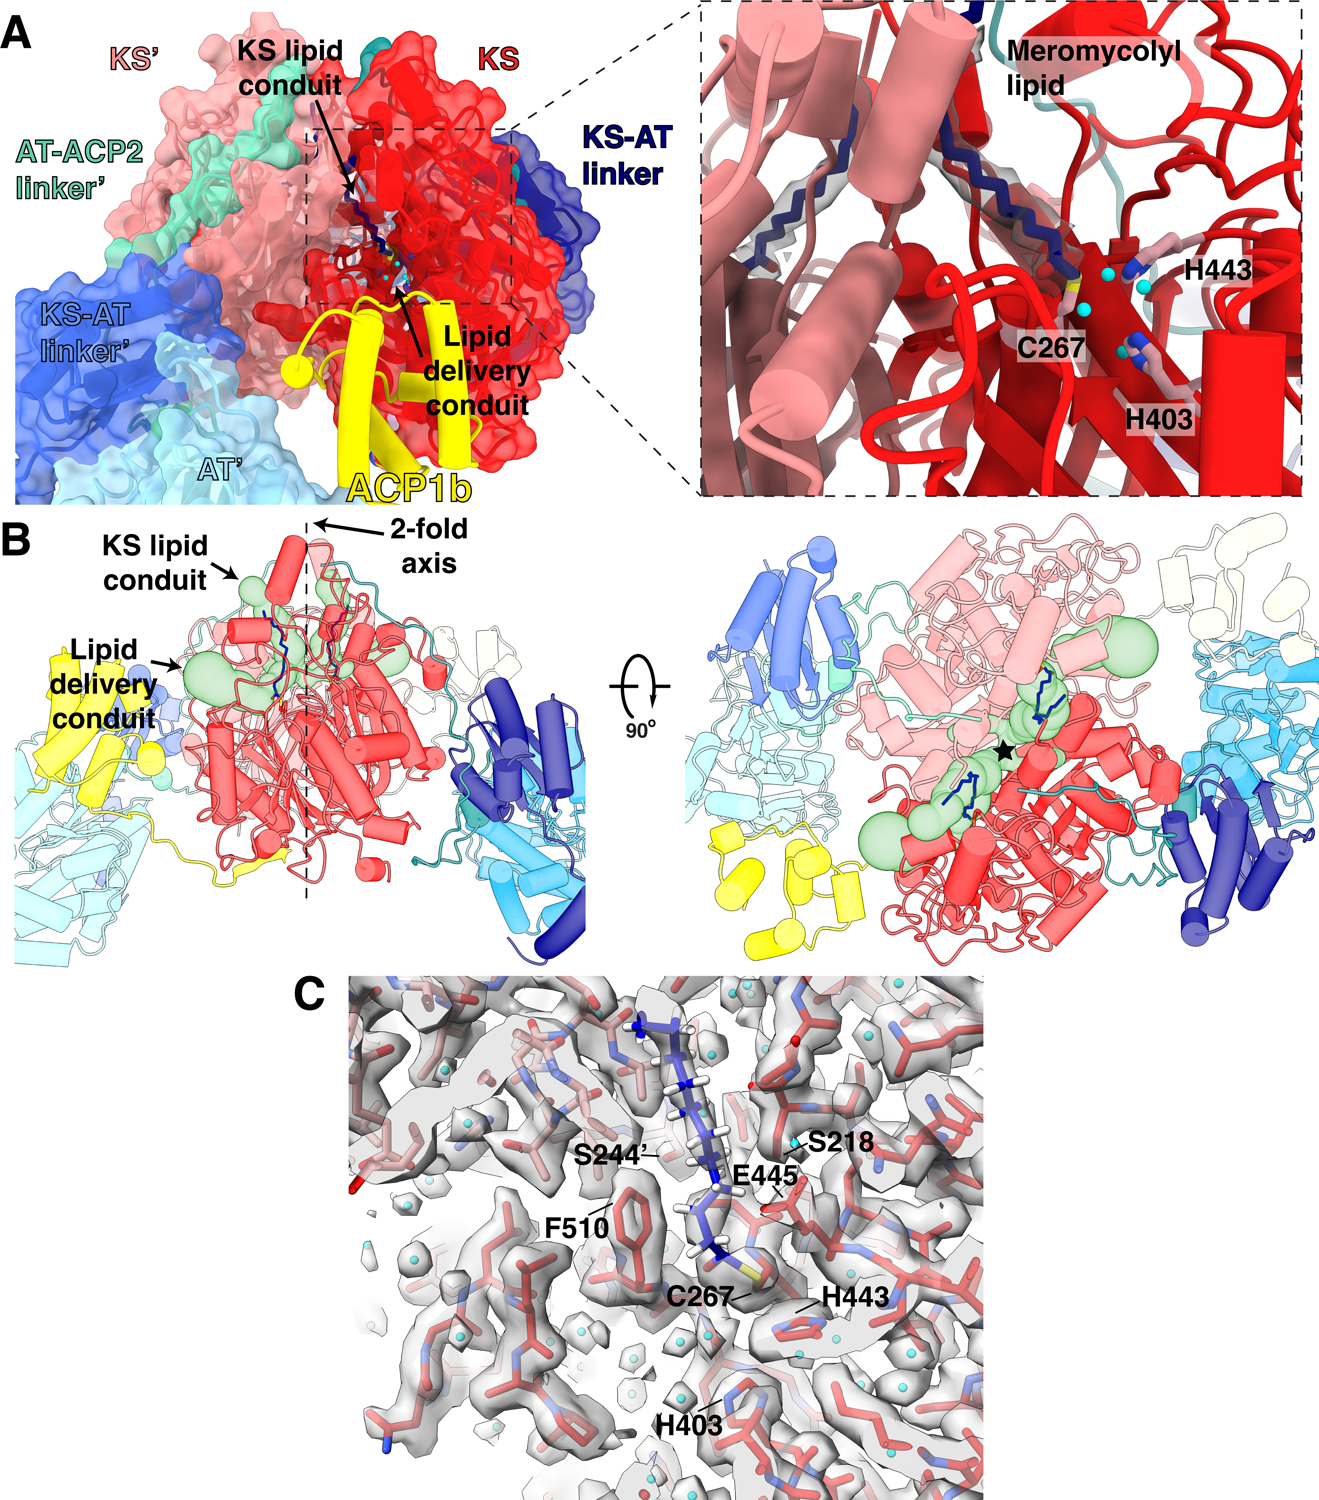
(A) A view of the ACP1b (yellow) near the KS (red) of the same protomer near the putative lipid delivery conduit. Inset: Close up view of the KS active site. The meromycolyl substrate is a thioester adduct with C267 and density for the lipid is shown within 2 Å about the carbon atoms. Active site residues C267, H443, and H403 involved in trans-thioesterification are shown in pink. Water molecules within hydrogen bonding distance of active site residues are shown as cyan spheres. (B) Front (left) and top (right) views of the ACP1b conformer structure with two branches of a hydrophobic tunnel (KS lipid conduit and lipid delivery conduit) shown as green surface models. The approximate location of the 2-fold axis is indicated as a dotted line and labeled in the front view (left) and by a star in the top view (right). (C) Density for the catalytic site and surrounding regions and water molecules, and the proximal portion of the meromycolyl substrate attached to C267.
Multiple ordered water molecules are seen within hydrogen-bonding distances of the conserved KS catalytic triad C267, H403 and H44310–12,18,22 (Fig 4A). The atomic structure of the active center and the positions of the first 18 CH2 groups of the substrate acyl chain are well-defined by the density at 2.4Å resolution (determined using Q scores)23 (Fig 3B, 4C). The distal parts of these chains reside outside the KS domain and are not visible in density indicating that they are less well ordered. They may possibly be sequestered by the detergent in our preparation.
ACP1 is seen in two alternate positions
Two stable positions of the ACP1 (ACP1a and ACP1b) with respect to the KS-AT dimeric structure were resolved using symmetry expansion and focused classification (Fig 2B, Movie S1). The ACP1a-KS-AT and ACP1b-KS-AT reconstructions are superimposed as a composite density map to display their relative positions (Fig 1C). The ACP1a-KS-AT reconstruction was refined to 2.4 Å, and the ACP1b-KS-AT reconstruction was refined to 2.6 Å by gold standard FSC, with lower resolutions for the ACP1a and ACP1b (3.6Å and 4.6 Å respectively from map-to-model comparisons using Q scores23) (Fig 2B, 3C).
ACP1a and ACP1b each have continuous density for residues 76–92 that connect ACP1 to the downstream KS. This 17-amino acid linking sequence (E76-R92) which we term the ‘DE-rich linker’ is negatively charged with nine acidic amino acids (E76, E78, E80, E82, D85, E86, D87, E88, D89). This linker adopts an extended chain configuration (Fig 1C, D). The last six amino acids (D87-R92) from the ACP1a and ACP1b conformers closely overlap in position and are near a positively charged surface of the KS containing R282, R384, and K388 (Extended Fig 2, 3). Notably E88 hydrogen bonds with R384 in the ACP1a conformer, and with R384 and K388 in the ACP1b conformer (Extended Fig 4,5). The preceding sequence of 11 amino acids (E76-E86) lie near positively charged surface tracts of two different regions on the KS surface (Fig 1D, Extended Fig 2–5). These positively charged surfaces are in stark contrast to the otherwise predominantly negatively charged electrostatic surface of the KS (Extended Fig 3).
The distance between ACP1a and ACP1b is approximately 60 Å with ~180° rotation of ACP1. ACP1a makes contacts with the KS, KS-AT linker domain, and the AT-ACP2 linker via its helix 2 and 3, and the 2–3 loop joining them (Extended Fig 6). This position is not seen in other PKSs or fatty acid synthases. The total buried surface area of 1106 Å2 is consistent with it being a transient association (Fig 1C,D, Extended Fig 6)24. Analysis of the interface using PISA suggests that it is an unusually hydrophobic interface with a ‘predicted solvation free energy’ of formation ΔGi of −8.5 kcal/mol25. There is a notable parallel, displaced pi-pi stacking interaction between guanidinium groups of R63 on the ACP1a and R496 on the KS (Extended Fig 6). The displaced pi-pi stacking interaction between R63 of ACP1a and R496 of the KS domain is not uncommon. Indeed 3.6% of all arginine side chains recorded in the protein data bank (PDB)26 were found in this interaction with each other27. The parallel but displaced guanidinium groups are 4.0Å apart and each is stabilized in its orientation by intradomain hydrogen bonded or charge-charge interactions with nearby carboxyl groups from within its same domain. The Arg interactions with the negatively charged carboxyl groups minimize the repulsive electrostatic energy between the stacked guanidinium groups28. These interactions add specificity to this ACP1a-KS-AT linker orientation. The Ppant arm attached to S38 of ACP1a is clearly resolved in density maps, and shows that it is not bound to a fatty acid chain (Extended Fig 6).
The second ACP1 position, ACP1b, is much closer than ACP1a to the second branch of the KS hydrophobic tunnel that forms a putative ‘lipid delivery conduit’ into the KS active site (Fig 4A,B). ACP1b contacts the KS from the same protomer with a total of 495 Å2 buried surface area through a hydrophobic interface (Extended Fig 7B). ACP1b also contacts the AT’ from the opposite protomer with a buried surface area of 126 Å2. This interface is more hydrophilic than the interface with KS and includes polar residues (Fig Extended Fig 7A)25. S38 of ACP1b which receives the Ppant arm, is 27 Å away from the KS active site C267 of the same protomer (Fig S2), where the meromycolyl substrate is seen attached in the structure. The Ppant arm seen in ACP1a is not resolved in the alternate ACP1b position due to limited resolution there, indicating that it is too flexible to be defined.
The negatively charged nature of the DE-rich linker, is generally conserved though not the specific amino acid sequences themselves, and the positively charged surfaces are conserved among Pks13 homologs from other mycobacterial species (Fig S3). This suggests a role of this linker and its interactions in guiding the dynamic trajectory of ACP1 for meromycolate delivery from FadD32 to the active site of the KS domain.
The number of particles seen on the EM grids is ~3–4 times higher for ACP1a than for ACP1b indicating a very small energy difference between the two states. Applying the free energy relationship between two states b and a at equilibrium, ΔG0=RTln ([b]/[a]) = ~0.8kcal/mol suggests a very small difference in free energy between these two states. This distribution is consistent with ACP1 function in readily accessing these positions to facilitate forward translocation of the meromycolyl chain.
The acyltransferase domain bound to the α-branch substrate
The second shorter ‘α-branch’ substrate chain (the α-carboxy-acyl-CoA (R2 C24-C26)) which is carboxylated by AccD4, gets transacylated from CoA to the active site serine (S798) of the AT domain to form an ester29 (Fig 1B). A clear density for the covalently bound α-carboxy substrate was observed at S798 at the AT active site in the ACP1a conformer. The endogenous substrate was resolved at 3.2 Å and 3.7 Å resolution (determined using Q scores) in each protomer, and is visible for the first eight carbons of the acyl chain (5A, Extended Fig 8). This proximal end of the substrate occupies a hydrophobic tunnel we term the ‘AT lipid conduit’ (Fig 5A). This chain is analogous to the ‘extender unit’ of modular PKSs10,30 (Fig 1B, Fig S1). The α-carboxy-acyl chain is subsequently transferred from the AT to the Ppant arm thiol bound to S1271 of the downstream ACP2. From there the R2-bound ACP2 is inserted into the KS active site to undergo decarboxylative Claisen condensation with the meromycolyl-cysteine adduct at C267 (Fig 4A). Decarboxylative condensation results in the α-alkyl β-ketoacyl thioester product, the direct precursor of mycolic acid9 (Fig 1B, Fig S1). The R stereochemistry at position 2 that bears the carboxyanion is conserved in all mycolic acids showing that the Pks13 reaction is stereospecific13.
Fig 5. Substrate-bound AT active site, and alternate inward and outward positions of the AT domain.
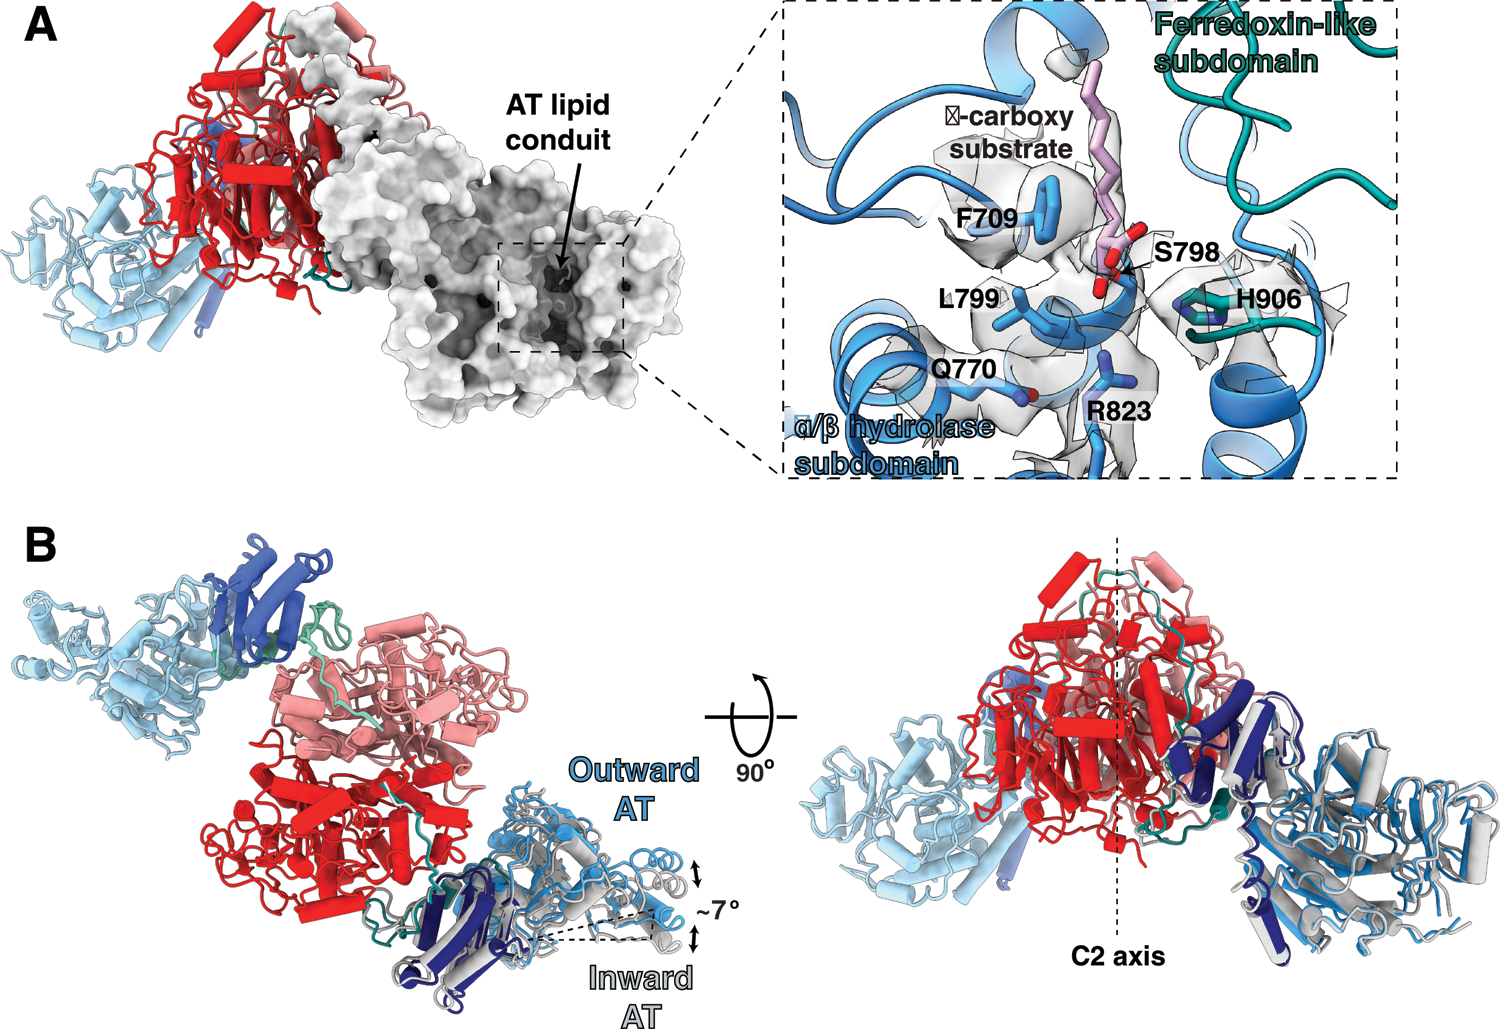
(A) Cartoon and surface representations viewed perpendicular to the vertical two-fold axis showing the lipid conduit in the AT domain. The inset shows an expanded view of the density for the α-carboxy lipid substrate in the AT lipid conduit between the α/β hydrolase subdomain (blue) and the ferredoxin-like subdomain (dark cyan). The α-carboxy substrate is attached as an ester linkage at S798. Surrounding active site residues, including the catalytic base H906, are labeled and shown with corresponding density. Density and atomic structure for the entire region is shown in stereo in Extended Fig 8. (B) Overlay of the AT conformers show the AT movement ~7° outward from their hinge point at the KS-AT linker domain. The inward conformation is shown in gray. Hinge movement is elaborated in Movie S1.
The native α-carboxylated substrate of the AT domain lies in a cleft between the α/β hydrolase and ferredoxin-like subdomains of the AT (Fig 5A, Extended Fig 8, Movie S1). The carboxylate of the carboxyacyl serine ester intermediate is stacked against the face of the phenyl ring of F709 (Fig 5A, Extended Fig 8). F709 in turn makes an edge to face pi-stacking interaction with F899. This type of anion-pi-pi stacking has been observed in many protein structures31. There is a pi-cation interaction between F899 and R897, which may serve to polarize the aromatic rings sufficiently to stabilize the carboxylate-F709 interaction. The Nε of the catalytic base H906 is close to both the Oγ of S798 (4.3 Å) and to the carbonyl oxygen of the substrate ester (3.9 Å), supporting its action as both the catalytic base and as a stabilizing force for the carbonyl oxyanion intermediate during the reaction. The imidazole of H906 is pinioned by hydrogen bonds from the Nδ1 -H to the carbonyl oxygens of G959 and H962. The Nε of H906, Oγ of S905, and NH2 of the R823 guanidinium group are all oriented to stabilize the oxyanion formed during the catalytic reaction (Extended Fig 8B).
When compared with the structure of a 52 kDa AT-containing fragment of Mtb H37Rv29 in complex with an α−carboxy palmitoyl substrate mimetic, our Ms Pks13AT has an RMSD of 1.00 Å versus the fragment, however the long fatty acid substrate density lies in a different solvent-exposed hydrophobic tunnel (‘lipid conduit’ in Fig 5A, Fig S4, Movie S1), and the Pks13 active site differs in that the guanidinium cation of R823 (R826 in Mtb) does not form a bidentate salt bridge with the α−carboxy group of the substrate fatty acid but is a key part of the oxyanion binding site formed during the reactions. These differences between the isolated AT and our multi-domain structures may reflect conformational restraints introduced by interactions of the AT domain with the KS and ACP1 domains in the native Pks13 environment. Such restraints may modulate access for substrate translocation to the ACP2.
KS and AT domains are connected by a flexible “ELBOW” that incorporates 59 unmodeled amino acids between residues 529 and 588 with its general location defined in the density (Fig 1C, Fig S5). An amphipathic helix (residues 588–608) found only in mycobacterial Pks13s leads into the well-ordered KS-AT linker domain (Fig S5). After symmetry expansion and focused classification, two discrete alternate conformations of the AT domain relative to the KS domain were resolved (Fig 2B). The two positions of each AT are rotated by 7° relative to the KS-AT linker domain (Fig 5B, Movie S1). This change cannot yet be correlated with any particular functional role in Pks13. The AT-ACP2 linker (residues 1032–1074) is well defined as an extended chain along the surface of the KS domain. It remains possible that this AT conformational change may accompany repositioning of some of the other domains that are C-terminal to the AT-ACP2 linker.
C-terminal regions are outlined by low resolution densities
The ‘HINGE’ region (Fig 1C) and two lenticular densities ‘on top’ of the 2-fold axis of the KS-AT domains (Fig 6) account for some or all of the remaining domains of the structure: these domains comprise a 143 amino acid linker (1075–1217), ACP2, a 138 amino acid linker, ACP3, and the TE domain (Fig 6A, B). These two density maps were recovered from symmetry expansion and focused classification with a large radius mask and were resolved at low (~20 Å) resolution. Because the densities seem to connect these two classes at low contour levels, we suggest that the structure may rock about the AT-ACP2 linker to HINGE connection by ~40° between these two states on either side of the dimeric core. This implies flexibility around the HINGE region to allow this movement in transferring substrates between the domains, and may account for the lower resolution in these regions. This kind of flexibility is consistent with the need for the ACP2 to pick up the α-carboxyacyl chain from the active center of an AT domain, then transport it for condensation with the meromycolyl chain on a KS domain, and to then transport the then two-chain α-alkyl β-ketoacyl thioester to the TE domain for transfer to trehalose. Solution structures of Pks13 also indicate flexibility between the N-terminal regions, including the ACP-KS-AT domains, and the ACP2-TE domains32.
Fig 6. C-terminal domains are visualized at low resolution in two alternate positions.
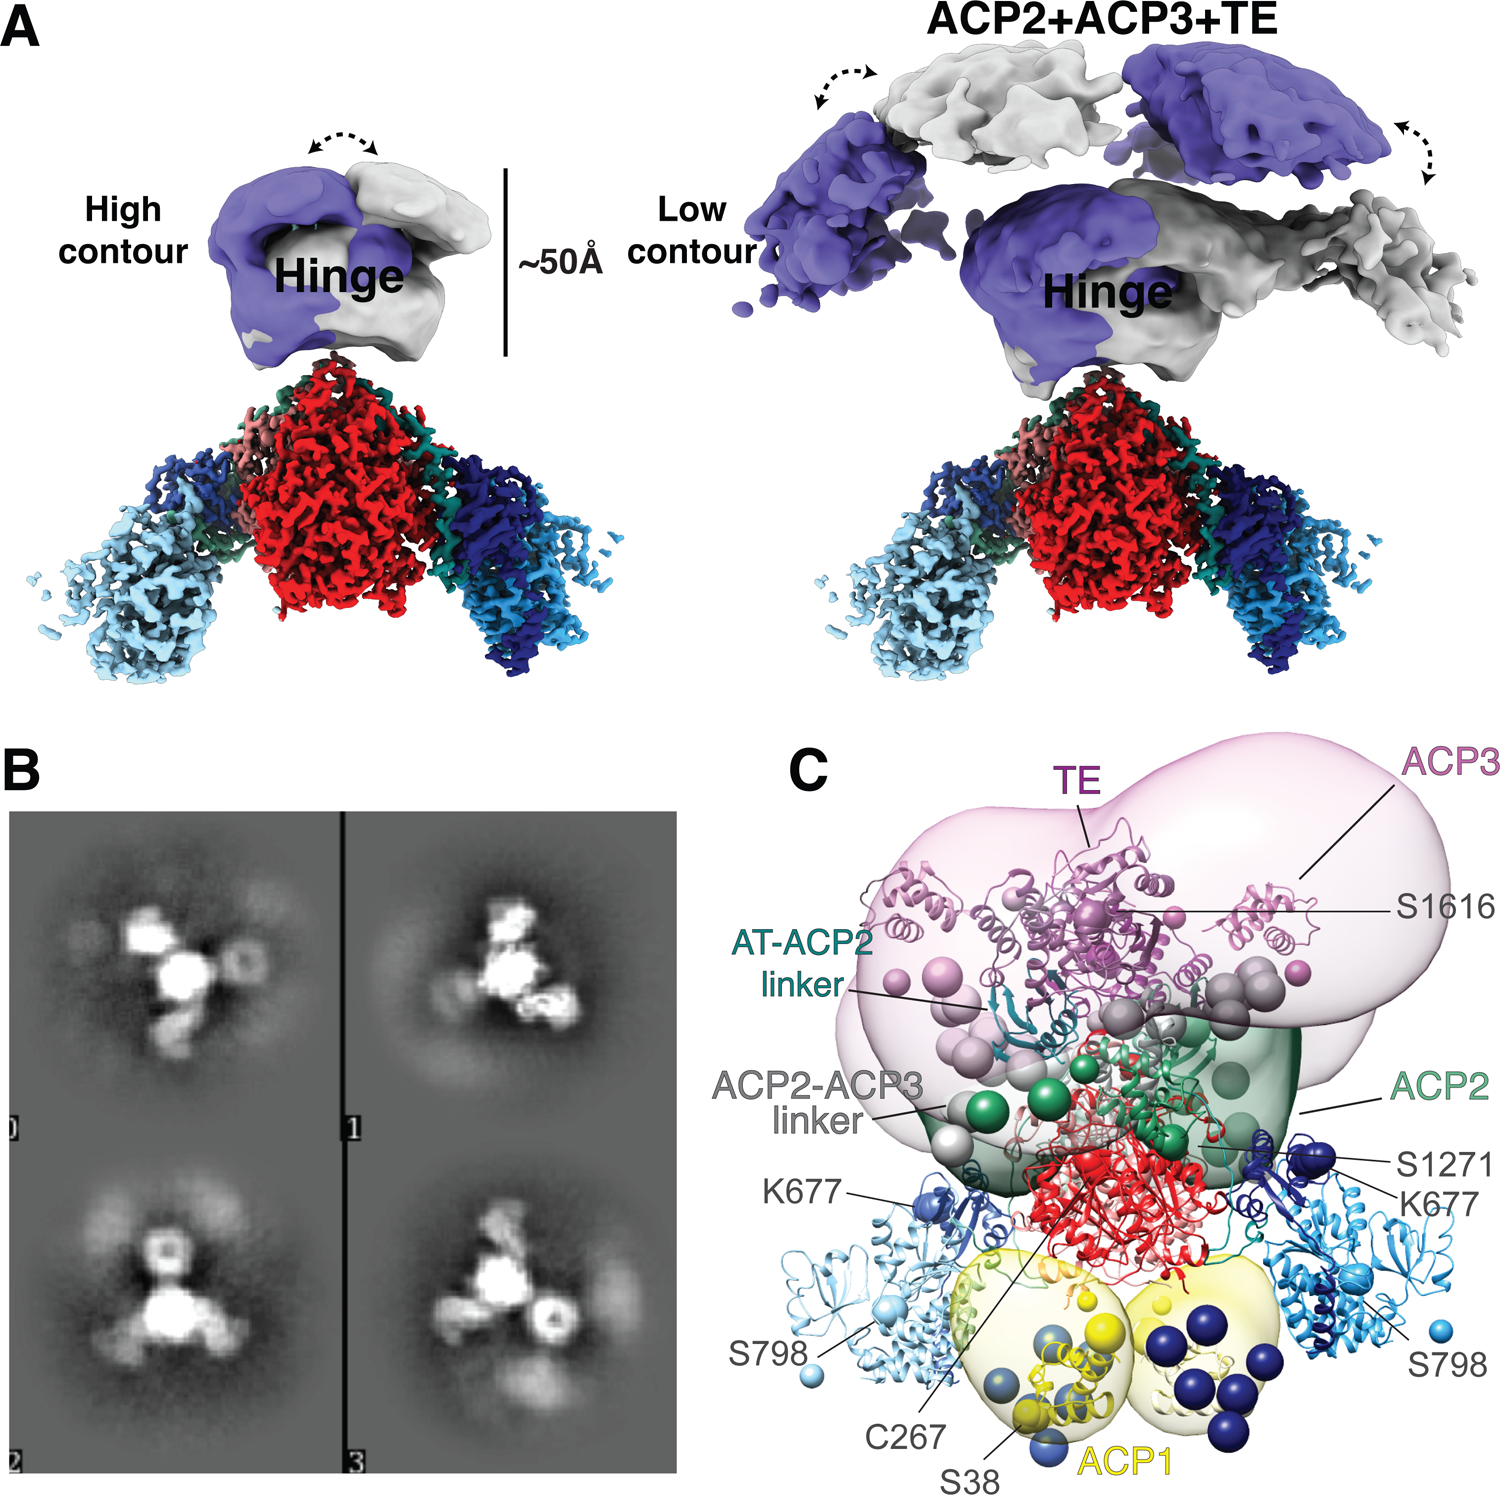
(A) The HINGE and C-terminal domains are visible at ~20 Å resolution in the cryo-EM map above the KS-AT domains. Using a large radius mask two conformations of the HINGE and C-terminal domain densities were recovered from focused 3D classification, shown in purple and grey respectively. Hence each of these image classes represent an asymmetric structure with respect to the two-fold symmetric high-resolution components. These two asymmetric states include the HINGE region and have low diffuse density between them indicating rocking between these alternative states. There is higher density in the HINGE region (left), versus the lenticular densities (right). (B) 2D classes showing smeared density attributed to the AT-ACP2 linker ACP2, ACP2-ACP3 linker domain, ACP3 and TE domains that have multiple positions around the connection to the AT domains at the base of the HINGE. (C) Integrative structure model of the Pks13 dimer based on the cryoEM structure, chemical cross-linking, and AlphaFold2 predictions. The model represents the centroid of the ensemble of good scoring models obtained through Monte Carlo sampling. Regions with well-defined structures were modeled as rigid bodies (shown as ribbons), while regions with no available structure or flexible regions were represented as strings of beads corresponding to up to 10 residues per bead (shown as beads). The structural ensemble is presented as a 3D localization probability density whose surface is rendered transparent for visual clarity, using the same color scheme for domains as in Fig 1A. Complete analysis of all classes is shown in Extended fig 10. Two-fold symmetry was applied to compute the model. Key residues, including K677 and active site residues S38, C267, S798, S1271, and S1616 are shown as spheres.
Identification of the bound substrate chains
The proximal regions of substrates at the active sites of the KS and AT domains are well defined in the density at 2.4 Å and 2.9 Å resolution. Density for the distal parts is more diffuse, consistent with less specific binding of the aliphatic chains outside the tunnels. The substrates attached to Pks13 were identified by hydrolysis followed by normal phase liquid chromatography coupled with electrospray ionization high resolution mass spectrometry (NPLC-ESI-HRMS). Their predicted and observed mass-to-charge ratios (m/z) accurate to three decimal places are listed in Table S1. Three very long chain fatty acids series were identified: 1) the longest series is centered around C55H106O2 12 with exact mass 798.819 Da. (Fig S6) and corresponds to R1 (Fig 1B). It is consistent with being the “alpha 2” meromycolate branch (C51-C57) found in Ms33,34, seen attached to C267 of the KS structure (Fig 4). 2) A series centered around C40H78O2, 13 with exact mass 590.600 Da (Fig S7) corresponds to an alternative R1, and is termed the “alpha-prime” meromycolate branch of length C36-C42 with C40 being most represented. This chain is consistent with the meromycolate branch of α’ mycolic acid found in Ms but not found in Mtb. 3) A series centered around C24H48O2, 14 with exact mass 368.365 Da. (Fig S8) corresponds to R2, a C22-C26 fully saturated chain with C24 as most represented (termed lignoceric acid) (Fig 1B). This fatty acid is consistent with the α-carboxy acyl chain attached to the AT active site as seen in the density (Fig 5A, Extended Fig 8). The mass however indicates that it lacks the expected α-carboxyl group that is seen in the density map. The carboxyl group may have been released during the hydrolysis from Pks13, or during mass spectrometry. The residue-specific attachment sites of fatty acids to the peptide chain, previously established for Mtb10 were not further reverified experimentally due to the difficulty of obtaining mass spectra of these long chain fatty acids attached to peptides.
Proximity of domain locations and integrative modeling
The diffuse densities for regions of Pks13 that are C-terminal to the AT-ACP2 linker in linear sequence suggest structural flexibility and a heterogeneous localization of these domains, as required to transfer substrates. To determine the localization of the flexible domains in solution, we performed cross-linking mass spectrometry (XL-MS). We used a disuccinimidyl sulfoxide (DSSO, 14)-based XL-MS3 approach35,36 (see methods). The spacer arm that bridges linked residues is 10.3 Å in length. When estimating distances between α-carbons of inter-linked lysine amino groups or the N-terminal amine we allowed for free-rotation, and therefore we classified a cross-link as satisfied if the Cα–Cα distance spanned by the cross-linked residues was less than 35 Å37.
We cross-linked natively purified Pks13 with increasing amounts of DSSO at 37°C and at 4°C (Fig S9). All bands associated with cross-linked products were excised from an SDS gel and analyzed by XL-MS3 (Fig S9). After removing data files associated with highly cross-linked samples (see methods), we used the filtered XL-MS3 dataset (see methods) and identified 604 redundant inter-links which corresponded to 57 unique linkages (Table S2; Fig S10C). In order to model the domains not seen in ACP1a or ACP1b configurations, and to capture flexibility in the in-solution structure, we used the 57 unique linkages (Extended Fig 9) from the filtered XL-MS dataset for integrative modeling.
Lysine 677 forms several cross-links to other domains that are present in the protein sample but defined only as diffuse domains in the structure (Fig 6), and the cross-links then support that the ACP2, ACP3, and the TE domain come close to the AT domain. This is necessary for the ACP2 to transport the α-chain from the AT domain to the KS active site to evoke the final condensation, and then to reach the TE domain for trans-esterification to trehalose. While the majority of the 33 cross-links formed within the atomistic portions of the Pks13 dimer structure are consistent with known distances in the dimeric structure, several are too far apart (Fig S10, Table S2,3). These are consistent with unexpected flexibility within the structure or higher order assemblies of Pks13 dimers as indicated in the dimer-of dimers seen as peak 1 in the size exclusion profile (Extended Fig 1A).
A structural model of the Pks13 dimer was computed by integrative modeling38–42 based on the 57 chemical inter-links (Extended Fig 9, Table S2,3) and structural models of the components of the Pks13 dimer (Table S4). These components include the current atomic structural model based on the cryo-EM maps, de novo AlphaFold2 predictions of domains unresolved in the cryo-EM structure43,44 and flexible linker regions (Extended Fig 10A). The cross-links were obtained from populations of structurally dynamic protein complexes as they exist in solution. A model of the Pks13 dimer was computed by satisfying this input information to the best possible degree using IMP45. The resulting ensemble of acceptable models satisfies 91% of the cross-links (Extended Fig 10B,C). The unsatisfied (over 35 Å) cross-links span mostly residues in the KS and AT domains, indicating that the rigid representation of the system is not adequate to capture the full range of conformations in solution. The integrative structure localizes the AT-ACP2 linker and ACP2 domain to the ‘HINGE’ region of the cryo-EM density map and suggests large uncertainty in the configuration of the ACP3 and TE domains within an arch-like volume above the ‘HINGE’ (Fig 6) or around the KS and AT domains (Extended Fig 10A). This uncertainty can in principle arise from both the actual structural dynamics of the domains, and relative lack of input information; it is difficult to deconvolute the two possibilities. Furthermore, the model indicates that the distances between the active sites of the ACP1(S38)-KS(C267), AT(S798)-ACP2(S1271), KS(C267)-ACP2(S1271), and ACP2(S1271)-TE(S1616) domains are highly variable, but that these active sites come into proximity (Extended Fig 10D).
Discussion:
A cartoon of the chemical scheme deduced from the structural arrangement is shown in Fig 7. The overall structure of Pks13 is a dimeric assembly of a series of domains that operate in ordered sequence between domains to assemble mycolic acids by condensation of two long chain fatty acids. These unusually long chain reactants are moved by carrier proteins (ACPs) between domains of the dimer. Within the dimer, domains from the two protomers are arranged across the two-fold axis, and by their relative proximities can operate sequentially on the substrates in cis or in trans between domains on either protomer of the dimer. The catalytic functions of several isolated domains of PKSs have been described independently at the levels of atomic structure and reaction chemistry18,46–49 though not previously seen in the context of their native environment.
Fig 7. Proposed pathway to the structures determined for substrates bound Pks13.
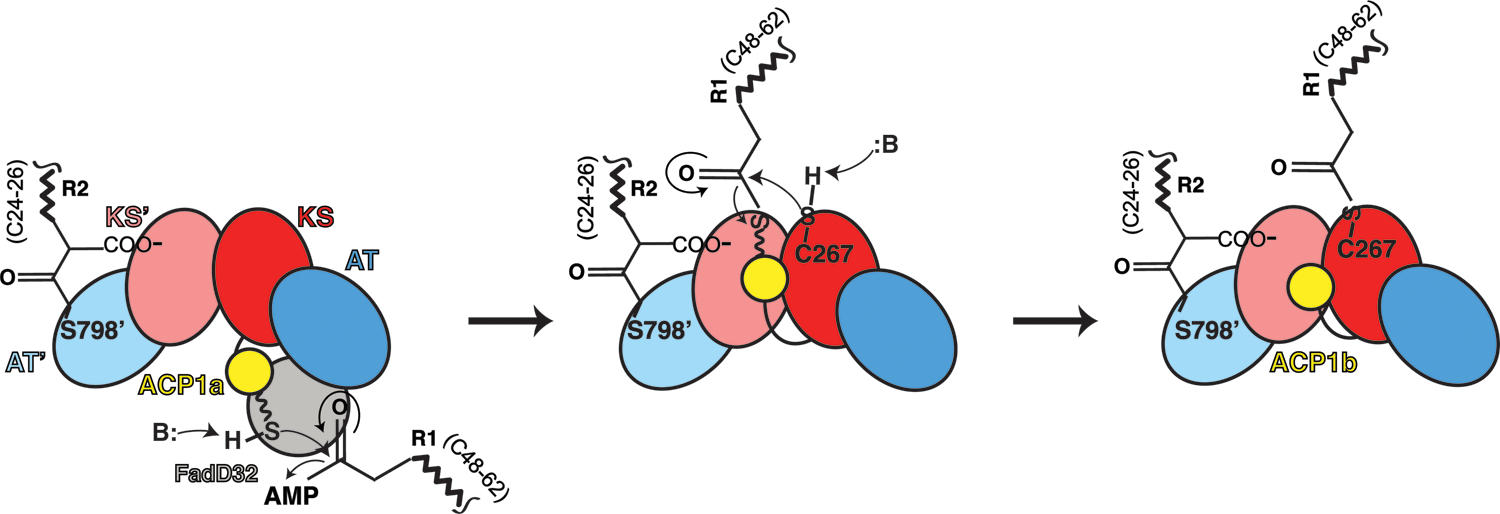
The chemical changes during the mechanism of Pks13 are schematized for just one side of the two-fold symmetric Pks13 dimer for clarity, and incorporating the two structures (ACP1a, ACP1b) we determined. The steps may occur in trans between alternate protomers as suggested by the relative proximities of the active sites of KS and AT of the contralateral protomer. Only the ACP1a, ACP1b, KS, and AT domains are cartooned to describe this initial part of the reaction up to the structure we determined (third panel). The left panel shows an early stage of the catalytic cycle in which the R2 fatty acid substrate chain of length (CH2)24–26 is attached to the AT domain as seen in the structure (Fig 5A). The Ppant arm depicted as a wavy line ending in a sulfhydryl and seen on ACP1a (yellow, first panel) links to the adenylated meromycolyl substrate (R1 (CH2)48–62) from FadD32. ACP1 delivers the attached meromycolyl substrate to the KS active site C267 through trans thioesterification as seen in the structure (third panel). This is the stable state reflected in the structure with native substrates bound. In the subsequent steps (not shown, schematized in Fig S1B) the carboxy-acyl substrate R2 is transferred to ACP2. Decarboxylative Claisen condensation proceeds between R1 and R2 where the enolate generated by decarboxylation attacks the meromycolyl thioester bound to the KS producing an α-alkyl β-ketothioester. Finally, the TE domain passes the condensed α-alkyl β-ketothioester product to trehalose and is released from Pks13. The product is subsequently reduced by CmrA to form trehalose monomycolate (TMM). TMM is subsequently transported across the plasma membrane by the transporter MmpL313.
The alternate ACP1 positions
Since both ACP1a and ACP1b are well ordered structures with specific hydrophobic interfaces we suggest that these may be intermediate positions on the pathway to deliver the meromycolate branch to the KS active site via the delivery conduit. The absence of clear density for the incoming meromycolate on the Ppant of ACP1a suggests that the structure is of an intermediate state following delivery of the R1 chain to the KS active site, and preceding the next FadD32 catalyzed attachment of the acyl-adenylate intermediate to the Ppant on the S38 of the ACP1a12. The meromycolyl substrates in the KS active site and the lack of the meromycolate density on the S38 of ACP1b suggest that this structure may represent the post-delivery position of the ACP1 retreating from the loaded KS domain. A conserved active site loop in KS is proposed to be a gate that opens to accept substrate50. In Pks13, this loop is in a closed position, consistent with the structure we determine being in a post-delivery state.
The serine S38 attached to the Ppant arm is removed ~17 Å from the position required to deliver the meromycolate (Fig S11A). A twist of ACP1b about its connection to the N terminal end of the DE-rich linker would position ACP1 S38 approximately 19 Å, the approximate length of the Ppant arm, from C267 of KS, allowing the Ppant thioester to deliver substrate to the KS active site (Fig S11A). In this docked position, helix III of ACP1 interacts with the KS accepting substrate, and loop 1 interacts with the KS’, KS-AT linker’, and AT’ domains of the opposite protomer. The docked ACP1b orientation in Pks13 is rotated ~90° from the DEBS module 1 ACP binding mode (Fig S11B).
The KS delivery conduit observed in the Pks13 structure near the ACP1b position is the same tunnel where both trans-acting and cis-acting ACPs bind to their cognate KSs, but the ACP interfaces with the conduit are not conserved. Detailed comparisons of the other KS-AT structures and ACP binding modes are in the Supplementary text and figures.
Bound substrates.
The fatty acid chains we identified for R1 and R2 are as expected for covalent adducts in the reaction of Pks13 domains, at a particular state in the reaction. The mass associated with each fatty acid chain defines the chemistry without ambiguity. The mass of the R1 “alpha-2” C55H106O2 species that is added to C267 indicates an unsaturated C-C double bond with an adjacent methyl substituent33. The alternative R1, “alpha-prime” mycolate, contains an unsaturated cis double bond and is found in Ms (though not in Mtb)20,34.
The requirement for detergent to release Pks13, we presume from the membrane, raises the question as to where the membrane association is encoded. We surmise that the very hydrophobic meromycolate chains might be chaperoned in part by the lipid bilayer, and so might provide the link that anchors Pks13 to the plasma membrane during mycolic acid synthesis.
Use of TAM16 as inhibitor of TE domain
The intent of using a TE inhibitor was to stall the throughput to final product, and thereby to make the sample more homogeneous structurally. The structure reported here is that of the TE-inhibited species that had a marginally better quality. However, the structure was also determined from the non-inhibited sample. Both structures were otherwise indistinguishable, which argues that the substrate bound states of KS and AT are stable states that do not proceed to the Claisen condensation in isolated Pks13 without some other input. Conceivably this could be driven forward by the arrival of new substrates from FadD32, and AccD4 for example.
The synthesis of mycolic acids from very long-chain hydrophobic intermediates depends on a chaperoned pathway, in which Pks13 provides a means to control and react on three specific very long chain fatty acids. In mycobacteria, the acyl-AMP ligase FadD32 and carboxylase AccD4 are encoded within a gene cluster comprised of fadD32-pks13-accD4, consistent with their concerted role in the condensation process (Fig 1A). This locus is found exclusively among the mycolic acid producing mycobacteria, and Corynebacterineae with high sequence identity. All three proteins are essential to Mtb and therefore are high value drug targets9,51.
First-line antimycobacterials against Mtb target earlier portions of the mycolic acid synthetic pathway, consistent with the essential role of mycolic acid synthesis in Mtb. Strategies to inhibit the active sites of the ACPs, KS, AT, TE, and the MmpL3 transporter of mycolic acids52,53 have been proposed but not yet led to drugs. The structure of the dimeric Pks13 may add new prospects for antimycobacterial drug discovery that take advantage of those interfaces between domains that we do see change throughout the carrier protein-mediated transport of substrates. These structures also serve to lay the groundwork for further understanding the process of how long chain fatty acids are translocated from their synthases to the Claisen condensation that results in mycolic acid synthesis.
Methods
Pks13 fusion generation and culturing
The Pks13-eGFP fusion strain was generated by chromosomally tagging the C-terminus of Pks13 gene with a TEV cleavage site followed by eGFP in the Ms recBCD-mutant strain as described previously16. The Pks13-eGFP protein was expressed under the native promoter in Ms when the culture was grown in 7H9 media supplemented with 1% (v/v) 50% glucose, 1% (v/v) 50% glycerol, and 0.05% (v/v) Tween 80 at 37° C to OD600 ~ 2. Cell pellets were washed three times with 1x PBS, frozen, and reduced to powder by cryo-milling54.
Fluorescence size exclusion chromatography
1 g of lysed cell powder (finely ground M. smegmatis frozen cell pellet resulting in cell lysis) was resuspended in 12 mL of solubilization buffer (50 mM Tris HCl pH 7.5, 150 mM NaCl), and a Roche cOmplete™ULTRA EDTA-free protease inhibitor cocktail tablet. 1 μl of benzonase (26.4 units μL−1; EMD Millipore) was added to help de-clump the lysate, which was stirred at 4° C for 1 hr. To seek a mode of solubilization non-denaturing detergents n-dodecyl-β-D-maltoside (β -DDM), glyco-diosgenin (GDN), digitonin, n-decyl-β-D-maltopyranoside (DM) that are often used for structure determination, and denaturing detergents Fos-choline 12 (FC12), Triton X100 that are denaturing but harsher in solubilizing from membranes were separately added to aliquoted lysate to final 1% (w/v) and solubilized at 4°C for 2 hrs. Unsolubilized materials were pelleted at 100k xg for 20 min, and samples were filtered with 0.22 μm filter prior to injection onto the column. A Superose 6 Increase 5/150GL column (GE Healthcare) was run at 0.05 ml/min where 40 μL of each detergent-solubilized sample was loaded with the mobile phase (50 mM Tris HCl pH 7.5, 150 mM NaCl, Roche cOmplete™ULTRA EDTA-free protease inhibitor cocktail, 0.15 mM β-DDM). β-DDM solubilization achieved the most optimal solubilization of Pks13, and thus was used for purification of the protein.
Protein purification for cryoEM studies
10 g of cryo-milled lysed cell powder (finely ground M. smegmatis frozen cell pellet resulting in cell lysis) was resuspended in 100 mL buffer (50 mM Tris pH 7.5, 150 mM NaCl, 1% β-DDM, one tablet of Roche cOmplete™ ULTRA EDTA-free protease inhibitor cocktail). 10 μl of benzonase (26.4 units μL−1; EMD MilliporeSigma) was added and the solution was stirred at 4°C for 2 hrs to solubilize membrane-tethered Pks13. The lysate containing Pks13 was spun at 100 kg for 30 min at 4° C. Supernatant containing Pks13 was incubated with 5 mL of anti-GFP nanobody beads at 4°C for 1.5 hr to allow GFP-tagged Pks13 to bind to the anti-GFP nanobody beads. Anti-GFP nanobody beads were prepared by first expressing and purifying the anti-GFP nanobody protein from E. coli BL21(DE3) and conjugating to NHS-Activated Sepharose 4 Fast Flow (Cytiva) following the manufacturer’s protocol for conjugation. Pks13-GFP bound anti-GFP nanobody beads were washed three times with 30 mL of buffer (50 mM Tris pH 7.5, 150 mM NaCl, 0.2% β-DDM), with three-minute shaking for each wash to remove non-specifically bound protein(s). Washed anti-GFP nanobody beads were resuspended in 18 mL of buffer (50 mM Tris pH 7.5, 150 mM NaCl, 0.2% β-DDM) and incubated with ~1:10 TEV:Pks13 weight ratio of TEV enzyme overnight with gentle shaking at 4° C to cleave off the C-terminal GFP tag from Pks13. Cleavage of Pks13 from GFP using TEV protease yielded full length Pks13 with an additional five-amino acid linker (-SKSTS-) followed by six amino acids from the TEV cleavage site at its C-terminus. TEV-cleaved Pks13 protein sample was concentrated and purified on a Superose 6 increase 10/300GL column (GE Healthcare) with buffer (50 mM Tris pH 7.5, 150 mM NaCl, and Roche cOmplete™ ULTRA EDTA-free protease inhibitor cocktail), at a 0.3 ml/min flow rate (Extended Fig 1A). Fractions containing the Pks13 first peak were pooled and concentrated to 1.5 mg/ml (4μM). The TAM16 inhibitor of the terminal thioesterase17 was prepared as a 50mM stock in DMSO, and added to the 4 μM protein sample to a final 40 μM concentration with the aim of stabilizing and ordering the thioesterase domains. Inhibitor and Pks13 protein were incubated together at 4° C for one hour before cryo-EM grid preparation.
Cryo-EM sample preparation
Pks13 sample was concentrated to 1.5 mg mL−1 for cryo-EM grid preparation. 4.5 μL of sample was applied to freshly glow discharged holey carbon on gold R1.2/1.3 300 mesh Quantifoil grids and blotted for 9 s with Whatman 1 filter paper at max humidity and 10°C in a FEI Mark IV Vitrobot, before vitrification in liquid nitrogen-cooled liquid ethane.
Image acquisition
Grids were loaded onto an FEI Titan Krios G3 (at UCSF) operating at 300 kV, equipped with a K3 BioQuantum imaging system, using a 20 eV energy slit at UCSF. Imaging was performed in nanoprobe mode using a 70 um C2 aperture, with a ~1.3 um parallel illuminated area, without an objective aperture. The nominal EFTEM magnification was 105,000x, resulting in a super-resolution pixel size on the specimen of 0.4175 Å pix−1. The dose rate was 8 e− pix−1 s−1 with a total exposure time of 5.9 s, fractionated into 117 frames, using correlated double sampling. Movies were acquired semi-automatedly with SerialEM, using 3×3 hole beam-shift image-shift, over a nominal underfocus range of 0.7 to 1.5 μm. The super-resolution movies were drift corrected and dose weighted using UCSF MotionCor255 and twice Fourier binned to a pixel size of 0.835 Å pix−1.
Image processing
7567 dose weighted images were imported into cryoSPARC v2.1256 and CTF estimation was performed in patches. 4.4×10⁶ particles were picked ab initio and extracted using a 386 pixel box and subjected to 2D classification from which 1.2×10⁶ particles were retained. The particle set was then used to calculate an ab initio 3D volume which displayed high resolution features and quasi-C2 symmetry. The initial volume, low pass filtered to 30 Å was used as a reference for global angular refinement, without imposition of symmetry. Sequential refinement of beam tilt, defocus, Cs, trefoil and tetrafoil resulted in a nominal 2.0 Å reconstruction by gold standard Fourier shell correlation using a 0.143 criterion. Resolution-limited refinement in cisTEM57 also produced a 2.0 Å reconstruction.
The same procedure was also repeated with imposition of C2 symmetry resulting in a nominal 1.9 Å reconstruction of the KS-AT didomain, and density modification in Phenix resolve_cryo_em58,59 produced a map with 1.8 Å resolution, which we used for model building (Fig 2A). These particle data were exported to Relion 3.060 for symmetry expansion and focused classification. The C2 map was filtered and segmented in UCSF Chimera61,62 for selection of domains to focus on. These maps were used to calculate cosine-edged masks using “relion_mask_create”. The particle stack was C2 expanded using “relion_particle_symmetry_expand”, and classified against the C2 map, using masks for the ACPs, AT and KS-AT domains, without angular searches, varying the regularisation parameter tau from 8 to 20. The particle subsets that provided the best visual features of each respective domain from each classification were selected and further refined using local angular searches and masking over the region of interest. This procedure produced the following maps at respective GSFSC resolutions: ACP1a-KS-AT map at 2.4 Å, ACP1b-KS-AT map at 2.6 Å, KS-ATin map at 3.0 Å, and KS-ATout map at 3.1 Å (Fig 2B). In order to assist with model building and interpretation, B factor modified maps were calculated using Phenix AutoSharpen63 for the ACP1a-KS-AT and ACP1b-KS-AT maps, and KS-ATin and KS-ATout maps were modified with DeepEMhancer64.
Model building and refinement
Pks13 KS and AT core domains were built de novo using a Phyre2-generated homology model65 as a guide. ACP1a and the DE-rich linker were built into the density de novo guided by aromatic side chain densities for residues W9, W13, F62, and W90. ACP1b was similarly built into density.
Model building and refinement were performed using Coot66, ISOLDE67, and phenix_real_space_refine68 using a combination of sharpened and density modified volumes. KS-AT didomain was finally refined against the density-modified map from Phenix resolve-cryo-em, and ACP1a-KS-AT, ACP1b-KS-AT were finally refined against B-factor modified maps from Phenix AutoSharpen, and KS-ATin, KS-ATout were finally refined against sharpened maps from DeepEMhancer. All map and model Figures were prepared using University of California, San Francisco (UCSF) Chimera61 and ChimeraX62. MOLE69 was used to calculate the tunnels reported in the models.
Analysis of fatty acids in PKS13 by alkaline hydrolysis and LC/MS
Chains attached to PKS13 were determined by mass spectrometry. Negative ion electrospray ionization (ESI) mass spectra of fatty acids released by hydrolysis are shown (Fig S6, S7, S8), along with their chemical structures and corresponding molecular formulae of the major species. Fatty acids are primarily detected as the deprotonated [M-H]− ions, along with lower levels of the chloride adduct [M+Cl]− ions. Hence the fatty acids are determined in the negative ion mode, being 1 Dalton less than the neutral species as listed in the figures.
To remove the fatty acids from the protein, the Pks13 protein sample was subjected to mild alkaline hydrolysis in 3.8 mL chloroform/methanol /0.4 N KOH (1:2:0.8, v/v) at room temperature for 1 hr. The system was converted to a two-phase Bligh/Dyer mixture consisting of chloroform/methanol/water (2:2:1.8, v/v/v) by adding appropriate volumes of chloroform and water. The lower phase was dried under a stream of nitrogen and stored at −20 °C before further analysis. Lipid analysis by normal phase liquid chromatography coupled with electrospray ionization /mass spectrometry (NPLC-ESI/MS) was performed as described70 using an Agilent 1200 Quaternary LC system (Santa Clara, CA) coupled to a high resolution TripleTOF5600 mass spectrometer (Sciex, Framingham, MA). An Ascentis® Si HPLC column (5 μm, 25 cm × 2.1 mm, Sigma-Aldrich) was used. Mobile phase A consisted of chloroform/methanol/aqueous ammonium hydroxide (800:195:5, v/v/v). Mobile phase B consisted of chloroform/methanol/water/ aqueous ammonium hydroxide (600:340:50:5, v/v/v/v.). The mobile phase C consisted of chloroform/methanol/water/aqueous ammonium hydroxide (450:450:95:5, v/v/v/v). The elution program was as follows: 100% mobile phase A was held isocratically for 2 min and then linearly increased to 100% mobile phase B for 14 min and held at 100% B for 11 min. The LC gradient was then changed to 100% mobile phase C for 3 min and held at 100% C for 3 min, and finally returned to 100% A over 0.5 min and held at 100% A for 5 min. Instrumental settings for negative ion ESI and MS/MS analysis of lipid species were as follows: ion spray voltage (IS) = −4500 V; current gas (CUR) = 20 psi (pressure); gas-1 (GS1) = 20 psi; de-clustering potential (DP) = −55 V; and focusing potential (FP) = −150 V. The MS/MS analysis used nitrogen as the collision gas. Data acquisition and analysis were performed using the Analyst TF1.5 software (Sciex, Framingham, MA).
Based on exact mass measurement, three fatty acid series were identified, 1) C51-C57 long (Fig S6); 2) C36-C42 in length (Fig S7); 3) C22-C26 length (Fig S8). 1) The C51-C57 series are consistent with α2-meromycolate as the substrate for which the proximal portion is seen attached to the active site cysteine C267 of KS in the structure (Fig 4). It could theoretically also have been consistent with being released from attachment to the ACP1 Ppant extension prior to trans thioesterification and delivery to the KS. However, no modification is seen in the ACP1 structure arguing against this possibility. Therefore, we conclude that it is the species attached to the KS, hence the system has been captured prior to the Claisen condensation. This mass could have also been consistent with a cyclopropane in the aliphatic chain. However, cyclopropanes are not produced in M.smegmatis hence the assignment to the methyl substituent next to the double bond is assured. 2) A very long chain (C36-C42) with a cis-double bond in the chain is consistent with the “alpha prime” mycolate found in Ms but not in Mtb20. This chain also is an alternative chain derived from the KS active center. 3) C22–26 fatty acids are fully saturated and most consistent with the α-branch species seen in density attached to the AT active center at serine S798. An additional possibility is that some of this species might also have been removed from the ACP2 prior to the Claisen condensation though the ACP2 is not defined in the Pks13 structure. The mass spectra of C22–26 fatty acids do not contain the expected alpha-carboxyl group that is seen in the structure. The carboxyl may have been unstable at some part of the hydrolysis or during mass spectrometry.
Analysis of Pks13 complexes by in solution DSSO cross-linking and multi-stage mass spectrometry (XL-MS3)
We used a disuccinimidyl sulfoxide (DSSO)-based XL-MS3 approach35,36, wherein DSSO covalently crosslinks primary amines of the sidechains of lysines (K) or the N-terminus of the protein. Following enzymatic digestion, the resulting peptides are separated by liquid chromatography (LC) and analyzed by multi-stage MS: 1) intact peptide ions are measured at the MS1 stage; 2) using a lower energy collision-induced dissociation (CID) the DSSO backbone is cleaved while leaving peptide backbones intact, and the resulting fragment ions are measured at the MS2 stage; 3) each resulting ion is isolated in the instrument and the peptide backbone is fragmented using standard higher-energy C-trap dissociation (HCD) for peptide sequencing at the MS3 stage. Using this approach we were able to distinguish between inter-linked and ‘dead-end’ or mono-linked peptides71. Inter-linked peptides are the result of two cross-linked epsilon amino groups of lysine side chains (or the N-terminal alpha amino group) that cross-link two separate peptide species (α and β). Mono-linked peptides are formed when a lysine or the N-terminus reacts with DSSO, and before a second residue can form a bridge, the DSSO hydrolyzes resulting in a dead-end.
Pks13 protein complexes were purified from M. smegmatis the same way as for cryoEM sample preparation except for the TAM16 addition. Purified Pks13 complexes were cross-linked with increasing amounts of DSSO solubilized in anhydrous DMSO (Table S3). The first replicate was prepared in duplicate, with both replicates cross-linked for 30 min at 1000 RPM, one at 37°C and one at 4°C, with the following molar ratios of DSSO to complex: 1:10; 1:50; 1:250; and 1:1000. Based on the similarity between DSSO cross-linking at 37°C and one at 4°C for Pks13, replicate 3 and 4 were cross-linked for 30 min at 1000 RPM at 37°C only with the following molar ratios: 1:50; 1:250; and 1:1000. Cross-linking reactions were quenched with 50mM Tris pH 8, and then mixed with 4x SDS-PAGE loading buffer to a final 1x concentration (1x SDS-PAGE loading buffer: 62.5mM Tris pH 6.8, 2% SDS, 75mM DTT, 7.5% Glycerol, and 0.02% Bromophenol Blue). Protein samples were then separated by SDS-PAGE on 4–20% Criterion TGX gels (BioRad), stained by AcquaStain (Bulldog Bio) MS safe blue protein stain, and bands excised for in gel digest (Fig S9). Gel pieces were cut to 1mm2 cubes, dehydrated, rehydrated in 15mM TCEP, 25mM NH4HCO3 reducing buffer, and alkylated in 50mM chloroacetamide in the dark. Gel pieces were dehydrated and rehydrated in 0.5ng/uL trypsin buffer for protein digest. Peptides were extracted from the gel pieces with 50% acetonitrile (ACN), 5% formic acid (FA), dried, and resolubilized in 3% ACN, 2% FA. Resolubilized peptides were separated using an Easy-nLC 1200 (Thermo Fisher Scientific) on a 75 μm × 30 cm fused silica IntregraFrit capillary column (New Objective) packed in-house with 1.9-μm Reprosil-Pur C18 AQ reverse-phase resin (Dr. Maisch-GmbH), or a 15 cm-long column containing 1.7 μm BEH beads (Waters). Peptides were eluted from Reprosil-Pur C18 AQ columns at 300nL/min using the following linear gradient: 50%–8% B in 5 min, 8%–45% B in 35 min, 45%−100% B in 12 min, 100% B for 5 min, 100%−2% B in 2 min, and 2% B for 2 min (mobile phase buffer A: 100% H2O, 0.1% FA; mobile phase buffer B: 80% ACN, 0.1% FA). Peptides were eluted from BEH columns at 300nL/min using the following linear gradient: 5%–22% B in 40 min, 22%–32% B in 5 min, 32%−100% B in 5 min, and 100% B for 10 min (mobile phase buffer A: 100% H2O, 0.1% FA; mobile phase buffer B: 80% ACN, 0.1% FA). Each sample was analyzed in technical duplicate by two independent MS3 methods on an Orbitrap Fusion Lumos (Thermo Fisher Scientific) operated in positive ion mode. In one method, a single acquisition cycle consisted of 9 scan events: 1) one full MS1 scan in the orbitrap (350–1200 m/z, 60,000 resolution, max injection time of 50 ms); 2) two data-dependent MS2 scans in the orbitrap (30,000 resolution, normalized AGC target at 200%, isolation window 1.6 m/z) with normalized collision energy set at 22% on the top two precursor ions; and 3) four MS3 scans in the ion trap (isolation window 2.5 m/z, standard AGC target, auto max injection time, rapid scan rate) with HCD collision energy set at 30% on the top 4 ions from each MS2 scan. In the second method, a single acquisition cycle was allowed 3 sec and consisted of: 1) full MS1 scan in the orbitrap (350–1200 m/z, 120,000 resolution, max injection time of 100 ms); 2) data-dependent MS2 scans in the orbitrap (30,000 resolution, normalized AGC target at 200%, isolation window 1.6 m/z) with normalized collision energy set at 22% on the top two precursor ions; and 3) four MS3 scans in the ion trap (isolation window 2.5 m/z, standard AGC target, auto max injection time, rapid scan rate) with HCD collision energy set at 30% on the top 4 ions from each MS2 scan. For both MS methods ions with charge state 4 to 8 were sampled for MS2 and dynamically excluded for 20 seconds (tolerance of 10 ppm), and ions with charge state 2 to 6 with precursor ions (5 m/z tolerance) excluded were selected for MS3.
Cross-linked peptides were analyzed as described in Kaake et al38. In total, we identified 1435 inter-links and 2300 dead-end links including redundant counts, with a false positive rate of 1% as calculated by the identification of decoys (Table S5, Fig S10A). This included a small number of linkages between identified contaminating proteins (29 inter-links and 53 mono-links) (Table S5). In total, the number of redundant Pks13 inter-links corresponded to 96 unique K-K linkages, 63 of which could be mapped to the ACP1a or ACP1b configurations of Pks13 with 50.8% of those found within the expected α carbon distance of 35 Å, and a high number of long-distance violations (>50 Å) (Table S6, Fig S10B). Among the 96 unique linkages we identified 8 that could only come from oligomeric structures between at least two dimers of Pks13, all of which when mapped to either the ACP1a or the ACP1b configurations of Pks13 were beyond expected distances. Suspecting that some of the highly cross-linked samples were the product of aggregation or higher order oligomeric structures, we re-analyzed the data but removed the data files that were associated with highly cross-linked samples (Table S2 and Fig S9). Using this filtered XL-MS3 dataset, we identified 604 redundant inter-links which corresponded to 57 unique linkages (Table S2; Fig S10C). This corresponded to 33 linkages that mapped to ACP1a or ACP1b configurations, with 67% of those within the expected distances, and only one long-distance violation (Table S2; Fig S10D). Most of the violations can be accounted for by small movements or flexibility in the structure. In order to model the domains not seen in ACP1a or ACP1b configurations, and to capture flexibility in the in-solution structure, we used the 57 unique linkages (Extended Fig 9) from the filtered XL-MS dataset for integrative modeling.
The proteomics data from each step of the analysis pipeline, including raw files, MS2 and MS3 extracted peak files (from MSConvert (ProteoWizard72,73)), MS3 search files (from ProteinProspector v 6.2.17), and associated search and filtering parameters files, have been deposited to the ProteomeXchange Consortium via the PRIDE74 partner repository with the dataset identifier PXD033471. Annotated spectra for all inter-linked, dead-end, and single peptides can be found on the MSViewer75application through ProteinProspector (https://msviewer.ucsf.edu/prospector/cgi-bin/msform.cgi?form=msviewer).
Integrative structure modeling of the Pks13 dimer
A structural model of the Pks13 in solution was computed by integrative modeling39,42,76, based on atomic models of component domains obtained by cryo-EM and AlphaFold243,44prediction as well as 57 unique DSSO cross-links. Integrative modeling proceeded through the standard four stages38–41,77: (1) gathering data; (2) representing subunits and translating data into spatial restraints; (3) structural sampling to produce an ensemble of models that satisfies the restraints; and (4) analyzing and validating the ensemble models as well as input information. The modeling protocol was scripted using the Python Modeling Interface package, a library for modeling macromolecular complexes based on our open-source Integrative Modeling Platform (IMP) package45 (https://integrativemodeling.org). Files containing the input data, scripts, and output results are freely available at https://github.com/integrativemodeling/Pks13. The details about the approach are given in Table S4.
Extended Data
Extended Data Fig. 1. Purification of native Pks13 from mycobacteria.
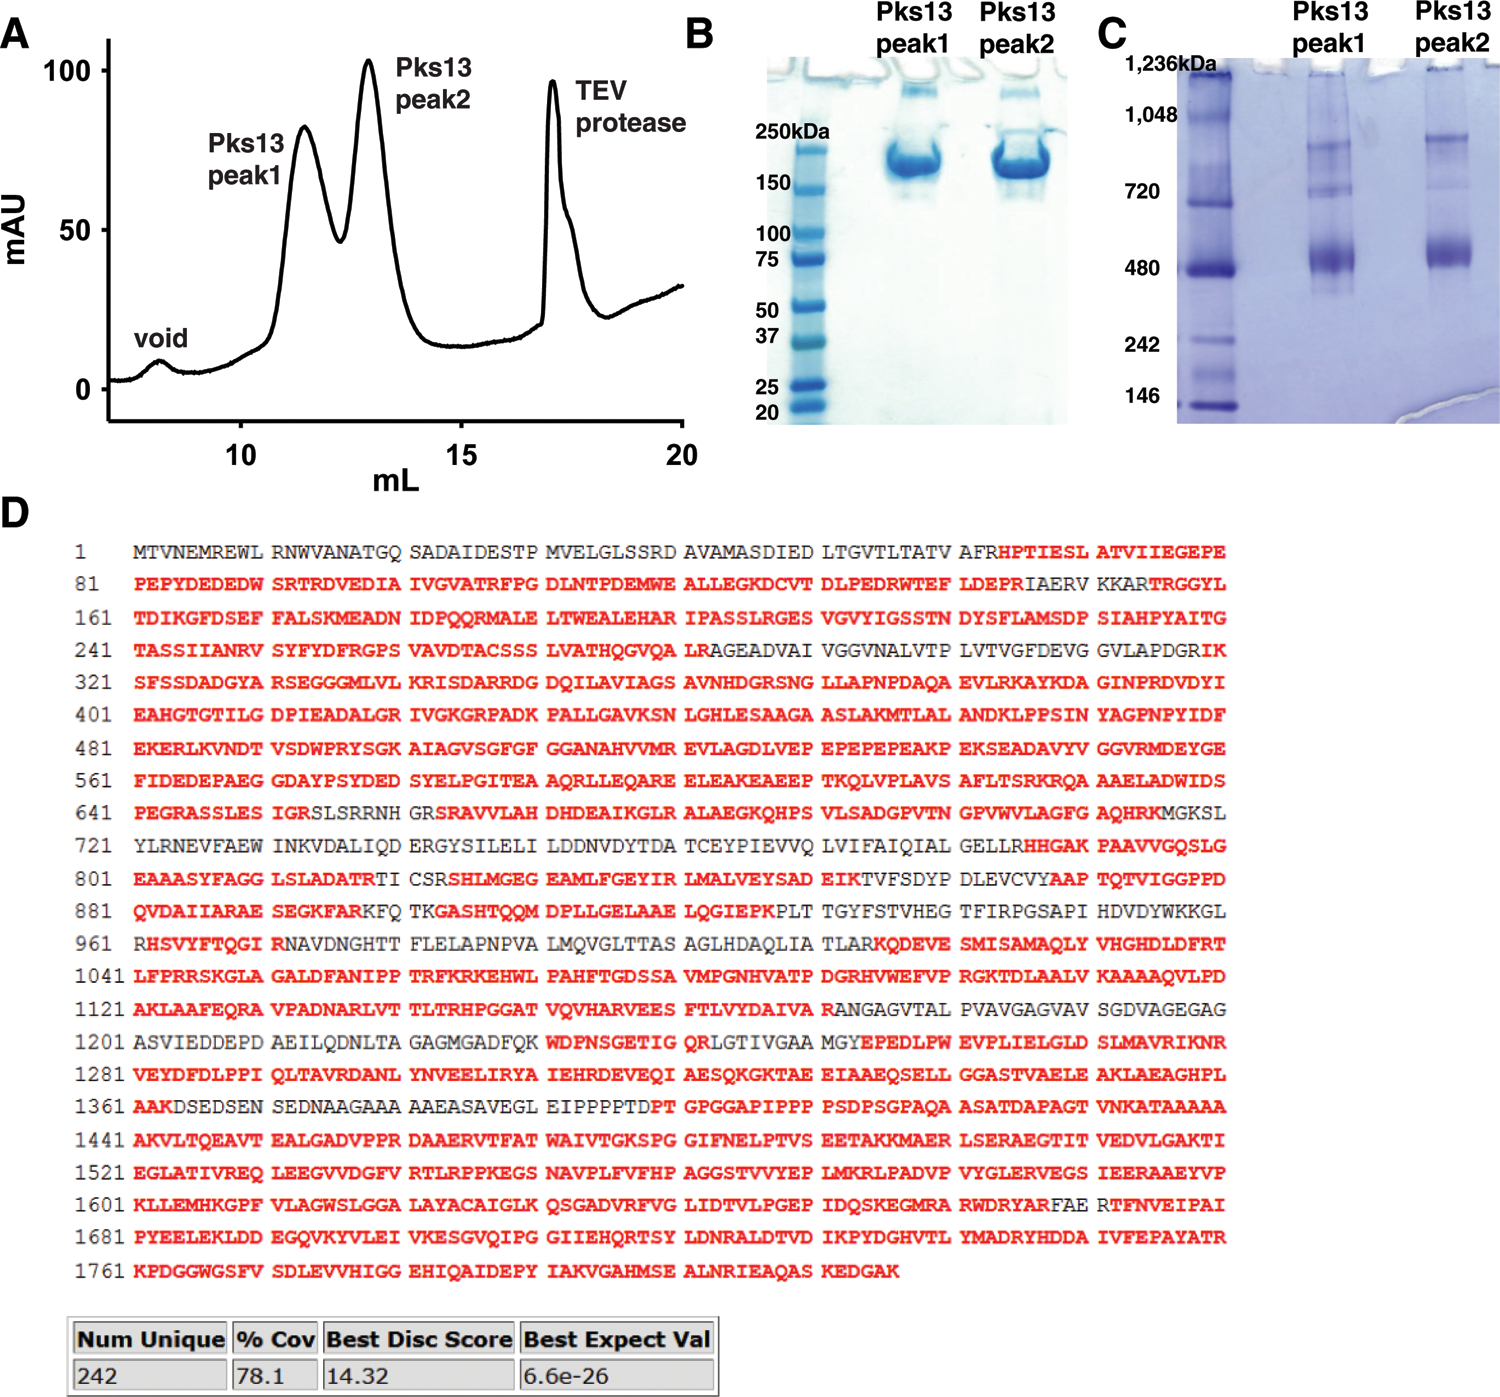
(A) Final Superose 6 size exclusion chromatography profile of Pks13. Two peaks containing Pks13 are labeled 1 and 2, in addition to the void peak and peak containing TEV protease. Pks13 peaks were run on non-reducing SDS-PAGE (Biorad #4561096) (B) and blue native PAGE (Invitrogen #BN1004BOX) (C), which were repeated twice with similar results. In SDS-PAGE (B) the protein runs at ~198 kDa, as expected for a protomer of Pks13. Blue native PAGE (C) indicates that majority of the protein is in a dimeric form, and higher oligomeric forms are present. Upon screening both peaks 1 and 2 on gold Quantifoil grids by cryoEM, peak 1 was selected for data collection since it produced more monodisperse particles that correspond to Pks13 dimers. We conclude that the Pks13 dimers associate loosely in solution, and that these readily dissociate to form monodisperse Pks13 dimers under the conditions in which the images were acquired. (D) 78.1% sequence coverage (highlighted red) by tryptic digested Pks13 fragments run on LC-MS-MS.
Extended Data Fig. 2. DE-rich linker.
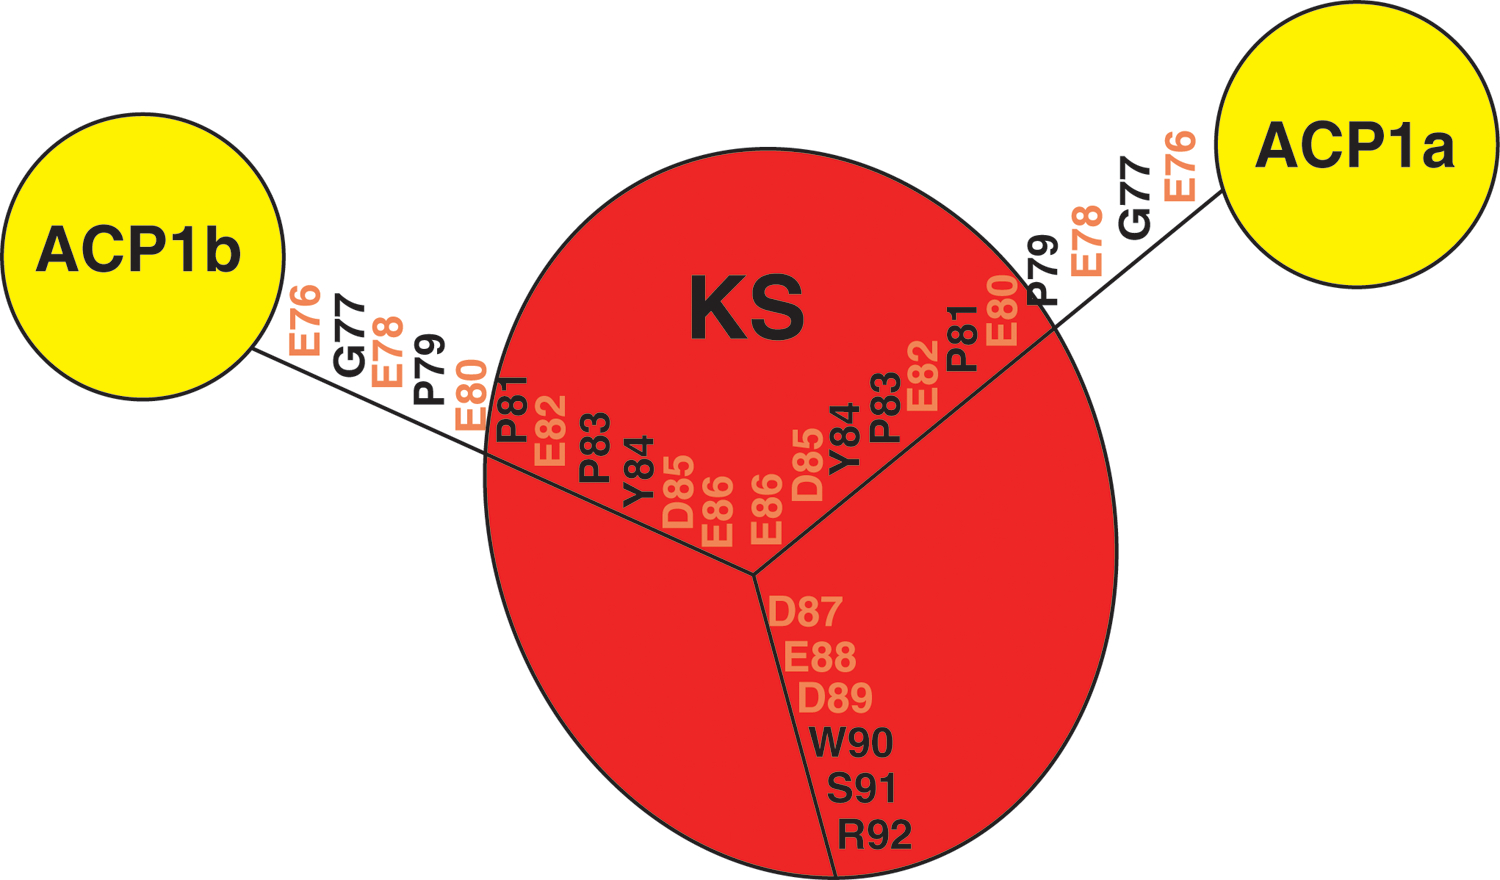
17 amino acid linking sequence (E76–92) between ACP1 and KS includes nine acidic amino acids (colored orange) and termed the “DE-rich linker”. First 11 amino acids (E76-E86) lie near positively charged surfaces of two different regions on the KS monomer surface (Extended Fig 3). The last six amino acids (D87-R92) closely overlap in orientation between the ACP1a and ACP1b structures and interact electrostatically with the shared positively charged surface (Extended Fig 3).
Extended Data Fig. 3. Electrostatic surface rendering of ACP1-KS-AT domains.
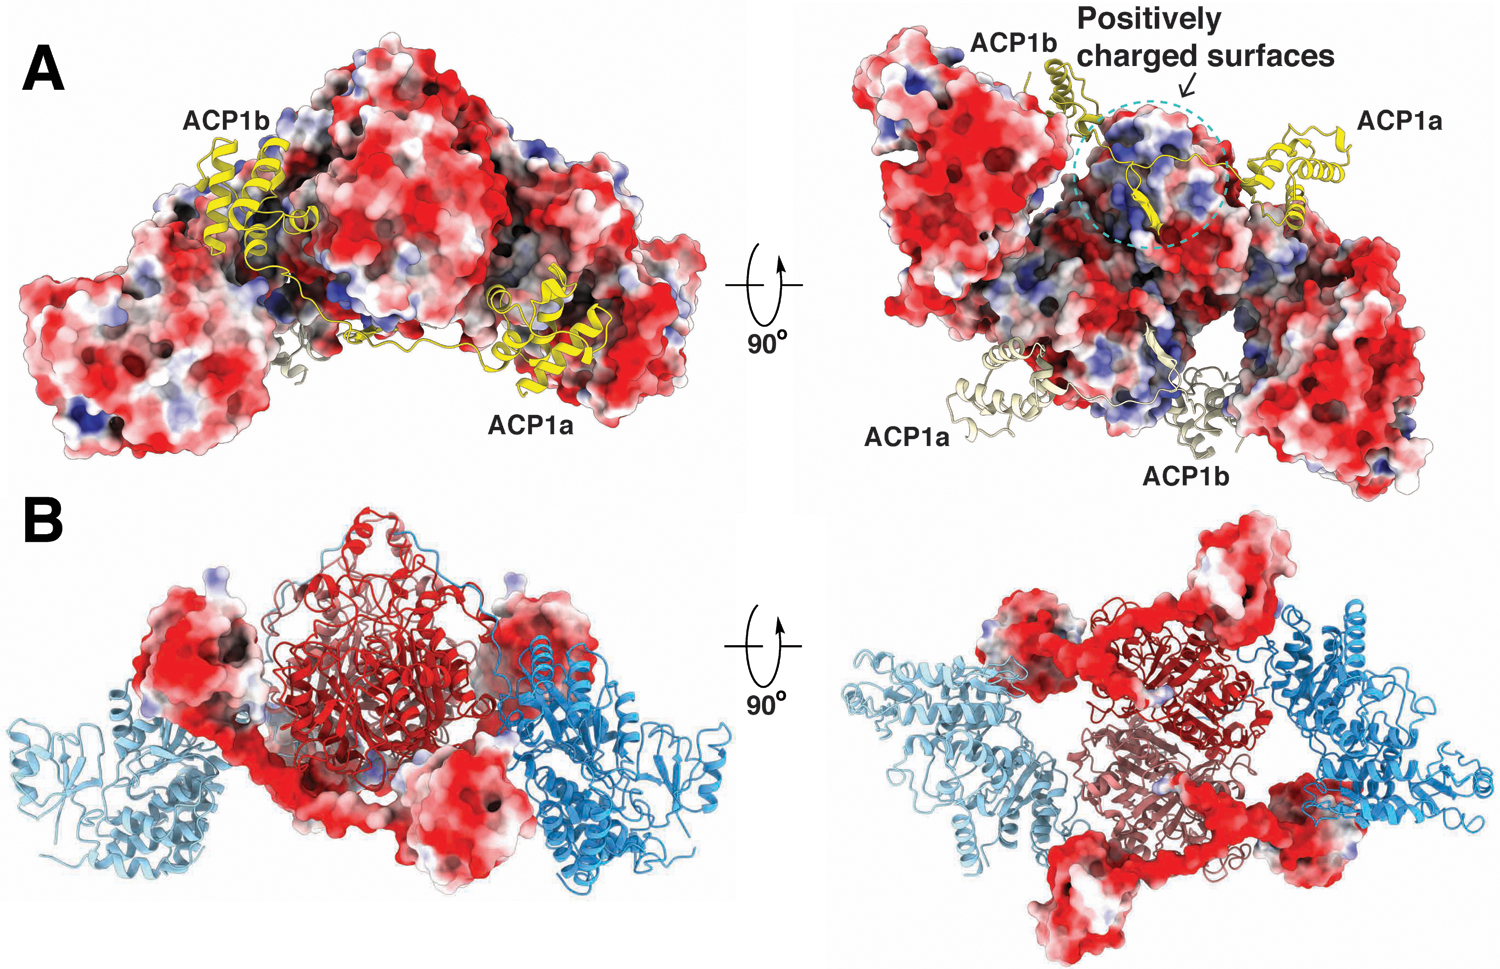
(A) The KS-AT surface is colored by electrostatic potential (red: acidic, blue: basic) of the residues. ACP1a and ACP1b and their ensuing linkers to the KS (yellow and lemon chiffon) are superimposed onto the KS-AT electrostatic potential surface, illustrating that the DE-rich linker lie near positively charged surfaces on the KS. (B) ACP1a, ACP1b, and the linkers to the KS are colored by electrostatic potential (red: acidic, blue: basic) of the residues. Model of KS-AT are superimposed onto the highly negative electrostatic potential surface of the DE-rich linker.
Extended Data Fig. 4. Interfacing residues between DE-rich linker and KS domain in ACP1a position.
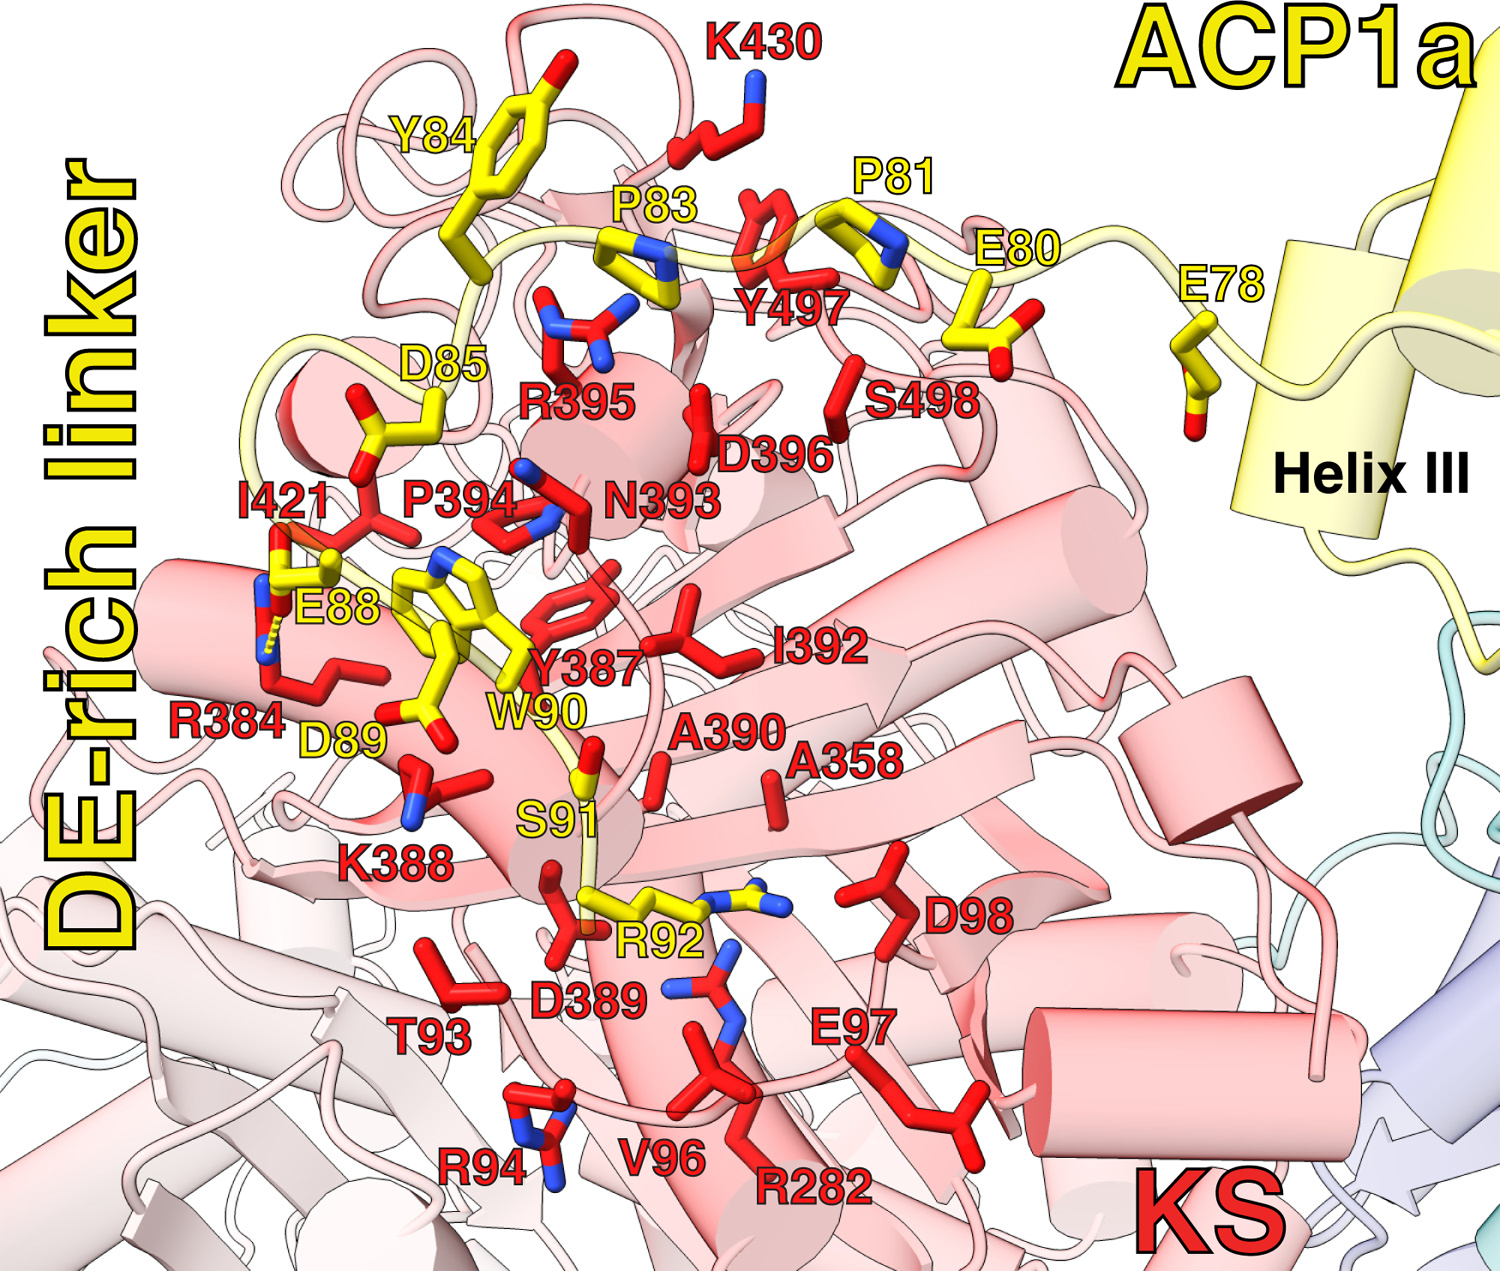
Interfacing residues were determined by PISA and labeled. Hydrogen bond between E88(OE2):R384(NH2) is represented with a yellow dotted line.
Extended Data Fig. 5. Interfacing residues between DE-rich linker and KS domain in ACP1b position.
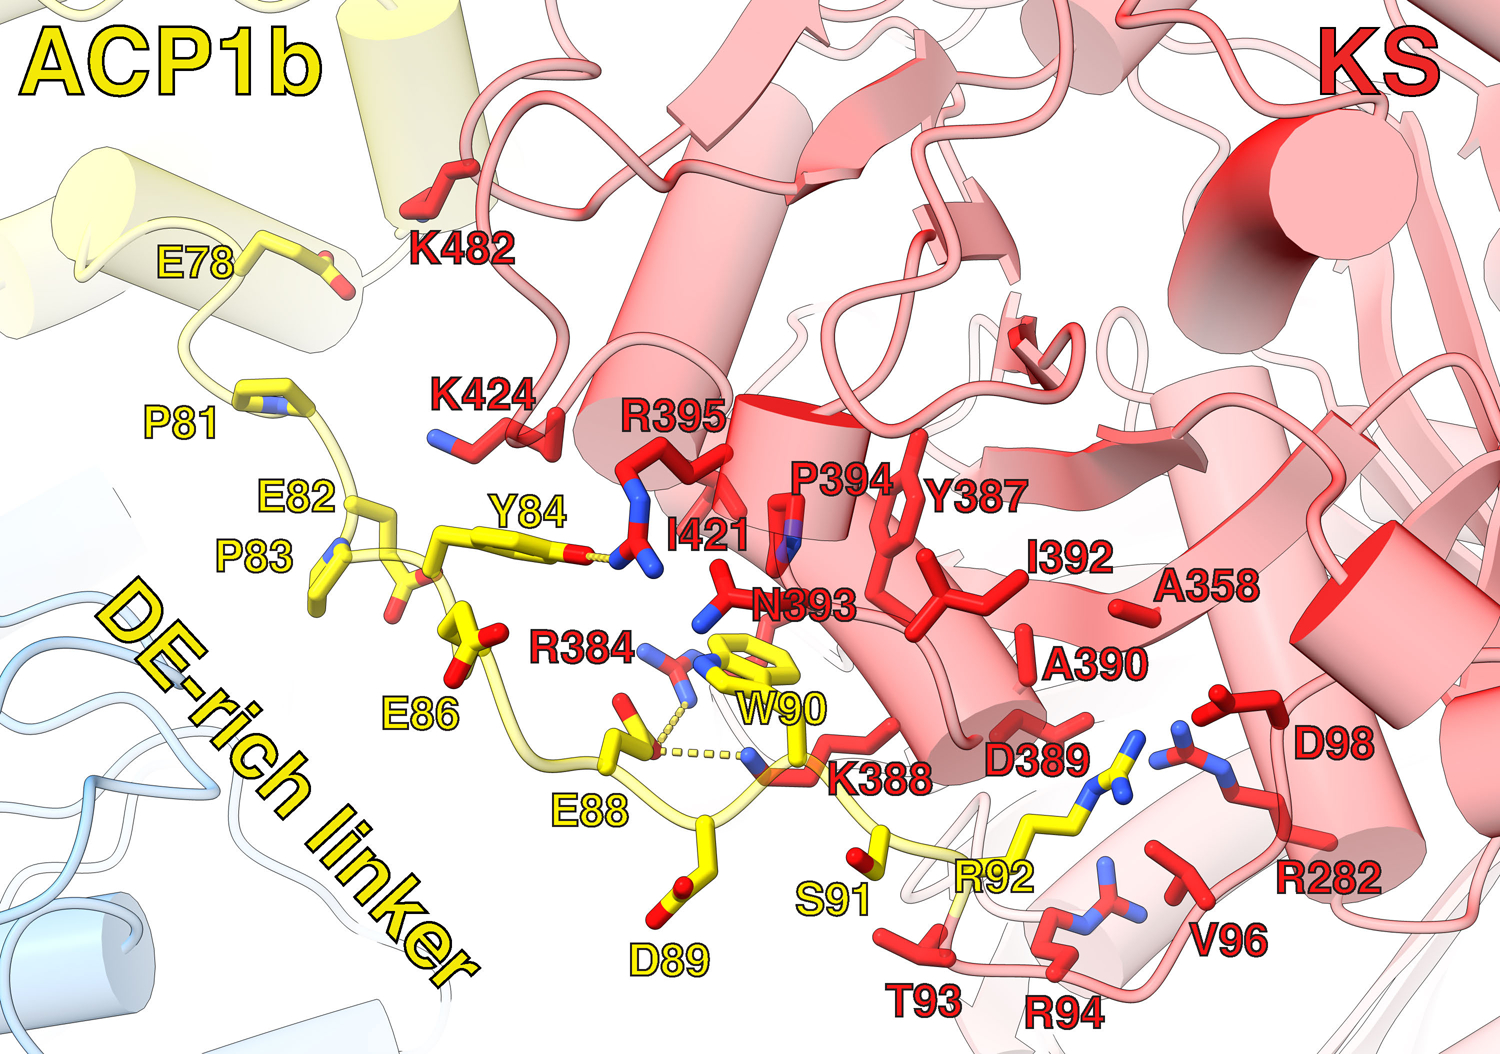
Interfacing residues were determined by PISA and labeled. Hydrogen bonds between Y84(OH):R395(NH1), E88(OE2):R384(NH1), and E88(OE2):K388(NZ) are labeled with yellow dotted lines.
Extended Data Fig. 6. ACP1a interaction with KS, KS-AT linker domain, and AT-ACP2 linker.
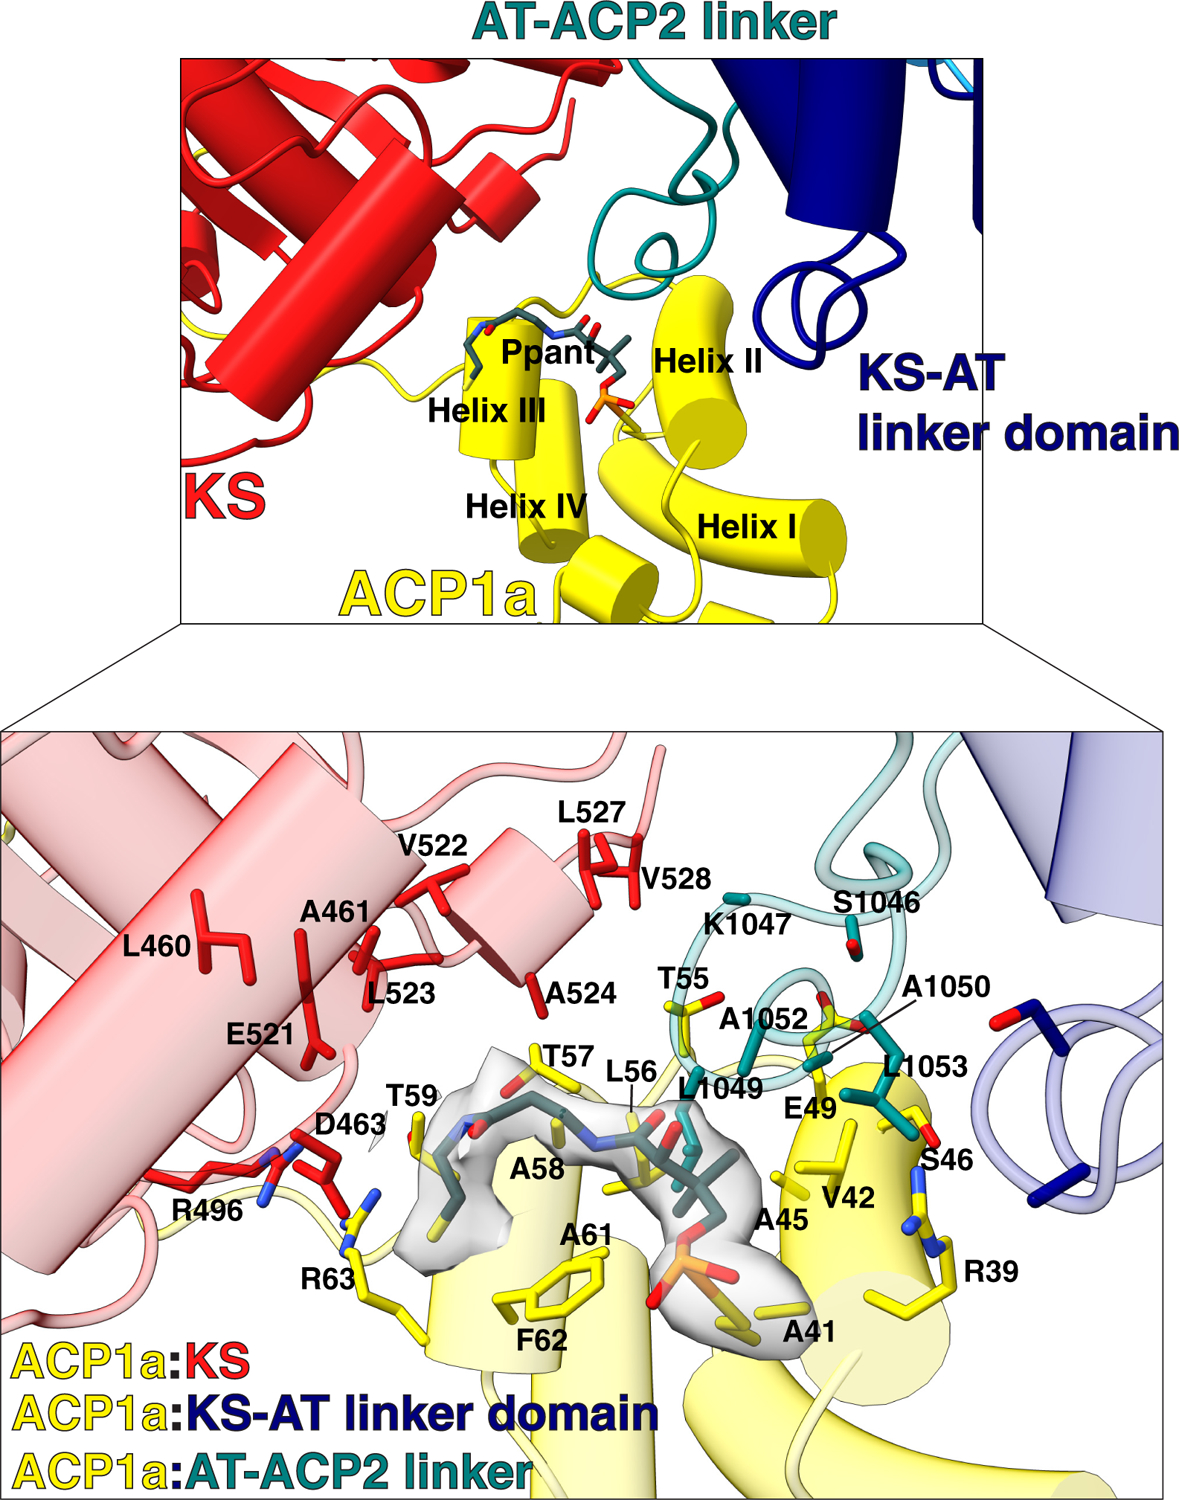
Interfacing residues between ACP1a and KS, KS-AT linker domain, and AT-ACP2 linker are shown as stick representation and labeled. Pi-pi stacking interaction is shown between R63 of ACP1a and R496 of KS. The Ppant arm is shown attached to S38 in helix II of ACP1a, and Ppant density is shown zoned around 2.3 Å around the model.
Extended Data Fig. 7. ACP1b interaction with KS and AT’.
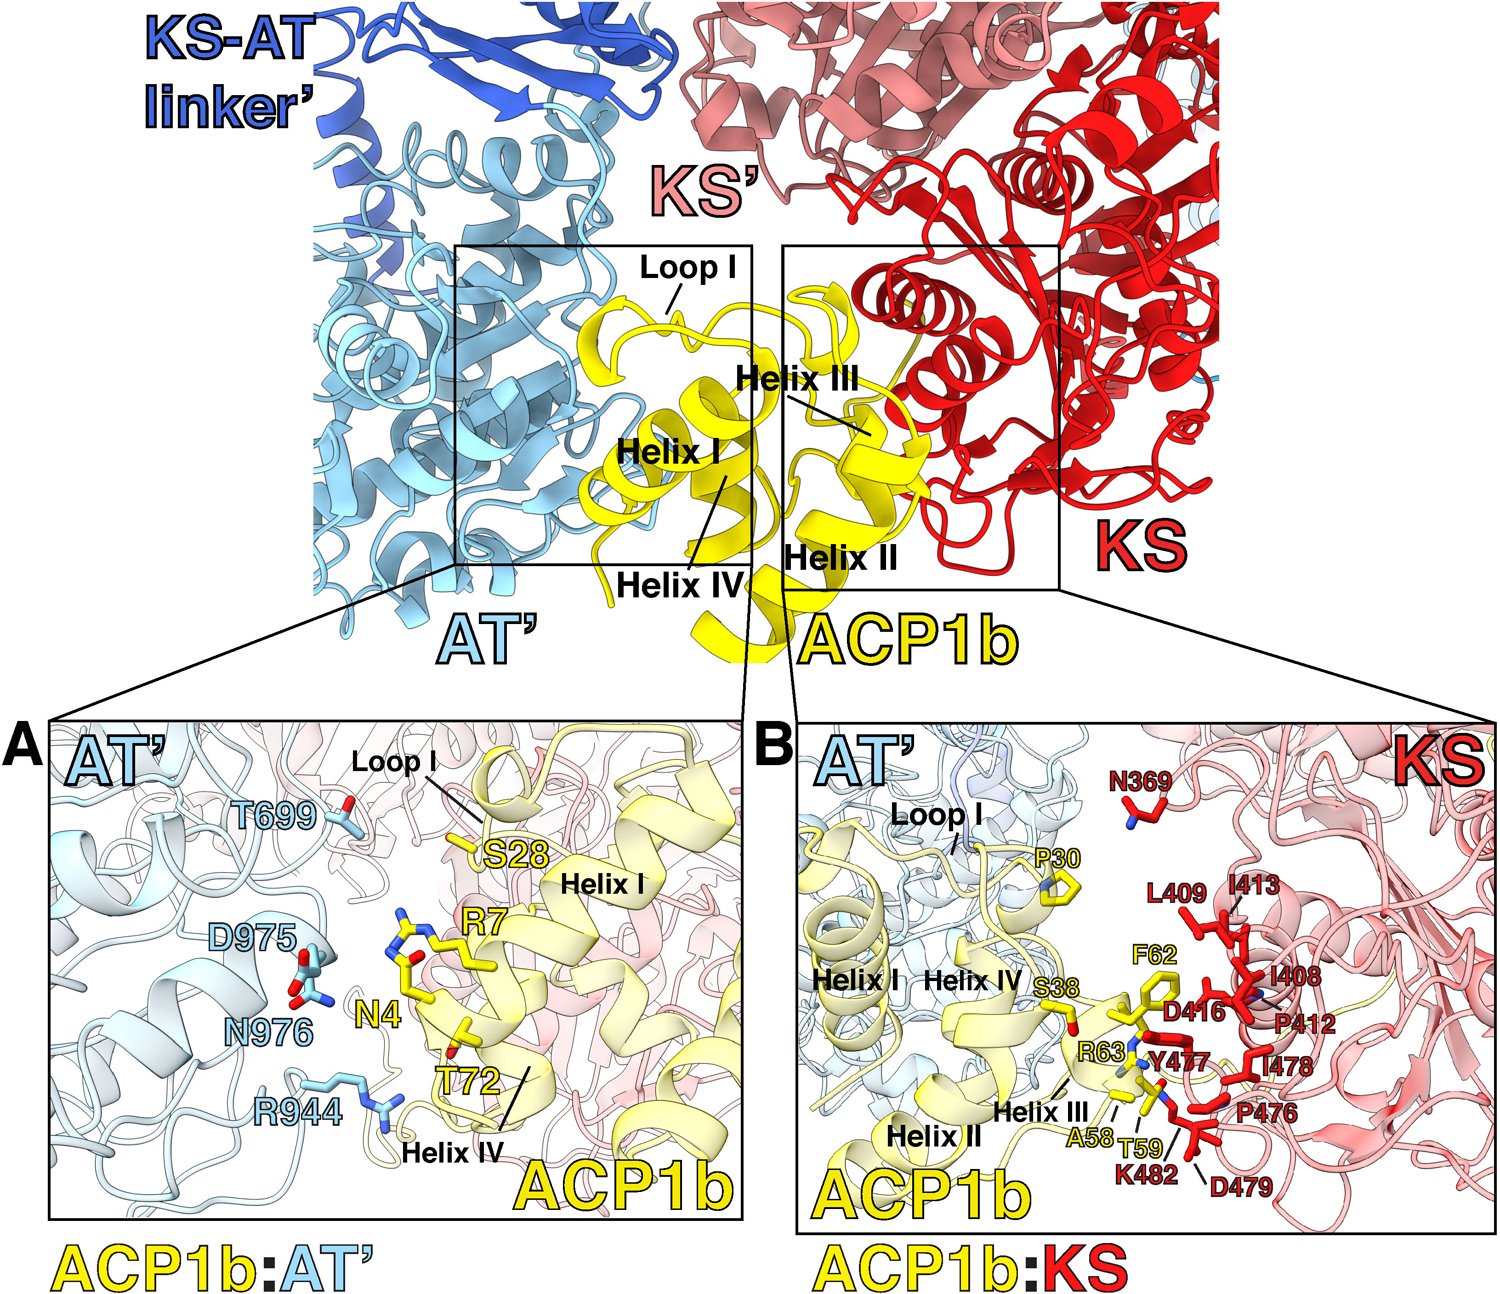
(A) ACP1b:AT’ interfacing residues’ side chains are shown and labeled, revealing a hydrophilic interface. (B) ACP1b:KS interfacing residues’ sidechains are shown and labeled, revealing a hydrophobic interface.
Extended Data Fig. 8. The active center of the AT domain shows the bound substrate interactions.
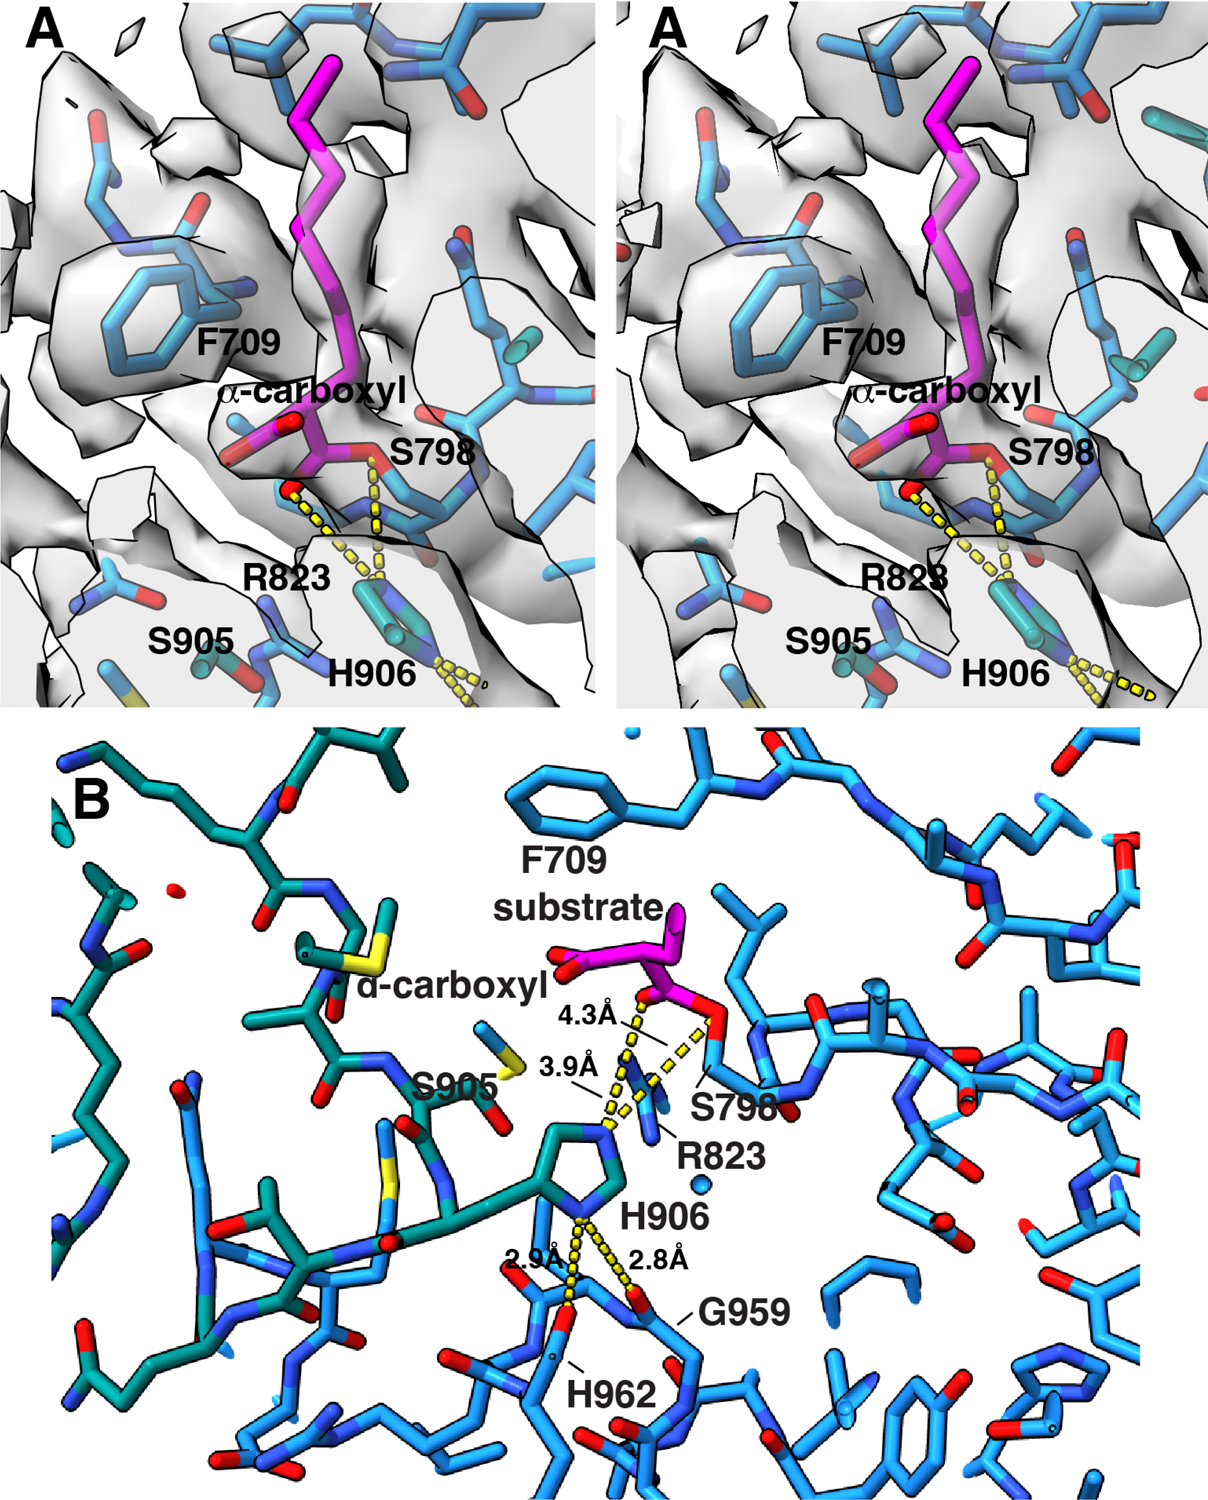
(A) Crossed-eyes stereo figure showing the density for the active site of the AT domain with substrate bound. The α-carboxyl group on the bound substrate is stabilized by a π-anion interaction with the phenyl ring of F709. (B) Rotated ~90° around the vertical axis and tilted forward from panel (A) shows interactions between the active center of the AT domain and the bound α-carboxy acyl substrate chain attached to S798. Distances between heavy atoms are tabulated in Å. The catalytic base H906 is ideally placed for the reaction at the γO of S798. The ester carbonyl on the substrate, and hence the oxyanion intermediate formed at that oxygen during the catalytic reaction may be stabilized by R823, H906, and S905. The H906 orientation is aligned by hydrogen bonds from the δN-H to the C=O of G959 and of H962.
Extended Data Fig. 9. Linkage map depicting all unique K-K linkages of DSSO cross-linked Pks13.
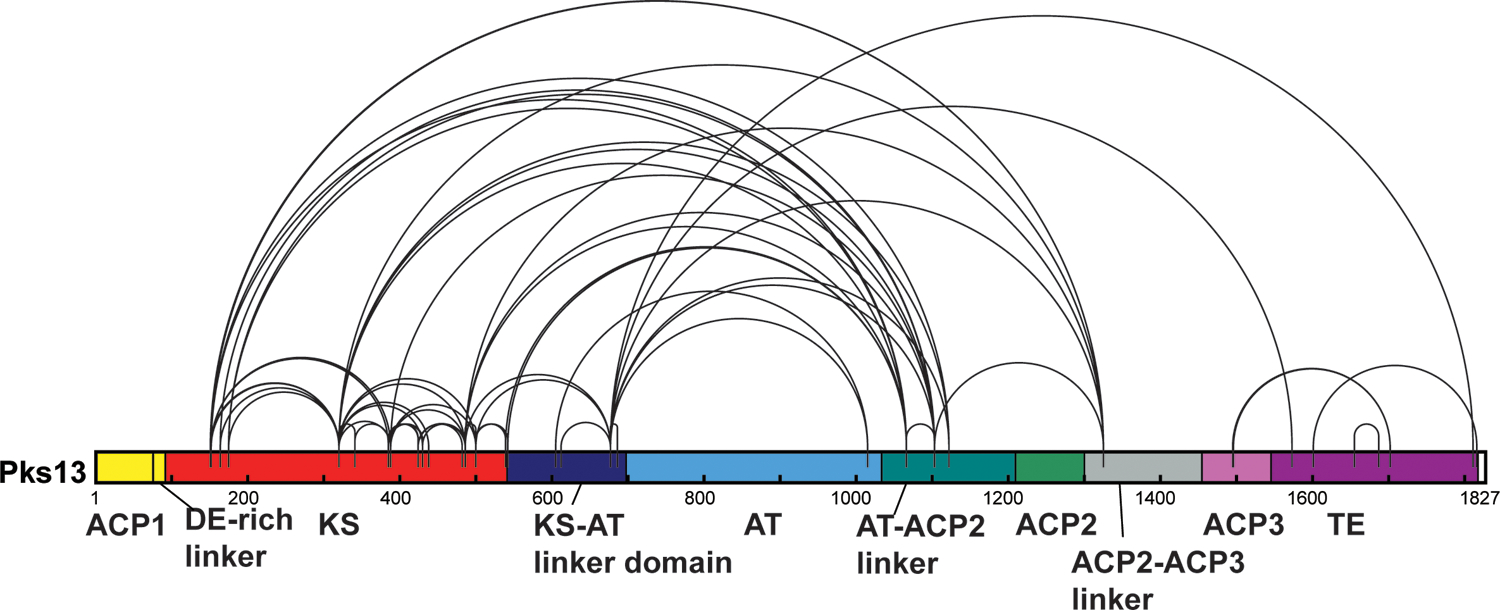
The 57 unique K-K inter-linked residues are summarized in this linkage map as black lines connecting two Pks13 lysine residues. Shown is a cartoon diagram of the primary sequence structure of Pks13 with domains labeled as in Fig 1A. The sequence numbers of lysine residues indicated by linear position in this figure are included in Tables S2, S3, S5, and S6.
Extended Data Fig. 10. Integrative structure modeling of the full-length Pks13 dimer.
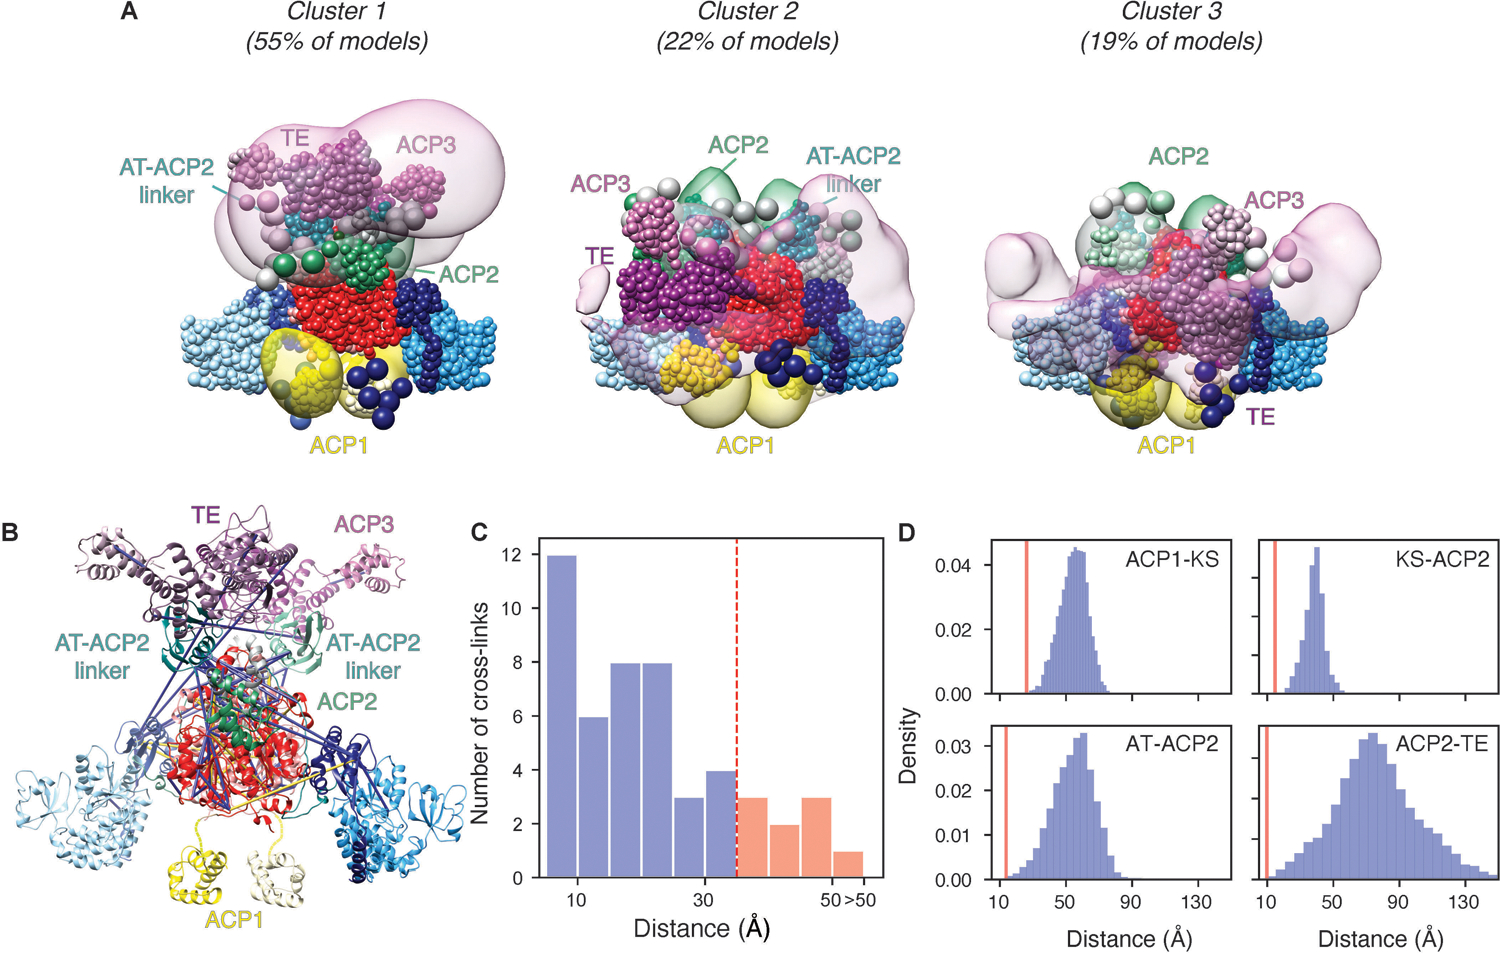
(A) The localization probability density of the ensemble of structures is shown with representative (centroid) structure from the ensemble embedded within it. The three panels represent different solutions with their relative percentages listed above. The structured and unstructured regions are represented as beads, using the same color scheme as Fig 1A. Regions with well-defined structures are modeled as rigid bodies consisting of beads representing each individual residue; the coordinates of a 1-residue bead were those of the corresponding Cα atom and represented. Regions with no available structure or flexible regions are represented as flexible strings of beads, corresponding to up to 10 residues per bead. (B) Detail of cross-links mapped to the centroid structure of the integrative model of the Pks13 dimer. Satisfied and violated cross-links shown in blue and yellow, respectively. A cross-link is classified as satisfied if the Cα–Cα distance spanned by the cross-linked residues in any of the models of the cluster is less than 35 Å. (C) Histogram showing the distribution of the cross-linked Cα–Cα distances in the Pks13 dimer integrative structures. (D) Histogram showing the Cα–Cα distances between the active sites of the ACP1-KS, AT-ACP2, KS-ACP2, and ACP2-TE domains. The shortest distances (red lines) are 26, 13.7, 14.8, and 9.7 Å between the ACP1-KS, AT-ACP2, KS-ACP2, and ACP2-TE domains, respectively.
Supplementary Material
Chem Draw data for Figure 1 Trehalose
Chem Draw data for Figure 1 Mechanism
Uncropped gel pictures
Supplementary Table 2 Summary of unique Pks13 inter-linked residues excluding files from highly cross-linked samples.
Supplementary Table 3 Metadata all DSSO cross-linked Pks13 XL-MS files.
Supplementary Table 6 Summary of all unique Pks13 inter-linked residues from the full dataset.
Supplementary Text, Figures S1-S13, Table S1, captions for Table S2, S3, Table S4, captions for Table S5, S6, Caption for Movie S1, Supplementary References.
Supplementary Table 5 Table with description and scores for overall DSSO cross-linked peptides for all processed files including inter-linked, mono-linked, and single peptides.
Supplementary Video 1 Relative positions of the ACP1, KS, AT domains, and substrates determined by cryoEM.
Acknowledgements:
We thank James Sacchettini, Texas A&M University for the inhibitor TAM16 and, Christopher Sassetti, University of Massachusetts Worcester for the Pks13-TEV-eGFP MSMEG strain and both for their insights, Adrian Keatinge-Clay and James Sacchettini for their reading of the manuscript, counsel and advice and Gary Ashley, ProLynx, Inc. for figure S1B. We acknowledge Paul Thomas, Matt Harrington, Joshua Baker-LePain and the Wynton HPC for computational support; and David Bulkley, Zanlin Yu and Glen Gilbert for their maintenance of the UCSF EM Core. We thank Jim Wilkins and Kathy Li for performing initial mass spectrometry for lipid identification in the UCSF mass spectrometry core.
Funding:
Research was supported by P01 AI095208 (Sacchettini), by GM24485 (Stroud) AI48366 (Guan), GM083960 & GM109824 (Sali), U19 A1135990 (Krogan) and R01 AI128214 (Rosenberg). MSD acknowledges an NSF graduate fellowship.
Competing interests:
The Krogan Laboratory has received research support from Vir Biotechnology, F. Hoffmann-La Roche, and Rezo Therapeutics. Nevan Krogan has financially compensated consulting agreements with the Icahn School of Medicine at Mount Sinai, New York, Maze Therapeutics, Interline Therapeutics, Rezo Therapeutics, GEn1E Lifesciences, Inc. and Twist Bioscience Corp. He is on the Board of Directors of Rezo Therapeutics and is a shareholder in Tenaya Therapeutics, Maze Therapeutics, Rezo Therapeutics, and Interline Therapeutics.
Data availability:
The atomic coordinates for five structures of Pks13 have been deposited in the Protein Data Bank with the accession codes 7UK4, 8CUY, 8CV1, 8CUZ, 8CV0. The corresponding maps have been deposited in the Electron Microscopy Data Bank with the accession codes EMD-26574, EMD-27002, EMD27005, EMD-27003, and EMD-27004. Proteomics data have been deposited to the ProteomeXchange Consortium with the dataset identifier PXD033471. Files containing the input data, scripts, and output results for integrative modeling are freely available at https://github.com/integrativemodeling/Pks13. The details about the approach are given in Table S4.
References
- 1.Global Tuberculosis Report 2021. (World Health Organization, 2021). [Google Scholar]
- 2.Zuber B et al. Direct visualization of the outer membrane of mycobacteria and corynebacteria in their native state. J. Bacteriol 190, 5672–5680 (2008). [DOI] [PMC free article] [PubMed] [Google Scholar]
- 3.Hoffmann C, Leis A, Niederweis M, Plitzko JM & Engelhardt H Disclosure of the mycobacterial outer membrane: cryo-electron tomography and vitreous sections reveal the lipid bilayer structure. Proc. Natl. Acad. Sci. USA 105, 3963–3967 (2008). [DOI] [PMC free article] [PubMed] [Google Scholar]
- 4.Sani M et al. Direct visualization by cryo-EM of the mycobacterial capsular layer: a labile structure containing ESX-1-secreted proteins. PLoS Pathog. 6, e1000794 (2010). [DOI] [PMC free article] [PubMed] [Google Scholar]
- 5.Grzegorzewicz AE et al. Inhibition of mycolic acid transport across the Mycobacterium tuberculosis plasma membrane. Nat. Chem. Biol 8, 334–341 (2012). [DOI] [PMC free article] [PubMed] [Google Scholar]
- 6.Harding E WHO global progress report on tuberculosis elimination. Lancet Respir. Med 8, 19 (2020). [DOI] [PubMed] [Google Scholar]
- 7.Ioerger TR et al. Identification of new drug targets and resistance mechanisms in Mycobacterium tuberculosis. PLoS One 8, e75245 (2013). [DOI] [PMC free article] [PubMed] [Google Scholar]
- 8.Sacchettini JC, Rubin EJ & Freundlich JS Drugs versus bugs: in pursuit of the persistent predator Mycobacterium tuberculosis. Nat. Rev. Microbiol 6, 41–52 (2008). [DOI] [PubMed] [Google Scholar]
- 9.Portevin D et al. A polyketide synthase catalyzes the last condensation step of mycolic acid biosynthesis in mycobacteria and related organisms. Proc. Natl. Acad. Sci. USA 101, 314–319 (2004). [DOI] [PMC free article] [PubMed] [Google Scholar]
- 10.Gavalda S et al. The Pks13/FadD32 crosstalk for the biosynthesis of mycolic acids in Mycobacterium tuberculosis. J. Biol. Chem 284, 19255–19264 (2009). [DOI] [PMC free article] [PubMed] [Google Scholar]
- 11.Trivedi OA et al. Enzymic activation and transfer of fatty acids as acyl-adenylates in mycobacteria. Nature 428, 441–445 (2004). [DOI] [PubMed] [Google Scholar]
- 12.Léger M et al. The dual function of the Mycobacterium tuberculosis FadD32 required for mycolic acid biosynthesis. Chem. Biol 16, 510–519 (2009). [DOI] [PubMed] [Google Scholar]
- 13.Marrakchi H, Lanéelle M-A & Daffé M Mycolic acids: structures, biosynthesis, and beyond. Chem. Biol 21, 67–85 (2014). [DOI] [PubMed] [Google Scholar]
- 14.Herbst DA et al. The structural organization of substrate loading in iterative polyketide synthases. Nat. Chem. Biol 14, 474–479 (2018). [DOI] [PMC free article] [PubMed] [Google Scholar]
- 15.Khosla C From active sites to machines: A challenge for enzyme chemists. Isr J Chem 59, 37–40 (2019). [DOI] [PMC free article] [PubMed] [Google Scholar]
- 16.Meniche X et al. Subpolar addition of new cell wall is directed by DivIVA in mycobacteria. Proc. Natl. Acad. Sci. U. S. A 111, E3243–51 (2014). [DOI] [PMC free article] [PubMed] [Google Scholar]
- 17.Aggarwal A et al. Development of a Novel Lead that Targets M. tuberculosis Polyketide Synthase 13. Cell 170, 249–259.e25 (2017). [DOI] [PMC free article] [PubMed] [Google Scholar]
- 18.Pan H et al. Crystal structure of the priming beta-ketosynthase from the R1128 polyketide biosynthetic pathway. Structure 10, 1559–1568 (2002). [DOI] [PubMed] [Google Scholar]
- 19.Tang Y, Kim C-Y, Mathews II, Cane DE & Khosla C The 2.7-Angstrom crystal structure of a 194-kDa homodimeric fragment of the 6-deoxyerythronolide B synthase. Proc. Natl. Acad. Sci. USA 103, 11124–11129 (2006). [DOI] [PMC free article] [PubMed] [Google Scholar]
- 20.Barry CE et al. Mycolic acids: structure, biosynthesis and physiological functions. Prog. Lipid Res 37, 143–179 (1998). [DOI] [PubMed] [Google Scholar]
- 21.Byers DM & Gong H Acyl carrier protein: structure-function relationships in a conserved multifunctional protein family. Biochem Cell Biol 85, 649–662 (2007). [DOI] [PubMed] [Google Scholar]
- 22.Robbins T, Kapilivsky J, Cane DE & Khosla C Roles of conserved active site residues in the ketosynthase domain of an assembly line polyketide synthase. Biochemistry 55, 4476–4484 (2016). [DOI] [PMC free article] [PubMed] [Google Scholar]
- 23.Pintilie G et al. Measurement of atom resolvability in cryo-EM maps with Q-scores. Nat. Methods 17, 328–334 (2020). [DOI] [PMC free article] [PubMed] [Google Scholar]
- 24.Klaus M et al. Protein-Protein Interactions, Not Substrate Recognition, Dominate the Turnover of Chimeric Assembly Line Polyketide Synthases. J. Biol. Chem 291, 16404–16415 (2016). [DOI] [PMC free article] [PubMed] [Google Scholar]
- 25.Krissinel E & Henrick K Inference of macromolecular assemblies from crystalline state. J. Mol. Biol 372, 774–797 (2007). [DOI] [PubMed] [Google Scholar]
- 26.Berman HM et al. The protein data bank. Nucleic Acids Res. 28, 235–242 (2000). [DOI] [PMC free article] [PubMed] [Google Scholar]
- 27.Vernon RM et al. Pi-Pi contacts are an overlooked protein feature relevant to phase separation. Elife 7, (2018). [DOI] [PMC free article] [PubMed] [Google Scholar]
- 28.Lee D, Lee J & Seok C What stabilizes close arginine pairing in proteins? Phys. Chem. Chem. Phys 15, 5844–5853 (2013). [DOI] [PubMed] [Google Scholar]
- 29.Bergeret F et al. Biochemical and structural study of the atypical acyltransferase domain from the mycobacterial polyketide synthase Pks13. J. Biol. Chem 287, 33675–33690 (2012). [DOI] [PMC free article] [PubMed] [Google Scholar]
- 30.Gande R et al. Acyl-CoA carboxylases (accD2 and accD3), together with a unique polyketide synthase (Cg-pks), are key to mycolic acid biosynthesis in Corynebacterianeae such as Corynebacterium glutamicum and Mycobacterium tuberculosis. J. Biol. Chem 279, 44847–44857 (2004). [DOI] [PubMed] [Google Scholar]
- 31.Lucas X, Bauzá A, Frontera A & Quiñonero D A thorough anion-π interaction study in biomolecules: on the importance of cooperativity effects. Chem. Sci 7, 1038–1050 (2016). [DOI] [PMC free article] [PubMed] [Google Scholar]
- 32.Bon C et al. Solution structure of the type I polyketide synthase Pks13 from Mycobacterium tuberculosis. BMC Biol. 20, 147 (2022). [DOI] [PMC free article] [PubMed] [Google Scholar]
- 33.George KM, Yuan Y, Sherman DR & Barry CE The biosynthesis of cyclopropanated mycolic acids in Mycobacterium tuberculosis. Identification and functional analysis of CMAS-2. J. Biol. Chem 270, 27292–27298 (1995). [DOI] [PubMed] [Google Scholar]
- 34.Yuan Y & Barry CE A common mechanism for the biosynthesis of methoxy and cyclopropyl mycolic acids in Mycobacterium tuberculosis. Proc. Natl. Acad. Sci. USA 93, 12828–12833 (1996). [DOI] [PMC free article] [PubMed] [Google Scholar]
- 35.Piersimoni L & Sinz A Cross-linking/mass spectrometry at the crossroads. Anal. Bioanal. Chem 412, 5981–5987 (2020). [DOI] [PMC free article] [PubMed] [Google Scholar]
- 36.Kaake RM et al. A new in vivo cross-linking mass spectrometry platform to define protein-protein interactions in living cells. Mol. Cell Proteomics 13, 3533–3543 (2014). [DOI] [PMC free article] [PubMed] [Google Scholar]
- 37.Merkley ED et al. Distance restraints from crosslinking mass spectrometry: mining a molecular dynamics simulation database to evaluate lysine-lysine distances. Protein Sci. 23, 747–759 (2014). [DOI] [PMC free article] [PubMed] [Google Scholar]
- 38.Kaake RM et al. Characterization of an A3G-VifHIV-1-CRL5-CBFβ Structure Using a Cross-linking Mass Spectrometry Pipeline for Integrative Modeling of Host-Pathogen Complexes. Mol. Cell Proteomics 20, 100132 (2021). [DOI] [PMC free article] [PubMed] [Google Scholar]
- 39.Sali A From integrative structural biology to cell biology. J. Biol. Chem 296, 100743 (2021). [DOI] [PMC free article] [PubMed] [Google Scholar]
- 40.Saltzberg DJ et al. Using Integrative Modeling Platform to compute, validate, and archive a model of a protein complex structure. Protein Sci. 30, 250–261 (2021). [DOI] [PMC free article] [PubMed] [Google Scholar]
- 41.Saltzberg D et al. Modeling biological complexes using integrative modeling platform. Methods Mol. Biol 2022, 353–377 (2019). [DOI] [PubMed] [Google Scholar]
- 42.Kim SJ et al. Integrative structure and functional anatomy of a nuclear pore complex. Nature 555, 475–482 (2018). [DOI] [PMC free article] [PubMed] [Google Scholar]
- 43.Jumper J et al. Highly accurate protein structure prediction with AlphaFold. Nature 596, 583–589 (2021). [DOI] [PMC free article] [PubMed] [Google Scholar]
- 44.Varadi M et al. AlphaFold Protein Structure Database: massively expanding the structural coverage of protein-sequence space with high-accuracy models. Nucleic Acids Res. 50, D439–D444 (2022). [DOI] [PMC free article] [PubMed] [Google Scholar]
- 45.Russel D et al. Putting the pieces together: integrative modeling platform software for structure determination of macromolecular assemblies. PLoS Biol. 10, e1001244 (2012). [DOI] [PMC free article] [PubMed] [Google Scholar]
- 46.Tsai SC et al. Crystal Structure of the Macrocycle-forming Thioesterase Domain of Erythromycin Polyketide Synthase (DEBS TE). (2002). [DOI] [PMC free article] [PubMed]
- 47.Gokulan K, Aggarwal A, Shipman L, Besra GS & Sacchettini JC Mycobacterium tuberculosis acyl carrier protein synthase adopts two different pH-dependent structural conformations. Acta Crystallogr. Sect. D, Biol. Crystallogr 67, 657–669 (2011). [DOI] [PMC free article] [PubMed] [Google Scholar]
- 48.Keatinge-Clay AT et al. Catalysis, specificity, and ACP docking site of Streptomyces coelicolor malonyl-CoA:ACP transacylase. Structure 11, 147–154 (2003). [DOI] [PubMed] [Google Scholar]
- 49.Tsai S-C, Lu H, Cane DE, Khosla C & Stroud RM Insights into Channel Architecture and Substrate Specificity from Crystal Structures of Two Macrocycle-Forming Thioesterases of Modular Polyketide Synthases† , ‡. Biochemistry 41, 12598–12606 (2002). [DOI] [PubMed] [Google Scholar]
- 50.Mindrebo JT et al. Gating mechanism of elongating β-ketoacyl-ACP synthases. Nat. Commun 11, 1727 (2020). [DOI] [PMC free article] [PubMed] [Google Scholar]
- 51.Portevin D et al. The acyl-AMP ligase FadD32 and AccD4-containing acyl-CoA carboxylase are required for the synthesis of mycolic acids and essential for mycobacterial growth: identification of the carboxylation product and determination of the acyl-CoA carboxylase components. J. Biol. Chem 280, 8862–8874 (2005). [DOI] [PubMed] [Google Scholar]
- 52.La Rosa V et al. MmpL3 is the cellular target of the antitubercular pyrrole derivative BM212. Antimicrob. Agents Chemother 56, 324–331 (2012). [DOI] [PMC free article] [PubMed] [Google Scholar]
- 53.Poce G et al. Improved BM212 MmpL3 inhibitor analogue shows efficacy in acute murine model of tuberculosis infection. PLoS One 8, e56980 (2013). [DOI] [PMC free article] [PubMed] [Google Scholar]
- 54.LaCava J, Jiang H & Rout MP Protein Complex Affinity Capture from Cryomilled Mammalian Cells. J. Vis. Exp (2016). doi:http://10.3791/54518 [DOI] [PMC free article] [PubMed] [Google Scholar]
- 55.Zheng SQ et al. MotionCor2: anisotropic correction of beam-induced motion for improved cryo-electron microscopy. Nat. Methods 14, 331–332 (2017). [DOI] [PMC free article] [PubMed] [Google Scholar]
- 56.Punjani A, Rubinstein JL, Fleet DJ & Brubaker MA cryoSPARC: algorithms for rapid unsupervised cryo-EM structure determination. Nat. Methods 14, 290–296 (2017). [DOI] [PubMed] [Google Scholar]
- 57.Grant T, Rohou A & Grigorieff N cisTEM, user-friendly software for single-particle image processing. Elife 7, e35383 (2018). [DOI] [PMC free article] [PubMed] [Google Scholar]
- 58.Terwilliger TC, Ludtke SJ, Read RJ, Adams PD & Afonine PV Improvement of cryo-EM maps by density modification. Nat. Methods 17, 923–927 (2020). [DOI] [PMC free article] [PubMed] [Google Scholar]
- 59.Afonine PV et al. Real-space refinement in Phenix for cryo-EM and crystallography. BioRxiv (2018). doi:http://10.1101/249607 [DOI] [PMC free article] [PubMed] [Google Scholar]
- 60.Zivanov J et al. New tools for automated high-resolution cryo-EM structure determination in RELION-3. Elife 7, (2018). [DOI] [PMC free article] [PubMed] [Google Scholar]
- 61.Pettersen EF et al. UCSF Chimera—a visualization system for exploratory research and analysis. J. Comput. Chem 25, 1605–1612 (2004). [DOI] [PubMed] [Google Scholar]
- 62.Goddard TD et al. UCSF ChimeraX: Meeting modern challenges in visualization and analysis. Protein Sci. 27, 14–25 (2018). [DOI] [PMC free article] [PubMed] [Google Scholar]
- 63.Terwilliger TC, Sobolev OV, Afonine PV & Adams PD Automated map sharpening by maximization of detail and connectivity. Acta Crystallogr. D Struct. Biol 74, 545–559 (2018). [DOI] [PMC free article] [PubMed] [Google Scholar]
- 64.Sanchez-Garcia R et al. DeepEMhancer: a deep learning solution for cryo-EM volume post-processing. Commun. Biol 4, 874 (2021). [DOI] [PMC free article] [PubMed] [Google Scholar]
- 65.Kelley LA, Mezulis S, Yates CM, Wass MN & Sternberg MJE The Phyre2 web portal for protein modeling, prediction and analysis. Nat. Protoc 10, 845–858 (2015). [DOI] [PMC free article] [PubMed] [Google Scholar]
- 66.Emsley P, Lohkamp B, Scott WG & Cowtan K Features and development of Coot. Acta Crystallogr. Sect. D, Biol. Crystallogr 66, 486–501 (2010). [DOI] [PMC free article] [PubMed] [Google Scholar]
- 67.Croll TI ISOLDE: a physically realistic environment for model building into low-resolution electron-density maps. Acta Crystallogr. D Struct. Biol 74, 519–530 (2018). [DOI] [PMC free article] [PubMed] [Google Scholar]
- 68.Afonine PV et al. Real-space refinement in PHENIX for cryo-EM and crystallography. Acta Crystallogr. D Struct. Biol 74, 531–544 (2018). [DOI] [PMC free article] [PubMed] [Google Scholar]
- 69.Pravda L et al. MOLEonline: a web-based tool for analyzing channels, tunnels and pores (2018 update). Nucleic Acids Res. 46, W368–W373 (2018). [DOI] [PMC free article] [PubMed] [Google Scholar]
- 70.Tan BK et al. Discovery of a cardiolipin synthase utilizing phosphatidylethanolamine and phosphatidylglycerol as substrates. Proc. Natl. Acad. Sci. USA 109, 16504–16509 (2012). [DOI] [PMC free article] [PubMed] [Google Scholar]
- 71.Kao A et al. Development of a novel cross-linking strategy for fast and accurate identification of cross-linked peptides of protein complexes. Mol. Cell Proteomics 10, M110.002212 (2011). [DOI] [PMC free article] [PubMed] [Google Scholar]
- 72.Chambers MC et al. A cross-platform toolkit for mass spectrometry and proteomics. Nat. Biotechnol 30, 918–920 (2012). [DOI] [PMC free article] [PubMed] [Google Scholar]
- 73.Kessner D, Chambers M, Burke R, Agus D & Mallick P ProteoWizard: open source software for rapid proteomics tools development. Bioinformatics 24, 2534–2536 (2008). [DOI] [PMC free article] [PubMed] [Google Scholar]
- 74.Perez-Riverol Y et al. The PRIDE database and related tools and resources in 2019: improving support for quantification data. Nucleic Acids Res. 47, D442–D450 (2019). [DOI] [PMC free article] [PubMed] [Google Scholar]
- 75.Baker PR & Chalkley RJ MS-viewer: a web-based spectral viewer for proteomics results. Mol. Cell Proteomics 13, 1392–1396 (2014). [DOI] [PMC free article] [PubMed] [Google Scholar]
- 76.Alber F et al. Determining the architectures of macromolecular assemblies. Nature 450, 683–694 (2007). [DOI] [PubMed] [Google Scholar]
- 77.Viswanath S, Chemmama IE, Cimermancic P & Sali A Assessing exhaustiveness of stochastic sampling for integrative modeling of macromolecular structures. Biophys. J 113, 2344–2353 (2017). [DOI] [PMC free article] [PubMed] [Google Scholar]
Associated Data
This section collects any data citations, data availability statements, or supplementary materials included in this article.
Supplementary Materials
Chem Draw data for Figure 1 Trehalose
Chem Draw data for Figure 1 Mechanism
Uncropped gel pictures
Supplementary Table 2 Summary of unique Pks13 inter-linked residues excluding files from highly cross-linked samples.
Supplementary Table 3 Metadata all DSSO cross-linked Pks13 XL-MS files.
Supplementary Table 6 Summary of all unique Pks13 inter-linked residues from the full dataset.
Supplementary Text, Figures S1-S13, Table S1, captions for Table S2, S3, Table S4, captions for Table S5, S6, Caption for Movie S1, Supplementary References.
Supplementary Table 5 Table with description and scores for overall DSSO cross-linked peptides for all processed files including inter-linked, mono-linked, and single peptides.
Supplementary Video 1 Relative positions of the ACP1, KS, AT domains, and substrates determined by cryoEM.
Data Availability Statement
The atomic coordinates for five structures of Pks13 have been deposited in the Protein Data Bank with the accession codes 7UK4, 8CUY, 8CV1, 8CUZ, 8CV0. The corresponding maps have been deposited in the Electron Microscopy Data Bank with the accession codes EMD-26574, EMD-27002, EMD27005, EMD-27003, and EMD-27004. Proteomics data have been deposited to the ProteomeXchange Consortium with the dataset identifier PXD033471. Files containing the input data, scripts, and output results for integrative modeling are freely available at https://github.com/integrativemodeling/Pks13. The details about the approach are given in Table S4.


