
Figure 2.
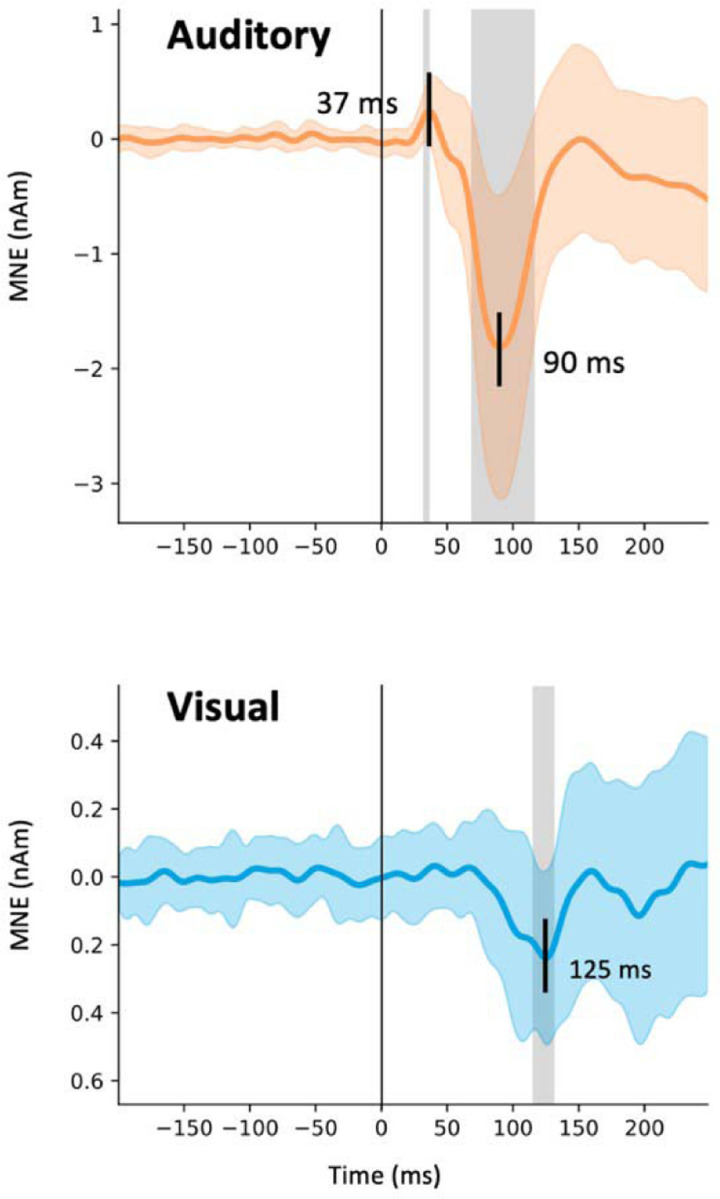
MEG source activity in the auditory cortex. The estimated source waveforms in response to the auditory (orange) and visual (blue) stimuli (mean and standard deviation across subjects, hemispheres, and experiments). Negative values correspond to inward cortical currents, i.e., pointing from the gray matter towards the white matter. The gray shading indicates time points that differing significantly from zero (t-test, p < 0.05, Bonferroni adjusted).