
Figure 4.
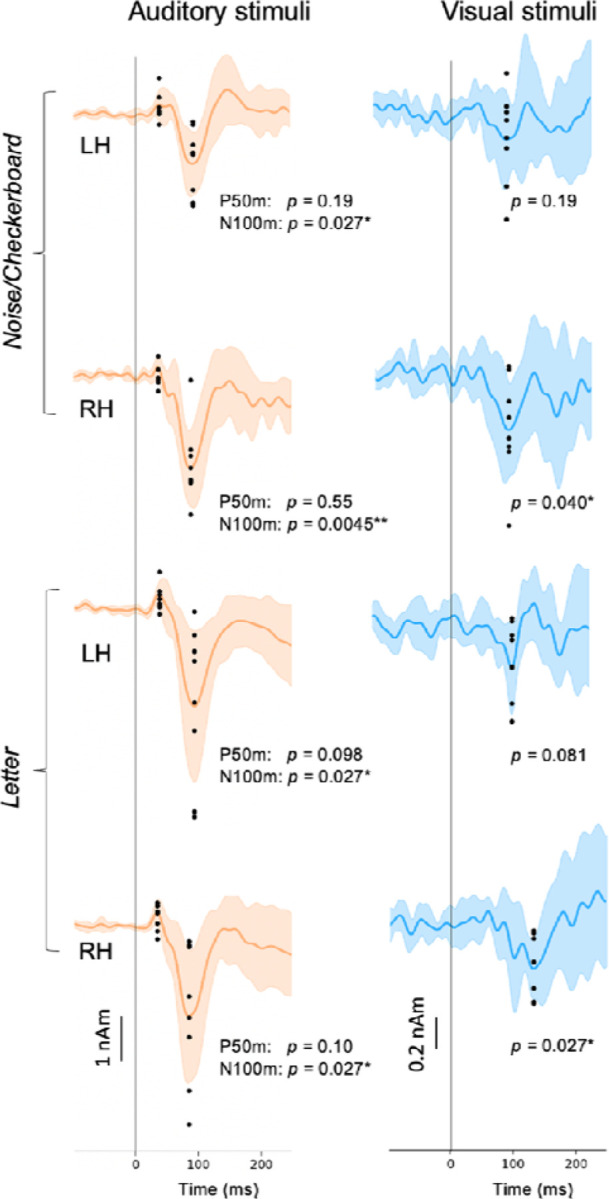
Variation of the estimated source waveforms among individual subjects. The p-values indicate the significance of the response magnitudes at the peak latencies (t-test; fdr adjusted). Continuous lines and shading: mean ± standard deviation across subjects; black dots: response magnitudes for individual subjects, calculated as the average over ±10 ms time windows around the peak latencies. LH: left hemisphere, RH: right hemisphere. * p < 0.05, ** p < 0.01.