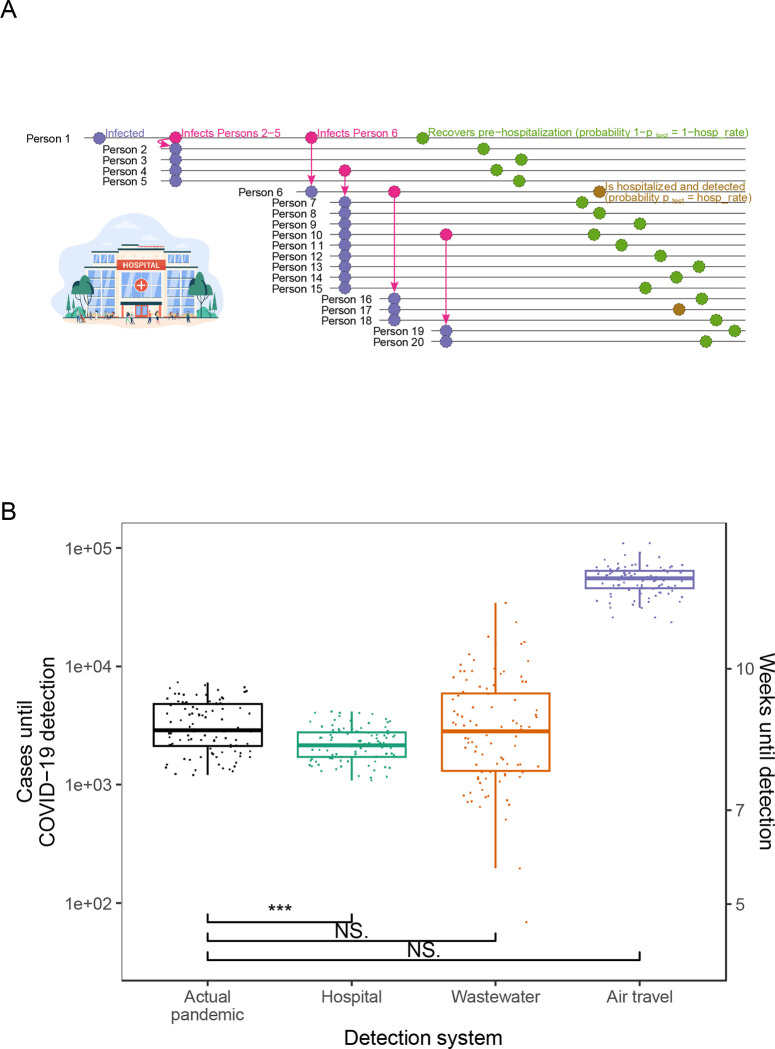
Fig. 1. Comparison of COVID-19 detection times in the actual pandemic versus with proposed early detection systems.
(A) Schematic of first 20 infections in a simulated run of the detection model. In this run, Person 1 seeds an outbreak in a community covered by a hospital detection system. Each person infects a number of individuals determined by a draw from a negative binomial distribution. Each person is then detected by the detection system with probability (gold) or goes undetected (olive); in the hospital system, equals the hospitalization rate. (B) Estimated cases until COVID-19 detection in the actual pandemic versus model-simulated cases until detection for proposed detection systems (center line, median; box limits, upper and lower quartiles; whiskers, point closest to 1.5x interquartile range). Estimates for the actual pandemic are drawn from56. Points for proposed detection systems are simulated case counts from the model (actual pandemic (black), hospital (teal), wastewater (orange) and air travel (purple)) assuming a Wuhan-sized catchment (650,000 people). Three, two, and one asterisk(s) signify that the cases upon detection for the detection system are statistically significantly lower than those in the actual pandemic at the 0.001, 0.01, and 0.05 levels, respectively, in one-sided t-tests. NS. signifies not statistically significantly lower at p=0.05. Equivalent weeks until detection are shown on the right y-axis.

