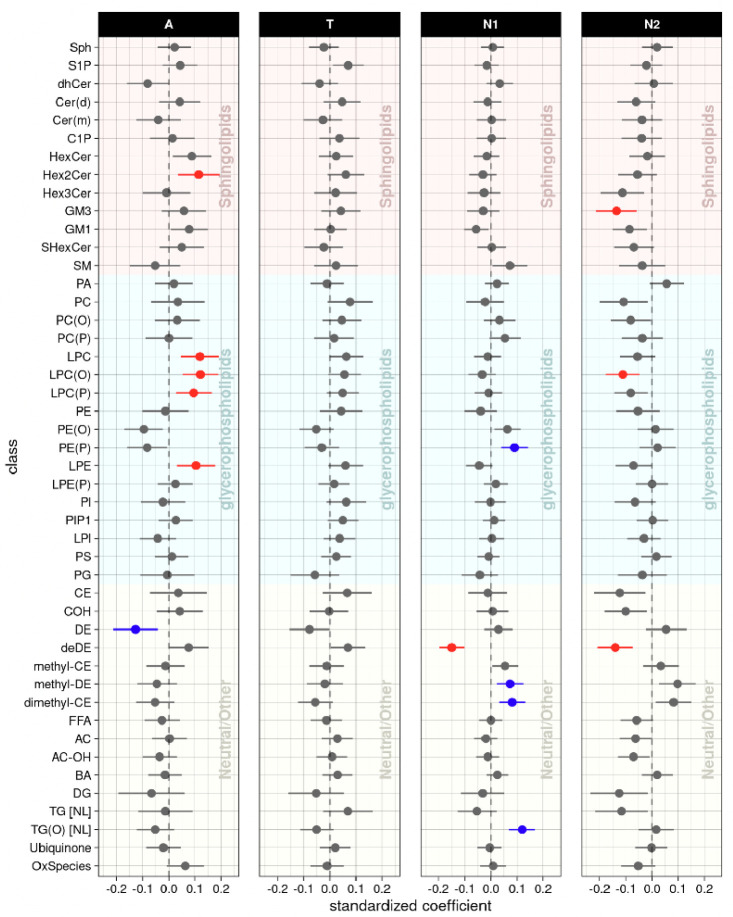
Figure 2.
Lipid class levels: association results of lipid classes with A/T/N biomarkers at baseline. The forest plots showed cross-sectional association results between lipid classes and A(Amyloid PET)/T(CSF pTau)/N1(MRI)/N2(FDG PET) biomarkers at baseline after FDR correction. Red colors represent that higher levels of the red colored lipid classes were significantly associated with worse AD biomarkers, and blue colors represent that lower levels of the blue colored lipid classes were significantly associated with worse AD biomarkers.

