

Summary
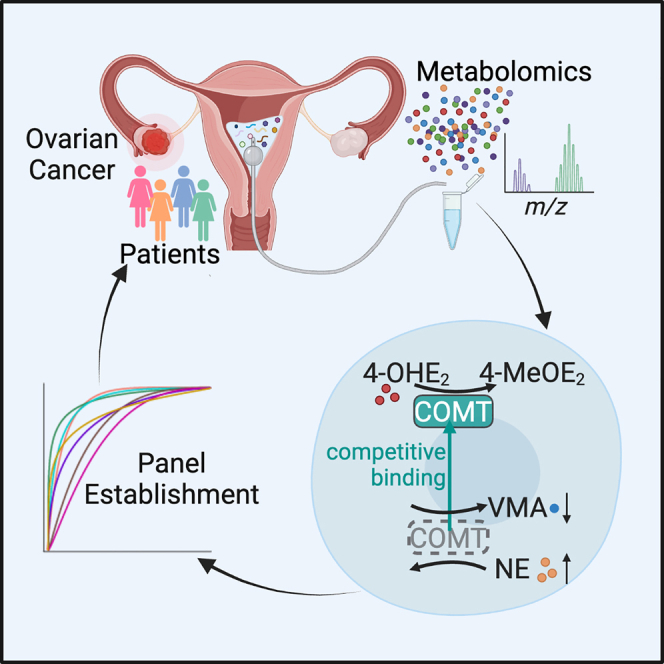
Ovarian cancer (OC) causes high mortality in women because of ineffective biomarkers for early diagnosis. Here, we perform metabolomics analysis on an initial training set of uterine fluid from 96 gynecological patients. A seven-metabolite-marker panel consisting of vanillylmandelic acid, norepinephrine, phenylalanine, beta-alanine, tyrosine, 12-S-hydroxy-5,8,10-heptadecatrienoic acid, and crithmumdiol is established for detecting early-stage OC. The panel is further validated in an independent sample set from 123 patients, discriminating early OC from controls with an area under the curve (AUC) of 0.957 (95% confidence interval [CI], 0.894–1). Interestingly, we find elevated norepinephrine and decreased vanillylmandelic acid in most OC cells, resulting from excess 4-hydroxyestradiol that antagonizes the catabolism of norepinephrine by catechol-O-methyltransferase. Moreover, exposure to 4-hydroxyestradiol induces cellular DNA damage and genomic instability that could lead to tumorigenesis. Thus, this study not only reveals metabolic features in uterine fluid of gynecological patients but also establishes a noninvasive approach for the early diagnosis of OC.
Keywords: ovarian cancer, early diagnosis, uterine fluid, metabolome, DNA damage
Graphical abstract
Highlights
-
•
Metabolomic features of different gynecological patients are profiled
-
•
A seven-metabolite-marker panel is established for ovarian cancer early detection
-
•
Elevated NE and decreased VMA result from excess 4-OHE2
Wang et al. identify and validate a seven-metabolite-marker panel consisting of vanillylmandelic acid, norepinephrine, phenylalanine, beta-alanine, tyrosine, 12S-HHT, and crithmumdiol that can accurately detect early-stage ovarian cancer using uterine fluid from gynecological patients. These findings establish a valuable noninvasive approach for the early diagnosis of ovarian cancer.
Introduction
Ovarian cancer (OC) has emerged as a leading cause of death in gynecological malignancies, with over 300,000 new cases every year in the world.1,2 As the most common type of the disease, epithelial OC (EOC) accounts for 90% in the OC population and is regarded as one of the most highly aggressive neoplasias.3 However, most patients with EOC are diagnosed at an advanced stage, resulting in less than 30% of the 5-year survival rate.4,5,6 The delayed diagnosis of OC is usually attributed to the occult initiation of tumor formation and the absence of effective early-detection methods.7,8 Generally, cancer antigen 125 (CA125) and human epididymis protein 4 (HE4) blood tests have been used as methods for OC detection.9,10,11 In addition, the Risk of Ovarian Malignancy Algorithm (ROMA) and the Risk of Ovarian Cancer Algorithm (OVERA) have been developed to assess the risk of OC in the past decades.12,13 However, these tests cannot meet the demand for early diagnosis because of their limited sensitivity and specificity.14,15 Furthermore, recent findings from the United Kingdom Collaborative Trial of Ovarian Cancer Screening (UKCTOCS), the largest OC screening trial to date, revealed that neither CA125-based multimodal screening nor transvaginal ultrasound screening approaches used in the trial significantly reduced deaths from OC.16 Recent advances in liquid biopsy using, for example, circulating tumor DNA and exosomes have improved the sensitivity, with extra advantages of minimal invasiveness and real-time monitoring.17,18 However, these approaches are hindered by the low amount of circulating substances and the lack of in-depth validation and stable quality control.19,20,21 Thus, exploring accurate and practical strategies for the early detection of OC is urgently needed.
Compared with blood circulating throughout the whole body, uterine fluid, a type of intraluminal fluid located in the pelvic cavity, might shed more light on the signatures of the early onset of OC. At the anatomical level, neighboring the ovarian surface and the fallopian tube, the uterine cavity is a 3–5 mL volumed space pooling uterine fluid, which consists of a wide range of molecules including ions, amino acids, proteins, etc.,22 and potentially reflects the status of adjacent organs with minimal interference from abdominal viscera.23,24 In addition, exfoliated cells and secreted factors from ovaries and fallopian tubes will flow into the uterine cavity and constitute the components of the fluid.25 On the other hand, in order to meet the needs of uncontrolled proliferation, cancer cells would undergo metabolic changes and reprogramming to grab more nutrient sources in the microenvironment of the pelvic cavity.26,27 For example, a recent report reveals that OC cells acquire fatty acids directly from the adipocytes of the omental fat in the pelvic microenvironment to achieve nutrient acquisition.28 Cancer-associated fibroblasts engage aerobic glycolysis and secrete energy-rich metabolite lactate, which fuels the metabolism of cancer cells.29 Thus, we hypothesize that the abnormal metabolites of the malignant cells from ovaries and fallopian tubes would be pooled in the uterine cavity, and the metabolomics of the uterine fluid will open up potential avenues for the early diagnosis of OC.
In this study, we collected uterine fluid from 219 patients from 2018 to 2022 including patients with benign gynecological diseases (OVBs), patients with early-stage OC (OVE), patients with late-stage OC (OVL), and patients with uterine corpus endometrial cancer (UCEC). In total, 1,213 metabolites belonging to multiple types of molecules such as organic acids, organoheterocyclic compounds, alkaloids, and lipids were detected in uterine fluid samples using an untargeted metabolomics approach. Of note, patients with OVE could be distinguished from the other groups in multiple analytic modes. Tyrosine catabolism, phenylalanine metabolism, and beta-alanine metabolism were among the most significant perturbed pathways. A seven-metabolite panel consisting of vanillylmandelic acid (VMA), norepinephrine (NE), phenylalanine, beta-alanine, tyrosine, 12-S-hydroxy-5,8,10-heptadecatrienoic acid (12S-HHT), and crithmumdiol was established and confirmed as an accurate tool for detecting patients with OVE from both training and validation sets. Interestingly, we found elevated NE and decreased VMA in most OVE samples, and this phenomenon resulted from excess 4-hydroxyestradiol (4-OHE2) in tumor tissues and the higher binding affinity and competition of 4-OHE2 to the methyltransferase of catechol-O-methyltransferase (COMT). Thus, our study not only reveals metabolic features in uterine fluid of patients with OC but also establishes a sensitive and noninvasive approach for early diagnosis of the disease.
Results
Metabolic profiling of uterine fluid from gynecological patients
To characterize metabolomic patterns of uterine fluid in patients with OC, especially in patients with EOC, we recruited 96 women between April 2018 and February 2019 as the training set, consisting of 26 patients with stage I–II (early) OC (here referred to as the OVE group), 25 patients with stage III–IV (late) OC (here referred to as the OVL group), 25 patients with OVBs for the group of “non-cancer control,” and 20 patients with UCEC for the group of “differentiation control.” Another cohort of 123 participants was enrolled between September 2020 and July 2022 as the validation set (Figure 1A). The demographic and clinical characteristics of all participants are provided in Tables S1 and S2. 5–10 mL uterine lavage was retrieved from each woman after a gentle infusion with 10 mL sterile normal saline into the uterine cavity before the scheduled surgery. Lavage fluid samples were immediately aliquoted into 1.5 mL microcentrifuge tubes. After proteins were precipitated with methanol, the supernatant of the fluid samples was stored for subsequent experiments.
Figure 1.

Metabolic features of uterine fluid in gynecological patients
(A) Schematic of study design. Uterine fluid samples were harvested from 219 gynecological patients from two cohorts. The training cohort consisted of 26 patients with stage I–II (early) OC (OVE group), 25 patients with stage III–IV (late) OC (OVL group), 25 patients with benign ovarian diseases (OVBs) for the group of “non-cancer controls,” and 20 patients with uterine corpus endometrial cancer (UCEC) for the group of “differentiation control.” The metabolomic profiling of uterine fluid was performed by RPLC-MS and HILIC-MS followed by normalization and analysis. An independent cohort of 123 gynecological patients (32 OVE, 31 OVL, 30 OVB, and 30 UCEC) was recruited as the validation set.
(B) Classes and counts of metabolites detected in uterine fluid samples. 566, 437, and 421 compounds were in total recognized in the modes of RPLC ESI positive, RPLC ESI negative, and HILIC ESI positive.
(C) Partial least squares discriminant analysis (PLS-DA) of metabolomics data from different groups of patients in the training set. Red, OVE; yellow, OVL; blue, OVB; green, UCEC. Each colored dot indicates an individual patient.
(D) Dendrogram of hierarchical clustering of metabolomics data from different groups of patients in the training set. OVE samples and OVB samples formed tight clusters, while OVL samples and UCEC samples were dispersed across all clusters.
(E) Venn diagram of numbers of metabolites in different groups of patients in the training set. 724 metabolites were commonly detected in all the groups of patients.
Using reverse-phase liquid chromatography-mass spectrometry (RPLC-MS) and hydrophilic interaction LC-MS (HILIC-MS), we performed an untargeted metabolomic analysis on the uterine fluid of all patients. Considering the individual variation of normal saline volume during uterine lavage acquisition across women, all of the detected ion signals in each sample were normalized by the obtained total ion count value, i.e., each metabolite was normalized by dividing its corresponding peak area by the sum of all peak area.30,31 Quality control samples were prepared by pooling all tested samples and aliquoting.32 As seen in Figure S1A, boxplots indicate no significant variation in the distribution of ion signals across all samples from different groups. The tightly clustered quality control points in the principal-component analysis (PCA) plots showed the reliability of the system and the high quality of the datasets (Figure S1B). In total, 1,542 mass spectral features (i.e., ions with a specific m/z and retention time) were detected in RPLC electrospray ionization (ESI) positive mode, 929 features were found in RPLC ESI negative mode, and 1,105 were identified in HILIC ESI positive mode (Figure S1C), which respectively matched with 566, 437, and 421 recognized compounds in metabolomics databases (Figure 1B). The metabolites belonged to several categories in each mode, such as acids, alkaloids, lipids, and organic nitrogen compounds. Organic acids were the most abundant compounds in both RPLC ESI positive mode and HILIC ESI positive mode, while lipids were the most abundant compounds in RPLC ESI negative mode. Benzenoids, organoheterocyclic compounds, and organic oxygen compounds were also frequently detected in these metabolites (Figure 1B).
By partial least squares discriminant analysis (PLS-DA), which can maximize intergroup variances and weaken the influence of confounding factors,33,34 the distribution pattern of the four groups (OVE, OVL, OVB, and UCEC) in the training set was displayed (Figure 1C). Notably, most of the patients with OVE could be significantly distinguished from the other grouped women in all three modes. Also, the women with OVBs could be distinguished from other participants in the RPLC ESI positive and RPLC ESI negative modes (Figure 1C). Hierarchical clustering showed that most OVE samples and OVB samples tended to form distinct clusters, whereas OVL and UCEC samples were dispersed across other clusters (Figures 1D and S1D). In the Venn diagram, we counted the number of metabolites commonly detected among different groups or only detected in each group. Specifically, 724 metabolites were commonly detected in all the groups, while a series of compounds only existed in each group (Figure 1E; Table S3), suggesting that female patients with different diseases have differential metabolic features in the microenvironment of the uterine cavity.
Biomarkers screening for early OC diagnosis
Since the main challenge of early diagnosis of OC is the distinction between women with OVE and women without cancer, we compared metabolic profiles between the OVE and OVB groups. We observed an apparent discrimination between the two groups under orthogonal PLS-DA (OPLS-DA) (Figures 2A and S2A). Permutation (1,000×) validated the credible predictability and fitness in the OPLS-DA model, with R2Y (cumulative [cum]) = 0.772 and Q2 (cum) = 0.634 in OPLS-DA (Figure 2B). A total of 298 metabolites with variable important projections (VIPs) >1 and false discovery rate (FDRs) <0.05 were identified as differential metabolites, among which 174 metabolites, such as tyrosine, phenylalanine, pantetheine, and NE, had increased levels and 124 metabolites, such as VMA, gibberellin A75, and pipecolic acid, had lower levels in OVE samples compared with OVB (Figures 2C and 2D). When investigating the perturbed metabolic pathways of the metabolomes between the OVE and OVB groups through Kyoto Encyclopedia of Genes and Genomes (KEGG) pathway-based analysis, we found that tyrosine catabolism, together with the related metabolism of phenylalanine, was the most active (Figure 2E). For differential diagnosis between OVE and UCEC, we analyzed metabolic pathways in these two groups with the above method. Similarly, an apparent discrimination between OVE and UCEC was observed (Figure S2B). 382 differential metabolites were screened, among which 214 were up-regulated and 168 were down-regulated (Figure S2C; Table S4). Intriguingly, tyrosine catabolism, phenylalanine, and beta-alanine metabolisms still emerged as the top 5 most significantly altered metabolic pathways in OVE compared with UCEC (Figure 2F). Next, we looked into all the molecules involved in the tyrosine catabolic pathway and found that tyrosine, thyroxine, and NE were significantly up-regulated, while iodotyrosine, 3,5-diiodo-L-tyrosine, and VMA were significantly down-regulated, in the OVE uterine fluid metabolome compared with that in the OVB group (Figure 2G). Also, tyrosine, NE, iodotyrosine, and 3,5-diiodo-L-tyrosine showed consistent trends in the OVE uterine fluid metabolome when compared with the UCEC group (Figure S2D). To confirm the above results, we used targeted LC-MS to test the level of six representative compounds in the tyrosine catabolic pathway (tyrosine, thyroxine, NE, VMA, iodotyrosine, and 3,5-diiodo-L-tyrosine) from 60 uterine fluid samples (15 OVE, 15 OVB, 15 OVL, and 15 UCEC), which were randomly selected from the training set. As expected, most patients with OVE showed a consistent metabolic pattern as above. In particular, 9–13 out of the 15 women with OVE had higher levels of tyrosine, thyroxine, and NE in their uterine fluid than the median levels of those in both women with OVB and UCEC, while more than 10 out of 15 women with OVE had a lower level of iodotyrosine and 3,5-diiodo-L-tyrosine than the median levels of those in both women with OVBs and UCEC. And VMA in the OVE group was significantly decreased compared with the OVB group (Figure 2H). These findings suggest that tyrosine catabolism is highly involved in the initiation of OC, and this metabolic perturbation could also differentiate two gynecological cancers, OC and endometrial cancer.
Figure 2.

Biomarker discovery for early detection of OC
(A) Orthogonal PLS-DA (OPLS-DA) of uterine fluid metabolomics between patients with OVBs and OVE in the training set. Blue, OVB; red, OVE.
(B) The validity of OPLS-DA model in (A) was confirmed by the permutation test (permutation times n = 1,000), showing no overfitting. R2Y measures the goodness of fit, while Q2 measures the predictive ability of the model.
(C) Heatmap of uterine fluid metabolomics between patients with OVBs and OVE in the training set. A total of 298 differential metabolites (174 up-regulated and 124 down-regulated) between the two groups were screened. The color schema from blue to red represents the relative abundance of metabolites from low to high, respectively.
(D) Representative metabolites that were significantly up-/down-regulated from (C) are shown. Tyrosine, 3-aminocaproic acid, phenylalanine, PC(14:0/20:3(5Z,8Z,11Z)), PC(16:0/16:0), pantetheine, mascaroside, arecoline, and NE were mostly up-regulated, while ethyl-hexanol sulfate, VMA, gibberellin A75, and pipecolic acid were generally down-regulated, in all samples.
(E) Pathway analysis of differential metabolites between OVB and OVE groups. The top 10 pathways enriched in the OVE group are shown on the y axis, and the x axis represents -log10 (FDR). Dot size indicates the impact value of each pathway.
(F) Pathway analysis of differential metabolites between OVE and UCEC groups. The top 10 pathways enriched in the OVE group are shown.
(G) Volcano plot analysis of metabolites involved in tyrosine catabolism pathway between OVB and OVE groups. Metabolites in the OVE group that were 4-fold higher or lower than those in OVB group are cut off by the dashed lines. 6 metabolites that were significantly increased or decreased with FDRs <0.05 are labeled in red and blue, respectively.
(H) Levels of the six metabolites in (G) in uterine fluid samples were measured by targeted LC-MS. 15 samples were included for each group. Data are presented as medians and interquartile ranges (IQRs). p1, p2, and p3 values were calculated by unpaired two-tailed Wilcoxon rank-sum tests for the comparison of OVB and OVE, the comparison of OVE and OVL, and the comparison of OVE and UCEC, respectively. p values were calculated for comparing all four groups using multiple comparison tests.
Metabolic alterations during OC development
To explore global metabolic alterations during OC development, we combined the groups of OVE and OVL as the OC group and compared metabolic profiles between OC and OVB. Using OPLS-DA, we observed that women with OC (including both OVE and OVL groups) were obviously separated from women with OVBs (Figures 3A and S3A). A total of 331 metabolites were found to be significantly different between the OC groups and the OVB group with VIP scores >1 and FDRs <0.05 (two-tailed Wilcoxon rank-sum tests) (Table S5). Using the fuzzy c-means clustering method, we examined metabolic changes during tumor development that is sequentially constituted by OVB, OVE, and OVL stages. These metabolites were divided into six types of clusters, and a considerable portion of them showed regular changes (Figure 3B). Specifically, 73 metabolites such as 12S-HHT, crithmumdiol, and epinephrine in cluster 1 displayed a sharp increase from the normal stage to the early stage and a slow increase from the early stage to the late stage (Figure 3C). For metabolites in cluster 2, their levels were significantly dropped from the normal stage to the early stage and kept relatively stable between the early and late stages (Figures 3B and S3B). To confirm the data of the metabolome, we selected 10 compounds from clusters 1, 2, and 4 (cysteinglutathione disulfate, 12S-HHT, epinephrine, tetrahydrodeoxycorticosterone, L-3,4-dihydroxyphenylalanine (L-DOPA), oxidized glutathione, 5-methoxytryptophan, tetrahydrocortisone, fusidic acid, and orotidine) whose commercial reference standards and internal standards were available and measured their levels among samples of OVB, OVE, and OVL by targeted LC-MS. Consistently, these compounds mainly matched the trends in the untargeted metabolome (Figure 3D). These results indicate that levels of a series of metabolites in uterine fluid regularly change during the formation of OC.
Figure 3.

Metabolic evolution during OC development
(A) OPLS-DA of uterine fluid metabolomics between the OVB and OV groups (the combination of OVE and OVL) in the training set. Blue, OVB; red, OV.
(B) Fuzzy c-means clustering of uterine fluid metabolomics during sequential stages (OVB, OVE, and OVL) of OC development in the training set. Different changing trends of metabolites are summarized in clusters 1–6.
(C) Heatmap of differential metabolites during sequential stages (OVB, OVE, and OVL) of OC development in the training set extracted from clusters 1 and 4 in (B). The differential metabolites with VIP scores >1.5 and FDRs <0.05 (two-tailed Wilcoxon rank-sum tests) are displayed in the heatmap. The color schema from blue to red represents the relative abundance of metabolites from low to high, respectively.
(D) Levels of ten representative compounds in uterine fluid samples were measured by targeted LC-MS. Each staged group contained 20 samples. Relative levels of compounds were summarized. Data are presented as medians and IQRs. The centerline of the boxplots represents the median, the box boundaries represent the IQRs, and whiskers span 1.5-fold the IQRs. p1 and p2 values were calculated by unpaired two-tailed Wilcoxon rank-sum tests for the comparison of OVB and OVE and the comparison of OVE and OVL, respectively. p values were calculated for comparing all three groups using multiple comparison tests.
Establishment and validation of the diagnostic model
Based on the metabolic features of uterine fluid in different gynecological patients, we aimed to establish an effective panel for achieving the early detection of OC. The screening strategy combines pathway enrichment analysis and abundance-based clustering algorithm. In the top enriched pathways, tyrosine, NE, and VMA have biologically relevant functions in “tyrosine catabolism,” while phenylalanine and beta-alanine are the most essential metabolites in “phenylalanine metabolism” and “beta-alanine metabolism,” respectively. In parallel, among cluster 1 (Figure 3B), which includes metabolites sharply elevated in OVE, 12S-HHT and crithmumdiol representatively emerged with VIPs >2 and FDRs <0.01. At last, tyrosine, NE, VMA, phenylalanine, beta-alanine, 12S-HHT, and crithmumdiol (the seven-metabolite panel) were screened out and further evaluated using recursive feature elimination and cross-validation with random forest classifier,35 confirming the high variable importance of the seven metabolites for model building. To this end, we extracted and analyzed the data of all seven candidates in the training set of 96 women and the validation set that included an independent population of 123 women (30 OVB, 32 OVE, 31 OVL, and 30 UCEC). Consistently, all seven candidates were found to be significantly different in the OVE group, especially compared with the OVB group (Figure S4A). Then, the individual diagnostic performances of these metabolites were evaluated by receiver operating characteristic (ROC) curves. The seven metabolites individually yielded areas under the curve (AUCs) of 0.752–0.926 and 0.725–0.931 in the training set (Figure S4B) and validation set (Figure 4A), respectively. In decision curve analysis for the assessment of the potential clinical utility of different biomarker models by comparing their net benefit (NB), which combines the benefits of true positives and the harms of false positives,36 we found that four metabolites (tyrosine, phenylalanine, beta-alanine, and NE) performed better than the CA125 test for risk of malignancy thresholds below 0.5 (Figures 4B and S4C). Next, we built a model based on the linear support vector machine (SVM) classifier between the OVE and OVB groups and performed the ROC analysis on the combined panel of the seven metabolites. Compared with CA125 and ROMA, the seven-marker panel had an obviously higher diagnostic value in identifying patients with OVE from patients with OVBs, with AUC values of 0.956 (95% confidence interval [CI]: 0.892–1) (p = 0.006, compared with CA125; p = 0.016, compared with ROMA) in the training set and 0.957 (95% CI: 0.894–1) (p = 0.004, compared with CA125; p = 0.002, compared with ROMA) in the validation set, respectively (Figures 4C and S4D). Also, the decision curves displayed a significant increase of NB in the seven-marker panel compared with that in CA125 and ROMA, implying the superiority of the panel for clinical decision-making (Figures 4D and S4E). When the seven marker and CA125 were combined, we observed enhanced AUC values of 0.964 and 0.969, respectively, for the training set and validation set (Figures 4E and S4F). Also, the seven-marker panel could successfully differentiate OVE from UCEC in both training and validation sets, and the AUC value could be enhanced in the combination use of CA125 (Figures 4F and S4G). Collectively, the seven metabolites of uterine fluid create a sensitive and accurate model for the early diagnosis of OC.
Figure 4.

A seven-metabolite panel for early diagnosis of OC
(A) ROC analysis of the individual metabolite (phenylalanine, beta-alanine, tyrosine, NE, VMA, 12S-HHT, or crithmumdiol) and single CA125 for differentiating patients with OVE from patients with OVBs in the validation set. The value of AUC for each metabolite is shown.
(B) Decision curve analysis of the individual metabolite for differentiating patients with OVE from patients with OVBs in the validation set. The “all” line refers to the net benefit (NB) of treating all women, and the “none” line shows the NB of treating no patients.
(C) ROC analysis of the seven-metabolite panel versus CA125 and ROMA for differentiating patients with OVE from patients with OVBs in the validation set (p = 0.004, compared with CA125; p = 0.002, compared with ROMA, Delong test). The values of AUCs and their confidence intervals (CIs) for CA125 and ROMA are shown, respectively.
(D) Decision curve analysis of the seven-metabolite panel versus CA125 and ROMA for differentiating patients with OVE from patients with OVBs in the validation set. The “all” line refers to the NB of treating all women, and the “none” line shows the NB of treating no patients.
(E) ROC analysis of the seven-metabolite panel combined with CA125 for differentiating patients with OVE from patients with OVBs in the validation set. The values of AUC and AUC CI are 0.969 and 0.899–1, respectively.
(F) ROC analysis of the seven-metabolite panel combined with or without CA125 for differentiating patients with OVE from patients with UCEC in the validation set. The values of AUCs and AUC CIs are shown.
See also Figure S4.
Excess 4-OHE2 in OC cells antagonizes the catabolism of NE by COMT
Among the seven biomarkers for early detection of OC, we found that tyrosine, NE, and VMA lie in the main branch of tyrosine catabolism (Figure 5A). Notably, the increased NE and decreased VMA in uterine fluid (Figure S4A) and tumor tissues (Figure 5B) are both correlated with COMT, which is known for the methylation of 4-OHE2.37,38,39 Interestingly, the protein of cytochrome P450 family 1 subfamily B member 1 (CYP1B1), an oxidase responsible for the generation of 4-OHE2,40 is usually highly expressed in OC tissues,41,42,43 which may result in a higher concentration of 4-OHE2. Accordingly, we extracted the expression data covering both OC tissues from The Cancer Genome Atlas (TCGA) database and normal ovarian tissues from the Genotype-Tissue Expression (GTEx) database and analyzed the expression status of CYP1B1. Most OC tissues expressed a higher level of CYP1B1 than that in normal controls (Figure 5C). On the other hand, we examined the protein level in tumor and para-tumor tissues from patients with OVE. Consistently, among the 12 pairs of samples we detected, 10 OVE tissues showed higher expression of CYP1B1 than their controls (Figure 5D). In line with this, we measured the relative level of 4-OHE2 in tissue extracts by ultra-performance LC triple-quadrupole MS (UPLC-TQS). As shown in Figure 5E, tumor tissues contained a significantly higher level of 4-OHE2 than that in para-tumor tissues, echoing the highly expressed level of CYP1B1. Considering the dual role of COMT for metabolizing 4-OHE2 and NE (Figure 5F), we hypothesized that 4-OHE2 in OC cells might compete with NE. To this end, we purified COMT protein in vitro and examined its affinity to 4-OHE2 versus NE by microscale thermophoresis (MST), a sensitive method for analyzing the affinities of biomolecules.44,45 Notably, 4-OHE2 had a stronger binding affinity to COMT than NE to COMT, with dissociation constants (KDs) of 1.81 and 13.78 μM, respectively (Figure 5G). At the cellular level, when we added 4-OHE2 to multiple types of cultured ovarian cells, including primary OC cells, normal immortalized human ovarian surface epithelial cells (T1074), and OC cell lines (SKOV3 and A2780), we found that the exogenous 4-OHE2 resulted in an elevation of NE and a decrease of VMA (Figure 5H). These data suggest that excess 4-OHE2 in OC cells antagonizes the catabolism of NE by COMT, causing a higher level of NE and a lower level of VMA.
Figure 5.

Increased 4-OHE2 in OC cells disturbs the tyrosine catabolism pathway
(A) An illustration of the tyrosine catabolism pathway in which tyrosine is catabolized to diverse intermediates including L-DOPA, dopamine, NE, epinephrine, normetanephrine, 3,4-dihydroxymandelate, MHPG, etc., and to the end product of VMA. These processes are catalyzed by several enzymes, among which COMT participates in multiple steps. MHPG, 3-Methoxy-4-hydroxyphenyl glycolaldehyde.
(B) Concentrations of NE and VMA in 12 pairs of para-tumor and tumor tissues were measured with an NE ELISA kit and a VMA ELISA kit, respectively. Data are presented as mean values ± SD. p values were calculated by unpaired two-tailed Student’s t tests. p <0.05 was considered statistically significant.
(C) Expression levels of CYP1B1 between normal ovarian tissues (88 available) and serous OC tissues (426 available) were compared through an integrated analysis of TCGA and GTEx databases. The values of log2 (normalized count) are used to measure the gene expression levels. p values were calculated by unpaired two-tailed Welch’s t test. p <0.05 was considered statistically significant.
(D) The protein level of CYP1B1 in 12 pairs of para-tumor and tumor tissues examined by western blot. Beta-actin was used as a loading control.
(E) 4-OHE2 in para-tumor tissues and tumor tissues was extracted, and the corresponding levels were measured by targeted LC-MS analysis. Data are presented as mean values ± SD. p values were calculated by unpaired two-tailed Student’s t tests. p <0.05 was considered statistically significant.
(F) Schematic diagram of dual functions of COMT in tyrosine catabolism and 4-OHE2 degradation.
(G) In vitro binding affinity of 4-OHE2 or NE to COMT was measured by microscale thermophoresis (MST). F norm = F1/F0 (F norm, normalized fluorescence; F1, fluorescence after thermodiffusion; F0, initial fluorescence or fluorescence after T-jump). KD, dissociation constant.
(H) Concentrations of NE and VMA in primary ovarian cancer cells and T1074, SKOV3, and A2780 cells treated with or without 5 μM 4-OHE2 for 12 h. Three biologically independent replicates were performed. Data are presented as mean values ± SD. p values were calculated by unpaired two-tailed Student’s t tests. p <0.05 was considered statistically significant.
4-OHE2 induces DNA damage and genomic instability
Given the crucial role of unbalanced estrogen metabolism in OC development39 and the excess 4-OHE2 detected in OC tissues, we asked whether 4-OHE2 would generate reactive oxygen species (ROS) and cause DNA damage in ovarian cells that may contribute to tumorigenesis. Thus, we treated T1074, SKOV3, and A2780 cells with 4-OHE2, followed by evaluating ROS levels with both ROS assay kits and 8-OHdG staining. Meanwhile, we detected apurinic/apyrimidinic (AP) sites, a conservative estimate of DNA single-strand breaks (SSBs) induced by ROS,46 and DNA double-strand breaks (DSBs) by γH2AX.47 A 3-h or 6-h treatment of 4-OHE2 did not increase the levels of ROS and DNA damage in the cells, while we observed significantly elevated level of ROS, AP sites, and DSBs in the 12-h treated group. Of note, the addition of the antioxidant N-acetyl-L-cysteine (NAC) inhibited the elevated ROS and DNA damage caused by 4-OHE2 (Figures 6A, 6B, and S5A–S5J). To confirm this phenomenon in clinical samples, we examined DNA damage status in OC tissues with their pairing para-tumor controls. Among the 12 detected tumor samples, 9 samples showed a heavier level of SSBs and DSBs than those in their controls (Figures 6C and 6D). Consistently, when we isolated cells from these tumor samples for comet assay, we found that most of the cells carried longer comet tails, indicating the existence of DNA damage in the cellular genome (Figure 6E). Next, we were curious whether the 4-OHE2-induced DNA damage would be a reason for tumorigenesis. T1074, SKOV3, and A2780 cells were treated with a lower dose (1 μM) of 4-OHE2 and cultured for 15 generations followed by whole-genome sequencing. The number of copy-number variations (CNVs) in these cells was higher than that in control cells and involved in all chromosomes. In particular, a fair number of long-term 4-OHE2-exposed T1074 cells showed elevated rates of chromosome fragments or breakage, which are usually featured in tumor cells.48 As expected, NAC treatment suppressed the increased rates of CNVs and chromosome fragment or breakage in these cells induced by long-term treatment of 4-OHE2 (Figures 6F, 6G, and S5K–S5N). Accordingly, we assessed the proliferation ability of these cells by soft agar colony-formation assay. Long-term 4-OHE2-exposed T1074 cells significantly formed more colonies than the control cells, and treatment with NAC reduced the increased number of colonies in the cells exposed to 4-OHE2 (Figure 6H), indicating that 4-OHE2 could induce cell transformation. Unlikely, due to the malignant characteristics of SKOV3 and A2780 cells, which already exhibit a high proliferation, we did not observe a significant difference in proliferation capability between the groups treated with or without 4-OHE2 (Figures S5O and S5P). These findings suggest that 4-OHE2-induced DNA damage causes a global instability to the whole genome that could potentially lead to tumorigenesis.
Figure 6.

The effect of 4-OHE2 on genomic stability
(A) The level of AP sites in T1074 cells treated with different time periods of 5 μM 4-OHE2 was measured with an AP site assay kit. The antioxidant NAC (5 mM) was added in the last group. Three biologically independent replicates were performed. Data are presented as mean values ± SD. p values were calculated by unpaired two-tailed Student’s t tests. p <0.05 was considered statistically significant.
(B) γH2AX staining of T1074 cells treated with different time periods of 5 μM 4-OHE2. NAC (5 mM) was added in the last group. Scale bar, 5 μm. The γH2AX foci number in each cell was counted. At least 30 cells from three biologically independent replicates were included for each group. Data are presented as mean values ± SEM. p values were calculated by unpaired two-tailed Student’s t tests. p <0.05 was considered statistically significant.
(C) The level of AP sites in primary cells from 12 pairs of para-tumor and tumor tissues was measured with an AP site assay kit. Three biologically independent replicates were performed for each tissue. Data are presented as mean values ± SD. p values were calculated by unpaired two-tailed Student’s t tests. p <0.05 was considered statistically significant.
(D) γH2AX staining of primary cells isolated from 12 pairs of para-tumor and tumor tissues. Scale bar, 5 μm. The γH2AX foci number in each cell was counted. At least 30 cells from three biologically independent replicates were included for each tissue. Data are presented as mean values ± SEM. p values were calculated by unpaired two-tailed Student’s t tests. p <0.05 was considered statistically significant.
(E) Alkali comet assay of primary cells isolated from 12 pairs of para-tumor and tumor tissues. Tail moments of cells represent data from three independent experiments, with at least 30 cells in each group. Data are presented as mean values ± SEM. p values were calculated by unpaired two-tailed Student’s t tests. p <0.05 was considered statistically significant.
(F) T1074 cells were cultured with or without 1 μM 4-OHE2 and 1 mM NAC for 15 generations. Genomic DNA of the cells was extracted and subjected to whole-genome sequencing (WGS), followed by CNV analysis with CNV sequencing (CNV-seq). The CNV value of each chromosome (1–22) in different groups is shown as the log2 ratio. Violins denote the status of total DNA, and scatters denote DNA segments with absolution log2 ratios >1.5.
(G) T1074 cells were cultured with or without 1 μM 4-OHE2 and 1 mM NAC for 15 generations and were subjected to mitotic spreading analysis. Representative phenotypes of chromosome fragments and breakages from the 4-OHE2-treated group are shown. The percentages of chromosome fragments and breakages in each group are summarized in the histogram. At least 30 cells from three biologically independent replicates were included for each group. Data are presented as mean values ± SEM. p values were calculated by unpaired two-tailed Student’s t tests. p <0.05 was considered statistically significant. Scale bar, 10 μm.
(H) T1074 cells were cultured with or without 1 μM 4-OHE2 and 1 mM NAC for 15 generations followed by malignant transformation assessment with soft agar colony-formation assay. The colony number was counted from three biologically independent replicates. Data are presented as mean values ± SD. p values were calculated by unpaired two-tailed Student’s t tests. p <0.05 was considered statistically significant.
See also Figure S5.
Discussion
Since no evident symptoms occur until the progression of OC, the majority of patients are diagnosed at a late stage.6,49 Thus, advancing early detection of OC is no doubt valuable for improving patients’ prognosis and expanding their lifetime. However, few biomarkers have been validated to be sufficiently effective for early detection in clinical practice. The CA125 blood test is commonly used for conventional diagnosis but has limitations in both sensitivity and specificity.11,50,51 Also, algorithms such as ROMA and OVERA have been developed to estimate the probability of malignancy for women presenting with ovarian cysts. Although these algorithms offer high sensitivity for detecting OC, specificity is limited.12,13 In close proximity to the ovarian surface and the fallopian tube, the uterine cavity stores abundant uterine fluid containing a wide range of molecules reflecting the status of the adjacent organs with minimal interference from the abdominal viscera.23,24 Thus, we aimed to profile the metabolome of the fluid and screen effective biomarkers for the early diagnosis of OC. A total of 1,213 metabolites including organic acids, organoheterocyclic compounds, alkaloids, and lipids in uterine fluid samples of different patient groups were identified. Of note, OVE could be distinguished from the other groups in multiple analytic modes. A seven-metabolite panel consisting of phenylalanine, beta-alanine, tyrosine, NE, VMA, 12S-HHT, and crithmumdiol was established and confirmed in an independent validation set. Interestingly, elevated NE and decreased VMA were commonly observed in most OVE tumors, and this phenomenon results from different binding affinities and competitions of 4-OHE2 and NE to the methyltransferase COMT. Thus, we characterize metabolites of uterine fluid in diverse types of gynecological patients and propose an efficient biomarker set for the early diagnosis of OC.
The differential metabolites in uterine fluid include polypeptide, fatty acids, phenols, etc., and the metabolomic property could distinguish different patients from others. Of note, more than one-third of all detected metabolites shifted dynamically from the non-malignant OVB group to the OVE group. For example, the levels of glycerophospholipid PC (16:0/16:0), common amino acid tyrosine, and pantetheine significantly increase, while the levels of VMA and ethyl-hexanol sulfate drop, at the early stage of OC. These findings suggest that metabolites, as downstream indicators of genes and proteins, are more sensitive in reflecting tumor initiation. When investigating the metabolic changes among the three groups in order—from OVB to OVE, then to OVL, representing the consecutive periods of tumor initiation and progression—we find that metabolites with increasing trends during tumor development could be differentiated. For example, 12S-HHT, crithmumdiol, and epinephrine increase drastically during the initial period of tumor formation, while other molecules such as L-DOPA and oxidized glutathione exhibit more significant elevation during tumor progression. These trends provide insights for distinguishing evolutionary windows of tumors. Additionally, as we observed a relatively blurred separation between OVL and UCEC groups compared with other paired groups, we reasoned that as the local environments of the uterine cavity in both patients with OVL and UCEC are more deteriorated than those in patients with OVE and OVBs, a considerable number of pathways would be affected, and their resulting metabolites would be commonly pooled in these worse environments.
Among the seven representative biomarkers that could distinguish women with OVBs and women with OVE with obscure symptoms, we find that tyrosine, NE, and VMA are involved in the tyrosine catabolism pathway, in which COMT catabolizes NE and produces VMA.52,53 Coincidentally, COMT also catabolizes 4-OHE2, which is usually elevated in OC tissues. Importantly, we reveal that the binding ability of COMT with 4-OHE2 was much stronger than NE in tyrosine metabolism. Thus, the competitive binding of 4-OHE2 to COMT attenuates the catabolism of NE, leading to decreased VMA. Using the biomarker panel, we successfully distinguished most early-stage patients in the validation set. The panel displays a fairly high AUC of 0.957, which surpasses that of 0.817 using CA125 and of 0.841 using ROMA. Currently, liquid biopsies are increasingly applied in the clinical setting for patients with OC owing to their minimally invasive advantage.20 Considering the increasing evidence that most OCs have actually originated from the fallopian tubes,54,55,56 having an anatomical connection with the uterine cavity, uterine fluid would be a better option to detect any abnormal change during OC initiation. Thus, this work not only characterizes metabolic profiles of uterine fluid in different gynecological patients but also provides an accurate and sensitive strategy for the early diagnosis of OC.
Limitations of the study
Firstly, our study did not include healthy women in the control group, primarily due to challenges in obtaining uterine fluid from this population. As an alternative, we harvested uterine fluid samples from women with benign gynecological conditions as our comparison group, which partially alleviates this limitation. Of note, in clinical practice, the majority of women seeking consultation often present with symptoms or imaging abnormalities rather than being completely healthy. Thus, differentiating patients with OC from those with benign gynecological conditions holds clinical importance. Secondly, due to the limitation of current reference databases and annotation methodologies, we cannot fully assess the accurate coverage of the uterine fluid metabolome in our study. Developing next-generation algorithms and expanding the database scale will be beneficial to mine our metabolic data of uterine fluid for more clinical applications.
STAR★Methods
Key resources table
| REAGENT or RESOURCE | SOURCE | IDENTIFIER |
|---|---|---|
| Antibodies | ||
| Anti-CYP1B1 | Abcam | Cat#ab137562, RRID:AB_2936812 |
| Anti-β-actin | Proteintech | Cat#66009-1-lg; RRID: AB_2782959 |
| Anti-8-OHdG | Santa Cruz Biotechnology | Cat#sc-66036; RRID:AB_832272 |
| Anti-γH2AX | Cell Signaling Technology | Cat#2577; RRID:AB_2118010 |
| Alexa FluorTM 488 goat anti-rabbit IgG | Thermo Fisher Scientific | Cat#A-11008; RRID:AB_143165 |
| Biological Samples | ||
| Uterine fluid specimens | This paper | N/A |
| Chemicals, Peptides, and Recombinant Proteins | ||
| Methanol | Thermo Fisher Scientific | Cat#047192 |
| Acetonitrile | Thermo Fisher Scientific | Cat#51101 |
| Formic acid | Thermo Fisher Scientific | Cat#28905 |
| Epinephrine | Sigma | Cat#E4642 |
| L-dopa | Sigma | Cat#D9628 |
| Tetrahydrocortisone | Sigma | Cat#900183 |
| Tyrosine | Sigma | Cat#T3754 |
| 3,5-diiodotyrosine | Sigma | Cat#D0754 |
| Iodotyrosine | Sigma | Cat#I8250 |
| Glutamic acid-13C5,15N | Sigma | Cat#644560 |
| 5-fluorotryptamine | Sigma | Cat#F7001 |
| Cortisol-d4 | Sigma | Cat#C-113 |
| Oxaphenamide | Sigma | Cat#SML2309 |
| 4-hydroxyestradiol (4-OHE2) | Glpbio | Cat#GC19552 |
| Tetrahydrodeoxycorticosterone | Glpbio | Cat#GC63218 |
| L-cysteine-glutathione disulfide | Glpbio | Cat#GC44045 |
| Orotidine | Glpbio | Cat#GC30618 |
| Orotidine-15N2,13C | TRC | Cat#O691521 |
| Epinephrine-d3 | Santa Cruz Biotechnology | Cat#sc-218618 |
| 4-hydroxy-17β-estradiol-1,2,16,16,17-d5 | MCE | Cat#HY-146631S |
| Theophylline | MCE | Cat#HY-B0809 |
| Sodium fusidate | MCE | Cat#HY-B1350A |
| Vanillylmandelic acid | MCE | Cat#HY-113121 |
| Norepinephrine | MCE | Cat#HY-13715 |
| Thyroxine | MCE | Cat#HY-18341 |
| Fusidic acid | MCE | Cat#HY-B1350 |
| 12S-HHT | MCE | Cat#HY-113330 |
| Arachidonic acid-d8 | MCE | Cat#HY-109590S |
| Tetrahydrodeoxycorticosterone-d3 | MCE | Cat#HY-113346S |
| L-glutathione oxidized (GSSG)-13C4,15N2 | MCE | Cat#HY-D0844S |
| L-dopa-13C | MCE | Cat#HY-N0304S2 |
| Critical Commercial Assays | ||
| Norepinephrine ELISA kit | Elabscience | Cat#E-EL-0047c |
| Vanillylmandelic acid ELISA kit | Elabscience | Cat#E-EL-0132c |
| Reactive Oxygen Species Detection Assay Kit | Abcam | Cat#ab186027 |
| AP sites assay kit | Abcam | Cat#ab211154 |
| DNeasy Blood & Tissue Kit | Qiagen | Cat#69504 |
| Deposited Data | ||
| Results for mass spectrometry of metabolomics | This paper | MetaboLights: MTBLS4861 |
| Whole genome sequencing (WGS) data of T1074, SKOV3, and A2780 cells | This paper | BioProject accession number: PRJCA009525 |
| Experimental Models: Cell Lines | ||
| SKOV3 cells | ATCC | Cat#HTB-77™ |
| A2780 cells | Sigma | Cat#CB93112519 |
| T1074 cells | Applied Biological Materials Inc. | Cat#T1074 |
| Primary ovarian tumor cells | This paper | N/A |
| Software and Algorithms | ||
| Burrows-Wheeler Alignment tool | SourceForge | https://bio-bwa.sourceforge.net/ |
| Sequence Alignment/Map tool | SourceForge | https://samtools.sourceforge.net/ |
| Picard | Broad Institute | https://broadinstitute.github.io/picard/picard-metric-definitions.html |
| Genome Analysis Toolkit | Broad Institute | https://github.com/broadinstitute/gatk/releases |
| ANNOVAR tool | GitHub repository | https://www.openbioinformatics.org/annovar/annovar_download_form.php |
| Comet Assay IV software | Instem | https://www.instem.com/solutions/genetic-toxicology/comet-assay.php |
| ropls package | Bioconductor | https://bioconductor.org/packages/release/bioc/html/ropls.html |
| MetaboAnalyst 4.0 | MetaboAnalyst | https://www.metaboanalyst.ca/ |
| Mfuzz package | Bioconductor | https://www.bioconductor.org/packages/release/bioc/html/Mfuzz.html |
| pheatmap package | The Comprehensive R Archive Network | https://CRAN.R-project.org/package=pheatmap |
| ggplot2 package | The Comprehensive R Archive Network | https://github.com/tidyverse/ggplot2 |
| pROC package | The Comprehensive R Archive Network | http://expasy.org/tools/pROC/ |
| rmda package | The Comprehensive R Archive Network | https://github.com/mdbrown/rmda |
| Xcalibur 2.2 SP1.48 software | Thermo Scientific | Cat#OPTON-30965 |
| Progenesis QI (Nonlinear dynamics, version 2.1) | Nonlinear Dynamics | https://www.nonlinear.com/progenesis/qi/download/ |
Resource availability
Lead contact
Further information and requests for resources and reagents should be directed to and will be fulfilled by the lead contact, Mo Li (limo@hsc.pku.edu.cn).
Materials availability
This study did not generate new unique reagents.
Experimental model and study participant details
Patients and cohorts
All human materials used in this study were approved by Peking University Third Hospital Medical Science Research Ethic Committee (IRB00006761-M2019471). Written informed consents were obtained from all patients who participated in this study prior to any study procedures.
A total of 219 participants from the Department of Obstetrics and Gynecology of Peking University Third Hospital were recruited as two independent cohorts for the harvest of uterine fluid specimens, including 55 women with benign ovarian tumors (OVB), 58 women with early staged ovarian cancer (OVE), 56 women with late staged ovarian cancer (OVL), and 50 women with endometrial cancer (UCEC). The training cohort (n=96) was used for biomarker discovery and model construction, and the validation cohort was applied to validate the model performance. The uterine fluid samples of patients in the training cohort were collected between April 2018 and February 2019, consisting of 25 OVB patients, 26 OVE patients, 25 OVL patients, and 20 UCEC patients. The validation cohort (n=123) consisting of 30 OVB patients, 32 OVE patients, 31 OVL patients, and 30 UCEC patients was enrolled as another independent cohort with uterine fluids harvested from September 2020 to July 2022. All patients had no prior history of metabolic diseases and other malignant tumors, and their demographic and clinical information including age, body mass index (BMI), CA125, HE4, ROMA, family history of cancer, parity history, oral contraceptive use, FIGO stage, grade, and histological subtype was recorded (Table S1 and S2).
Cell lines
The immortalized human ovarian surface epithelial cell line (T1074) was purchased from Applied Biological Materials Inc. (Richmond, BC, Canada) and cultured in Prigrow I medium containing 10% fetal bovine serum (FBS). Ovarian cancer cell lines SKOV3 cell line and A2780 cell line were purchased from ATCC and Sigma and cultured in Dulbecco’s modified Eagle medium (DMEM) and RPMI 1640 medium, respectively, both of which were supplemented with 10% FBS. 5 μM 4-OHE2 was used for regular treatment, and 1 μM 4-OHE2 was used for long term treatment. The cells were maintained in a humidified 5% CO2 incubator at 37°C.
To isolate and culture of primary ovarian cancer cells, fresh tumor samples were harvested from patients with ovarian cancer. After washing with PBS, 0.1–0.2 cm3 of the tumor specimen was cut off and mechanically disintegrated into pieces smaller than 1 mm3 using scalpels followed by digestion in 1× collagenase/hyaluronidase buffer (STEMCELL Technologies) at 37°C with agitation for 6 h. Further digestion was performed by gentle pipetting in trypsin (0.25%) and then in a solution of dispase (5 units/mL) and DNase I (0.05 mg/mL; STEMCELL Technologies) for 5–10 min. By filtration through a 40-μm filter, single-cell suspensions were obtained. These cells were then seeded at a density of 0.5–1 × 10⁵/well onto 6-well plates coated with collagen I and cultured for 36–72 h in a humidified 5% CO2 incubator at 37°C. Culture medium was composed of DMEM:F12 supplemented with 5% FBS, penicillin/streptomycin (1%), gentamycin (0.2%), adenine (20 μg/mL), EGF (10 ng/mL), cholera toxin (10 ng/mL), HEPES (15 mM), insulin (5 μg/mL), hydrocortisone (0.32 μg/mL), and ROCK inhibitor (5 μM). After stable adhesion, cells could be further cultured or frozen in FBS/DMSO (9:1) with 5 μM ROCK inhibitor in liquid nitrogen.
Method details
Uterine flushing
Uterine flushing was performed according to previous protocols with minor modification.57,58 With patients in the lithotomy position, the cervix was exposed by a sterile speculum and cleansed with sterile normal saline solution. A size ten (10 F) Foley catheter was placed in uterine cavity through the cervix and secured in place by inflating the balloon with 1 mL normal saline, followed by applying gentle traction to seal off the junction between uterine cavity and the cervical canal. Then 2 mL normal saline was slowly infused into uterine cavity through the catheter, left for 30 s before using gentle suction to harvest the fluid, and this procedure was repeated five times to ensure a thorough sampling of uterine cavity. The fluid collected each time was pooled together, subsequently aliquoted into 1.5 mL microcentrifuge tubes, and stored at −80°C. For each patient, multiple aliquots of equal amount (100 μL) of uterine fluid were used for metabolomics experiments and targeted tests.
Sample preparation
After thawing on ice at 4°C for 30 min, 100 μL of uterine fluid samples was mixed with 100 μL methanol. After vortex for 15s, the mixture was centrifuged at 12,000 rpm for 10 min at 4°C for protein precipitation. 80 μL of supernatants was collected before analysis. The aim of aqueous methanol extraction above was to remove protein fractions while maximizing small molecule recovery. Samples from each patient were prepared in triplicate using the above method, as the resulting extracts were analyzed using reverse-phase liquid chromatography (RPLC)-mass spectrometry (MS) with electrospray ionization (ESI) positive and ESI negative modes, hydrophilic interaction liquid chromatography (HILIC)-MS with ESI positive mode. Quality control (QC) samples were prepared by mixing equal volumes of each patient’s uterine fluid sample. Five QC samples were continuously injected at the start of the run. Throughout the analytical run, one QC sample was injected at a regular interval of eight samples to monitor the platform variability.
Untargeted metabolomics
Uterine fluid samples of patients were subjected to untargeted metabolomics conducted by an Ultimate 3000 Rapid Separation Liquid Chromatography (RSLC) system coupled to a Q Exactive hybrid Quadrupole-Orbitrap mass spectrometer (Thermo Scientific). For RP chromatographic separation method, the extract was gradient eluted from a C18 column (Waters ACQUITY UPLC HSS T3, 2.1 mm × 100 mm, 1.8 μm) using mobile phases including 0.1% formic acid in water (phase A) and 0.1% formic acid in methanol (phase B). The gradient program was as follows: 0–1 min, 2% phase B; 1-7min, 2%–100% phase B; 7–14.5 min, 100% phase B; 14.5–14.6 min, 100%–2% phase B; 14.6–16 min, 2% phase B. For HILIC separation method, the extract was eluted from a HILIC column (Waters UPLC BEH Amide, 2.1 mm × 100 mm, 1.7 μm) using a gradient consisting of 5 mM ammonium formate and 0.1% formic acid in acetonitrile/water (95:5) (phase A) and 0.1% formic acid in water (phase B). Elution was performed with a flow rate of 0.3 mL/min with a gradient spanning 5% phase B to 50% phase B over 7 min. After a pre-run time of 1 min at 5% phase B, phase B increased from 5% to 50% within 7 min 50% phase B was kept constant for 1 min with a fast decrease to 5% phase B within 0.1 min. The column temperature was maintained at 40°C. The flow rate was 0.3 mL/min, and the injection volume was 4 μL. The full-scan MS analysis was carried out on a Q Exactive hybrid quadrupole Orbitrap mass spectrometer (Thermo Scientific) equipped with a HESI-II probe, which was operated in positive and negative mode at a spray voltage of 3.7 kV and 3.5 kV, respectively. Other MS parameters were as follows: a resolution of 70,000, an auto gain control target under 1×10⁶, a maximum isolation time of 50 ms, and a scan range of m/z 150–1500. MS data were acquired using Xcalibur 2.2 SP1.48 software (Thermo Scientific). MS raw data were processed with Progenesis QI (Nonlinear dynamics, version 2.1) for peak alignment, peak picking, deconvolution, and eventual feature (m/z-retention time pairs) database searching. Mass spectrometric peaks were preliminarily annotated using the human metabolome database (HMDB, http://www.hmdb.ca/). Metabolites were filtered according to the 80% rule,59 i.e., the metabolite was included for further analysis only if it was detected in at least 4/5 samples of one group. The remaining missing values were replaced by 1/5 of the minimal value of the corresponding metabolites. Total ion count (TIC) normalization was used by dividing the peak area of each metabolite by the sum of all peak areas of all metabolites.60 Then the data was processed by log10 transformation and Pareto scaling.
Bioinformatics analyses
To monitor the stability of the study, an unsupervised method of principal component analysis (PCA) was conducted as a quality control measure. To classify patients depending on their metabolic profiles, the supervised multivariate analytic methods of partial least squares-discriminant analysis (PLS-DA) and orthogonal partial least squares discriminant analysis (OPLS-DA) were utilized to maximize the distance between groups and identify variables with an important contribution to the classification according to its VIP. Compared to PLS-DA, the main advantage of OPLS-DA is that a single component is used as a predictor and the other components constitute the orthogonal contrasts for analysis of variance, which often results in better separation since the effects of less interest are (partially) removed. For the classification between two groups, we performed OPLS-DA, and metabolites with VIP >1 and FDR <0.05 were selected as the differential metabolites. A permutation test with 1000 permutations was used for validating the OPLS-DA model’s predictability and fitness. PCA, PLS-DA, and OPLS-DA were performed using ropls package in R.
Another way of clustering the patients based on metabolic data was to create dendrograms using a hierarchical clustering algorithm on MetaboAnalyst 4.0 (https://www.metaboanalyst.ca/MetaboAnalyst/faces/home.xhtml). Fuzzy c-means clustering was performed to distinguish different temporal metabolic changes during ovarian cancer development using Mfuzz package in R. To identify the perturbed metabolic pathways in the early stage of ovarian cancer, we performed a Kyoto Encyclopedia of Genes and Genomes (KEGG) pathway enrichment analysis on significantly differential metabolites between the indicated groups via MetaboAnalyst 4.0. The heatmaps were plotted using pheatmap package, and the bar plots and the volcano plot were visualized using ggplot2 package in R. The selection of the biomarkers was achieved through pathway enrichment analysis and abundance-based clustering algorithm. The selected biomarkers were then confirmed to possess high variable importance for model construction through recursive feature elimination and cross-validation using a random forest classifier.35 The biomarker panel was constructed based on the linear SVM classifier in the training cohort which was also applied in the validation cohort. ROC analysis and decision curve analysis (DCA) were used to evaluate the model performance. ROC curve was plotted and the area under the curve was calculated using pROC package in R. The Delong test was used for comparing AUCs. The DCA was delineated to evaluate the clinical utility of the model using rmda package in R. The RNA-seq data of ovarian cancer tissues and normal ovary tissues were downloaded from The Cancer Genome Atlas (TCGA, https://portal.gdc.cancer.gov/) and the Geno-type-Tissue Expression (GTEx, https://www.gtexportal.org/home/index.html) database, respectively. We compared the expression levels of CYP1B1 in 88 normal ovary samples to 426 ovarian tumor tissues through an integrated analysis of TCGA and GTEx databases.
Targeted metabolite analysis
For measuring the level of 4-OHE2 in tissues, tumor tissues were dissected from early-stage ovarian cancer patients along with their para-tumor tissues. Then the tissues were grounded to homogenates using a Retsch MM 400 tissue grinder and extracted with 80% aqueous methanol (3×). Fractions were pooled and concentrated under a mild nitrogen stream using Nitrogen Blowing Concentrator. The residue was resuspended in 100 μL of acetonitrile/water 1:1 and centrifuged twice at 18000 rpm for 30 min each time. The supernatants were collected and then analyzed by ultra-performance liquid chromatography triple quadrupole mass spectrometry (UPLC-TQS). Samples were eluted from a C18 column (Waters ACQUITY UPLC BEHC18 column, 10 mm × 100 mm, 1.7 μm). Parameters were set as follows: autosampler temperature, 4°C; injection volume: 2 μL; ESI mode and voltage: negative ion mode and 4000 V; pump solvent: 50% methanol and 50% acetonitrile; flow rate: 0.5 mL/min. Data were acquired at a rate of 2.5 spectra/s with a stored mass range of m/z 50–1500. 4-hydroxy-17β-estradiol-1,2,16,16,17-d5 was used as the internal standard (IS). Data were collected and analyzed using Agilent MassHunter Workstation Data software.
For measuring the levels of sixteen metabolites (12S-HHT, cysteineglutathione disulfide, epinephrine, tetrahydrodeoxycorticosterone, L-dopa, oxidized glutathione, 5-methoxytyptophan, tetrahydrocortisone, fusidic acid, orotidine, tyrosine, thyroxine, NE, vanillylmandelic acid, 3,5-diiodotyrosine, and iodotyrosine) in a targeted approach, we collected uterine fluid from patients consisting of OVB, OVE, and OVL patients. The pretreatment was similar to that described in the ‘sample preparation’ section. Briefly, the uterine fluid was extracted three times with methanol at the ratio of 1:4 (v/v), and each extraction was subjected to centrifugation at 18000 rpm for 30 min. After being evaporated to dryness under mild nitrogen, the residues were reconstituted in acetonitrile/water (1:1, v/v) and centrifuged for final purification. The supernatant was then subjected to UPLC-TQS for targeted profiling. The mobile phases of RP separation employ water (phase A) and acetonitrile (phase B), both of which contain 0.1% formic acid and 0.2% acetic acid. Chromatographic separation was conducted with a C18 column (Waters ACQUITY UPLC BEHC18 column, 10 mm × 100 mm, 1.7 μm). MS parameters were optimized for each metabolite by direct infusion of reference standards using a syringe pump prior to sample analysis. For data acquisition, TQS with ESI source was operated in multiple reaction monitoring (MRM) mode. Each metabolite was run in both positive and negative ionization modes separately. The relative quantification process of metabolites was conducted with reference to their corresponding IS. Tetrahydrodeoxycorticosterone-d3, arachidonic acid-d8, glutamic acid-13C5,15N, epinephrine-d3, L-dopa-13 C, GSSG-13C4,15N2, 5-fluorotryptamine, cortisol-d4, sodium fusidate, and Orotidine-15N2,13C were used as ISs for tetrahydrodeoxycorticosterone, 12S-HHT, cysteineglutathione disulfide, epinephrine, L-dopa, oxidized glutathione, 5-methoxytrptophan, tetrahydrocortisone, fusidic acid, and orotidine respectively. Theophylline was used as the IS for tyrosine, thyroxine, NE, 3,5-diiodotyrosine, and iodotyrosine. Oxaphenamide was used as the IS for vanillylmandelic acid. Data were collected and analyzed using Agilent MassHunter Workstation Data software and subsequent normalized as described above.
ELISA
The levels of NE and VMA were determined by Human ELISA kits following manufacturer’s instructions (Elabscience, E-EL-0047c; Elabscience, E-EL-0132c). For tissue samples, collected tumor tissues and pairing para-tumor tissues from early-stage ovarian cancer patients were homogenized in ice-cold 0.01M hydrochloric acid before measurement. For cell samples, 5 × 10⁶ cells were harvested, washed with PBS, and lysed in 500 μL RIPA Lysis buffer (Pierce, 89900) on ice for 20 min. Then the samples were centrifuged at 1000 ×g at 4°C for 15 min, and the supernatant was used for the measurement of NE and VMA. For uterine fluid samples, measurements were conducted following the standard protocols without additional pretreatment.
Western blot
Total protein was extracted from cell lysate by RIPA buffer. 12 pairs of protein samples were separated by sodium dodecyl sulfate-polyacrylamide gel electrophoresis (SDS-PAGE) and then electrically transferred to polyvinylidene fluoride membranes. After transfer, the membranes were blocked in TBST containing 5% skim milk for 2 h, followed by incubation with anti-CYP1B1 antibody (1:500 dilution) or anti-β-actin antibody (1:2000 dilution) overnight at 4°C. After washing in TBST three times, the membranes were incubated at 37°C for 1 h with a 1:1000 dilution of HRP-conjugated secondary antibody. Finally, protein bands were visualized using an enhanced chemiluminescence detection system (Amersham Biosciences).
Microscale thermophoresis
MST was performed according to our previous work as described.44 Purified protein of GST-COMT was labeled with a RED-NHS protein labeling kit (NanoTemper, Germany) according to the standard protocol. The protein was then incubated at a constant concentration (10–50 nM) with 2-fold serial dilutions of 4-OHE2 or NE in an MST-optimized buffer (50 mM Tris-HCl, pH 7.4, 150 mM NaCl, 10 mM MgCl2, 0.05% Tween 20). Equal volumes of binding reactions were mixed by pipetting and incubated for 15 min at room temperature. Mixtures were enclosed in standard-treated or premium coated glass capillaries and loaded into the instrument (Monolith NT.115, NanoTemper, Germany). Time settings of the measurement were as follows: fluorescence before 5 s, MST on 30 s, fluorescence after 5 s, and delay 25 s. For all the measurements, 200-1,000 counts were obtained for the fluorescence intensity. The measurement was performed at 20% and 40% MST power. Fnorm= F1/F0 (Fnorm: normalized fluorescence; F1: fluorescence after thermodiffusion; F0: initial fluorescence or fluorescence after T-jump). Kd values were determined with the NanoTemper analysis tool.
ROS measurement
The level of ROS in T1074, SKOV3, and A2780 was detected using the Cellular Reactive Oxygen Species Detection Assay Kit (ab186027, Abcam, Cambridge, UK), following the manufacturer’s protocols. In brief, cells were plated (5 × 10⁴/100 μL per well) in a 96-well plate overnight. Subsequently, cells were treated with vehicle or 5 μM 4-OHE2 for 3, 6, and 12 h and then stained with ROS red stock solution for 1h at room temperature. After incubation, a fluorescence microplate reader was used to detect the intensity of the fluorescence at 520 nm (excitation) and 605 nm (emission) wavelengths. For ROS inhibition, NAC (Sigma-Aldrich A9165) were added to the culture medium. 5 mM NAC was used for regular treatment, and 1 mM NAC was used for long-term treatment.
AP sites assay
AP sites were quantified using AP sites assay kit (ab211154) according to the manufacturer’s protocol. In brief, T1074 cells were treated with vehicle or 5 μM 4-OHE2 for 3, 6, and 12 h. Then the genomic DNA of the cells was isolated and diluted to 100 μg/mL in TE buffer (10 mM Tris in pH 7.5, 1 mM EDTA). Next, genomic DNA was incubated with aldehyde reactive probe to tag AP sites with biotin. Subsequently, AP sites can be quantified through streptavidin-biotin assay followed by colorimetric detection.
Immunofluorescence
Cells were fixed in 4% paraformaldehyde in PBS (pH 7.4) for 30 min followed by permeabilization in 0.5% Triton X-100 for 25 min at room temperature. Then, samples were blocked with 1% bovine serum albumin-supplemented PBS for 1 h and incubated with the indicated anti-γH2AX or anti-8-OHdG antibody (1:100) at 4°C overnight. After washing three times in PBS containing 0.1% Tween 20 and 0.01% Triton X-100, cells were incubated with an appropriate fluorescent secondary antibody (Alexa FluorTM 488 goat anti-rabbit IgG) for 1 h at room temperature. After washing three times, cells were stained with Hoechst 33342 (10 μg/mL) for 15 min. Finally, samples were mounted on glass slides and observed under a confocal laser scanning microscope at ×63/1.40 (Carl Zeiss 710).
Comet assay
Single-cell gel electrophoretic comet assay was performed according to the previous study.61 In brief, cells with or without 4-OHE2 treatment were recovered in a normal culture medium. Then cells were collected and rinsed twice with ice-cold PBS. In all, 2 × 10⁴/mL cells were combined with 1% low-gelling-temperature agarose (Sigma; Type VII, cat.no. A-4018) at 40°C at the ratio of 1:3 (v/v) and immediately pipetted onto slides. For cellular lysis, the slides were immersed in the alkaline lysis solution (1.2 M NaCl, 100 mM Na2EDTA, 0.1% sodium lauryl sarcosinate, 0.26 M NaOH in pH > 13) overnight at 37°C in dark, followed by washing in the rinse buffer (0.03 M NaOH, 2 mM Na2EDTA) for 30 min with two repeats. Then, the slides were subjected to electrophoresis at 20 V (0.6 V/cm) for 25 min and stained in 2.5 μg/mL propidium iodide for 20 min. All images were taken with a fluorescence microscope (Olympus IX73) and analyzed by Comet Assay IV software.
Whole genome sequencing
Whole genome sequencing was performed as our previous study.62 In specific, the genomic DNA of cells was extracted and purified using the DNeasy Blood & Tissue Kit (Qiagen, 69504) according to the standard protocol. DNA quality was assessed by gel electrophoresis and a Qubit® 2.0 Fluorometer (Life Technologies, CA, USA). A total of 1 μg of genomic DNA per sample was used for library construction with TruSeq DNA Sample Preparation Guide (Illumina, 15026486 Rev.C). Qualified DNA libraries were sequenced using Illumina Whole Genome Sequencing Service with Illumina HiSeq X (10X, ∼30 GB/sample) at the Core Genomic Facility of Beijing Annoroad Genomics. All data were aligned to hg38 with BWA (Burrows-Wheeler Alignment tool),63 arranged with SAMtools (Sequence Alignment/Map tool),64 and marked with Picard (http://broadinstitute.github.io/picard/), and locally aligned with GATK (Genome Analysis Toolkit).65 Variants were annotated using ANNOVAR tool (Annotate Variation).66
Chromosome spreading
T1074, SKOV3 and A2780 cells were synchronized to mitotic stage with 50 ng/mL nocodazole overnight and released into a fresh medium. The mitotic cells were harvested by mitotic shake-off and centrifuge (100 g, 5 min). After hypotonic incubation in 75 mM KCl for 30 min at 37°C, cells were fixed in Carnoy solution (75% methanol, 25% glacial acetic acid). The fixed cells were dropped onto slides, dried in air, and stained with Hoechst 33342 in the dark. After briefly washing and drying, the slides were mounted with antifade mounting media and observed with a confocal microscope (Carl Zeiss 710).
Soft agar colony formation assay
Soft agar colony formation was assessed using previously standard methods.67 Briefly, the assay was performed on 6-well plates with two layers of soft agar mixture containing different concentrations of agarose. The bottom layer of each well was made up of a 1.5 mL mixture of 0.75 mL 2× DMEM and 0.75 mL 1% SeaPlaque agarose (Lonza, 50101). 5 × 10³ cells were suspended in 0.75 mL 2× DMEM (Gibco, 12100061) and mixed with 0.75 mL 0.6% agarose to form the upper layer of each well. After the mixtures were solidified at room temperature, 500 μL DMEM was added over the top to prevent the upper layer from desiccating. After three to four weeks, cells were stained with nitroblue tetrazolium chloride solution (1 mg/mL) (Solarbio, N8140) for colony visualization and counting.
Quantification and statistical analysis
For model building, the seven-marker model was trained using the SVM algorithm involving 10-fold cross validation on the training cohort. The same trained SVM model was applied to the validation cohort, with parameters specified as follows: type = “eps-regression”, kernel = “radial”, coat = “10”, gamma: “0.14”, epsilon: “0.1”.
The ROMA Index was calculated as a combination of CA125, HE4 and menopausal status according to the following formula68:
Premenopausal: Predictive Index (PI) = −12.0 + 2.38× LN (HE4) + 0.0626× LN (CA125).
Postmenopausal: Predictive Index (PI) = −8.09 + 1.04× LN (HE4) + 0.732× LN (CA125).
ROMA percentage were calculated by exp(PI)/(1+ exp(PI).
All experiments after bioinformatics analyses were repeated at least in triplicates. Means and SDs were plotted. Student’s t test was used for statistical analyses (p values were calculated by unpaired two-tailed Student’s t-tests and p < 0.05 was considered as statistically significant.). Statistical details are included in figures and figure legends. Two group comparison of each metabolite was conducted using unpaired two-tailed Wilcoxon rank-sum test and p values were adjusted with multiple testing correction Benjamini-Hochberg method to derive FDR. The Shapiro-Wilk test was used to determine the distribution of the samples. For multiple group comparisons, one way analysis of variance (ANOVA) for normal data or Kruskal-Wallis test for non-normal data were used.
Acknowledgments
MS experiments were carried out by Beijing Omics Biological Technology Company (Beijing, China). Whole-genome sequencing was carried out by Annoroad Genomics Company (Beijing, China). We thank Dr. Wenchuan Leng for the assistance with the analysis of MS data. This work was supported by the National Natural Science Foundation of China (NSFC) (T2225006 to M.L., 82103106 to X.G., and 82203103 to Y.X.) and by the “Clinic + X″ program (to M.L.) of Peking University.
Author contributions
M.L. and H.G. conceived and designed the experiments; P.W., J.M., W.L., Q.W., Y.X., Y.J., and X.G. performed the experiments; P.W. operated mass spectrum equipment; Y.J. and J.M. analyzed bioinformatics data; Y.W. and P.W. harvested patient samples; and M.L., S.D., and Y.W. wrote the manuscript.
Declaration of interests
The authors declare the following patent related to this work: M.L., H.G., Y.W., P.W., Y.J., J.M., Y.X., and X.G. are listed as inventors on a patent (C.N. patent application no. ZL 2022 1 1651535.6) filed in December 2022 and granted in March 2023.
Inclusion and diversity
We support inclusive, diverse, and equitable conduct of research.
Published: June 1, 2023
Footnotes
Supplemental information can be found online at https://doi.org/10.1016/j.xcrm.2023.101061.
Contributor Information
Hongyan Guo, Email: bysyghy@163.com.
Mo Li, Email: limo@hsc.pku.edu.cn.
Supplemental information
Data and code availability
All raw files and search results for mass spectrometry of metabolomics have been deposited in MetaboLights (https://www.ebi.ac.uk/metabolights) with the identification No. MTBLS4861. Whole genome sequencing (WGS) data of T1074, SKOV3, and A2780 cells reported in this study have been deposited in the genome sequence archive of Beijing Institute of Genomics, Chinese Academy of Sciences, Beijing, China (https://ngdc.cncb.ac.cn/, BioProject accession no. PRJCA009525). Any additional information required to reanalyze the data reported in this paper is available from the lead contact upon request.
References
- 1.Sung H., Ferlay J., Siegel R.L., Laversanne M., Soerjomataram I., Jemal A., Bray F. Global cancer statistics 2020: GLOBOCAN estimates of incidence and mortality worldwide for 36 cancers in 185 countries. CA. Cancer J. Clin. 2021;71:209–249. doi: 10.3322/caac.21660. [DOI] [PubMed] [Google Scholar]
- 2.Armstrong D.K., Alvarez R.D., Bakkum-Gamez J.N., Barroilhet L., Behbakht K., Berchuck A., Chen L.M., Cristea M., DeRosa M., Eisenhauer E.L., et al. Ovarian cancer, version 2.2020, NCCN clinical practice guidelines in oncology. J. Natl. Compr. Canc. Netw. 2021;19:191–226. doi: 10.6004/jnccn.2021.0007. [DOI] [PubMed] [Google Scholar]
- 3.Lheureux S., Gourley C., Vergote I., Oza A.M. Epithelial ovarian cancer. Lancet. 2019;393:1240–1253. doi: 10.1016/s0140-6736(18)32552-2. [DOI] [PubMed] [Google Scholar]
- 4.Torre L.A., Trabert B., DeSantis C.E., Miller K.D., Samimi G., Runowicz C.D., Gaudet M.M., Jemal A., Siegel R.L. Ovarian cancer statistics, 2018. CA. Cancer J. Clin. 2018;68:284–296. doi: 10.3322/caac.21456. [DOI] [PMC free article] [PubMed] [Google Scholar]
- 5.Lheureux S., Braunstein M., Oza A.M. Epithelial ovarian cancer: evolution of management in the era of precision medicine. CA. Cancer J. Clin. 2019;69:280–304. doi: 10.3322/caac.21559. [DOI] [PubMed] [Google Scholar]
- 6.Siegel R.L., Miller K.D., Fuchs H.E., Jemal A. Cancer statistics, 2021. CA. Cancer J. Clin. 2021;71:7–33. doi: 10.3322/caac.21654. [DOI] [PubMed] [Google Scholar]
- 7.Farley J., Ozbun L.L., Birrer M.J. Genomic analysis of epithelial ovarian cancer. Cell Res. 2008;18:538–548. doi: 10.1038/cr.2008.52. [DOI] [PMC free article] [PubMed] [Google Scholar]
- 8.Yarmolinsky J., Bull C.J., Vincent E.E., Robinson J., Walther A., Smith G.D., Lewis S.J., Relton C.L., Martin R.M. Association between genetically proxied inhibition of HMG-CoA reductase and epithelial ovarian cancer. JAMA. 2020;323:646–655. doi: 10.1001/jama.2020.0150. [DOI] [PMC free article] [PubMed] [Google Scholar]
- 9.Matulonis U.A., Sood A.K., Fallowfield L., Howitt B.E., Sehouli J., Karlan B.Y. Ovarian cancer. Nat. Rev. Dis. Primers. 2016;2 doi: 10.1038/nrdp.2016.61. [DOI] [PMC free article] [PubMed] [Google Scholar]
- 10.Hellström I., Raycraft J., Hayden-Ledbetter M., Ledbetter J.A., Schummer M., McIntosh M., Drescher C., Urban N., Hellström K.E. The HE4 (WFDC2) protein is a biomarker for ovarian carcinoma. Cancer Res. 2003;63:3695–3700. [PubMed] [Google Scholar]
- 11.Xiao Y., Bi M., Guo H., Li M. Multi-omics approaches for biomarker discovery in early ovarian cancer diagnosis. EBioMedicine. 2022;79 doi: 10.1016/j.ebiom.2022.104001. [DOI] [PMC free article] [PubMed] [Google Scholar]
- 12.Dochez V., Caillon H., Vaucel E., Dimet J., Winer N., Ducarme G. Biomarkers and algorithms for diagnosis of ovarian cancer: CA125, HE4, RMI and ROMA, a review. J. Ovarian Res. 2019;12:28. doi: 10.1186/s13048-019-0503-7. [DOI] [PMC free article] [PubMed] [Google Scholar]
- 13.Coleman R.L., Herzog T.J., Chan D.W., Munroe D.G., Pappas T.C., Smith A., Zhang Z., Wolf J. Validation of a second-generation multivariate index assay for malignancy risk of adnexal masses. Am. J. Obstet. Gynecol. 2016;215 doi: 10.1016/j.ajog.2016.03.003. 82.e1-82.82.e11. [DOI] [PubMed] [Google Scholar]
- 14.Buys S.S., Partridge E., Greene M.H., Prorok P.C., Reding D., Riley T.L., Hartge P., Fagerstrom R.M., Ragard L.R., Chia D., et al. Ovarian cancer screening in the Prostate, Lung, Colorectal and Ovarian (PLCO) cancer screening trial: findings from the initial screen of a randomized trial. Am. J. Obstet. Gynecol. 2005;193:1630–1639. doi: 10.1016/j.ajog.2005.05.005. [DOI] [PubMed] [Google Scholar]
- 15.Yang W.L., Lu Z., Bast R.C., Jr. The role of biomarkers in the management of epithelial ovarian cancer. Expert Rev. Mol. Diagn. 2017;17:577–591. doi: 10.1080/14737159.2017.1326820. [DOI] [PMC free article] [PubMed] [Google Scholar]
- 16.Menon U., Gentry-Maharaj A., Burnell M., Singh N., Ryan A., Karpinskyj C., Carlino G., Taylor J., Massingham S.K., Raikou M., et al. Ovarian cancer population screening and mortality after long-term follow-up in the UK Collaborative Trial of Ovarian Cancer Screening (UKCTOCS): a randomised controlled trial. Lancet. 2021;397:2182–2193. doi: 10.1016/S0140-6736(21)00731-5. [DOI] [PMC free article] [PubMed] [Google Scholar]
- 17.Diaz L.A., Jr., Bardelli A. Liquid biopsies: genotyping circulating tumor DNA. J. Clin. Oncol. 2014;32:579–586. doi: 10.1200/JCO.2012.45.2011. [DOI] [PMC free article] [PubMed] [Google Scholar]
- 18.Yu W., Hurley J., Roberts D., Chakrabortty S.K., Enderle D., Noerholm M., Breakefield X.O., Skog J.K. Exosome-based liquid biopsies in cancer: opportunities and challenges. Ann. Oncol. 2021;32:466–477. doi: 10.1016/j.annonc.2021.01.074. [DOI] [PMC free article] [PubMed] [Google Scholar]
- 19.Ignatiadis M., Sledge G.W., Jeffrey S.S. Liquid biopsy enters the clinic - implementation issues and future challenges. Nat. Rev. Clin. Oncol. 2021;18:297–312. doi: 10.1038/s41571-020-00457-x. [DOI] [PubMed] [Google Scholar]
- 20.Chang L., Ni J., Zhu Y., Pang B., Graham P., Zhang H., Li Y. Liquid biopsy in ovarian cancer: recent advances in circulating extracellular vesicle detection for early diagnosis and monitoring progression. Theranostics. 2019;9:4130–4140. doi: 10.7150/thno.34692. [DOI] [PMC free article] [PubMed] [Google Scholar]
- 21.Giannopoulou L., Lianidou E.S. Liquid biopsy in ovarian cancer. Adv. Clin. Chem. 2020;97:13–71. doi: 10.1016/bs.acc.2020.01.001. [DOI] [PubMed] [Google Scholar]
- 22.Zhang Y., Wang Q., Wang H., Duan E. Uterine fluid in pregnancy: a biological and clinical outlook. Trends Mol. Med. 2017;23:604–614. doi: 10.1016/j.molmed.2017.05.002. [DOI] [PubMed] [Google Scholar]
- 23.Schorge J.O. McGraw-Hill Medical; 2008. Williams Gynecology. [Google Scholar]
- 24.Lentz G.M., Lobo R.A., Gershenson D.M., Katz V.L. Elsevier Health Sciences; 2012. Comprehensive Gynecology E-Book. [Google Scholar]
- 25.Maritschnegg E., Wang Y., Pecha N., Horvat R., Van Nieuwenhuysen E., Vergote I., Heitz F., Sehouli J., Kinde I., Diaz L.A., Jr., et al. Lavage of the uterine cavity for molecular detection of mullerian duct carcinomas: a proof-of-concept study. J. Clin. Oncol. 2015;33:4293–4300. doi: 10.1200/JCO.2015.61.3083. [DOI] [PMC free article] [PubMed] [Google Scholar]
- 26.Pavlova N.N., Thompson C.B. The emerging hallmarks of cancer metabolism. Cell Metab. 2016;23:27–47. doi: 10.1016/j.cmet.2015.12.006. [DOI] [PMC free article] [PubMed] [Google Scholar]
- 27.Cairns R.A., Harris I.S., Mak T.W. Regulation of cancer cell metabolism. Nat. Rev. Cancer. 2011;11:85–95. doi: 10.1038/nrc2981. [DOI] [PubMed] [Google Scholar]
- 28.Nieman K.M., Kenny H.A., Penicka C.V., Ladanyi A., Buell-Gutbrod R., Zillhardt M.R., Romero I.L., Carey M.S., Mills G.B., Hotamisligil G.S., et al. Adipocytes promote ovarian cancer metastasis and provide energy for rapid tumor growth. Nat. Med. 2011;17:1498–1503. doi: 10.1038/nm.2492. [DOI] [PMC free article] [PubMed] [Google Scholar]
- 29.Pavlides S., Whitaker-Menezes D., Castello-Cros R., Flomenberg N., Witkiewicz A.K., Frank P.G., Casimiro M.C., Wang C., Fortina P., Addya S., et al. The reverse Warburg effect: aerobic glycolysis in cancer associated fibroblasts and the tumor stroma. Cell Cycle. 2009;8:3984–4001. doi: 10.4161/cc.8.23.10238. [DOI] [PubMed] [Google Scholar]
- 30.Tang D.Q., Zou L., Yin X.X., Ong C.N. HILIC-MS for metabolomics: an attractive and complementary approach to RPLC-MS. Mass Spectrom. Rev. 2016;35:574–600. doi: 10.1002/mas.21445. [DOI] [PubMed] [Google Scholar]
- 31.Mung D., Li L. Applying quantitative metabolomics based on chemical isotope labeling LC-MS for detecting potential milk adulterant in human milk. Anal. Chim. Acta. 2018;1001:78–85. doi: 10.1016/j.aca.2017.11.019. [DOI] [PubMed] [Google Scholar]
- 32.Luo P., Yin P., Hua R., Tan Y., Li Z., Qiu G., Yin Z., Xie X., Wang X., Chen W., et al. A Large-scale, multicenter serum metabolite biomarker identification study for the early detection of hepatocellular carcinoma. Hepatology. 2018;67:662–675. doi: 10.1002/hep.29561. [DOI] [PMC free article] [PubMed] [Google Scholar]
- 33.Whitehead A., Krause F.N., Moran A., MacCannell A.D.V., Scragg J.L., McNally B.D., Boateng E., Murfitt S.A., Virtue S., Wright J., et al. Brown and beige adipose tissue regulate systemic metabolism through a metabolite interorgan signaling axis. Nat. Commun. 2021;12:1905. doi: 10.1038/s41467-021-22272-3. [DOI] [PMC free article] [PubMed] [Google Scholar]
- 34.Bharath L.P., Agrawal M., McCambridge G., Nicholas D.A., Hasturk H., Liu J., Jiang K., Liu R., Guo Z., Deeney J., et al. Metformin enhances autophagy and normalizes mitochondrial function to alleviate aging-associated inflammation. Cell Metab. 2020;32:44–55.e6. doi: 10.1016/j.cmet.2020.04.015. [DOI] [PMC free article] [PubMed] [Google Scholar]
- 35.Xue B., Li D., Lu C., King C.R., Wildes T., Avidan M.S., Kannampallil T., Abraham J. Use of machine learning to develop and evaluate models using preoperative and intraoperative data to identify risks of postoperative complications. JAMA Netw. Open. 2021;4 doi: 10.1001/jamanetworkopen.2021.2240. [DOI] [PMC free article] [PubMed] [Google Scholar]
- 36.Wynants L., Timmerman D., Verbakel J.Y., Testa A., Savelli L., Fischerova D., Franchi D., Van Holsbeke C., Epstein E., Froyman W., et al. Clinical utility of risk models to refer patients with adnexal masses to specialized oncology care: multicenter external validation using decision curve analysis. Clin. Cancer Res. 2017;23:5082–5090. doi: 10.1158/1078-0432.CCR-16-3248. [DOI] [PubMed] [Google Scholar]
- 37.Dawling S., Roodi N., Mernaugh R.L., Wang X., Parl F.F. Catechol-O-methyltransferase (COMT)-mediated metabolism of catechol estrogens: comparison of wild-type and variant COMT isoforms. Cancer Res. 2001;61:6716–6722. [PubMed] [Google Scholar]
- 38.Yager J.D., Davidson N.E. Estrogen carcinogenesis in breast cancer. N. Engl. J. Med. 2006;354:270–282. doi: 10.1056/NEJMra050776. [DOI] [PubMed] [Google Scholar]
- 39.Zahid M., Beseler C.L., Hall J.B., LeVan T., Cavalieri E.L., Rogan E.G. Unbalanced estrogen metabolism in ovarian cancer. Int. J. Cancer. 2014;134:2414–2423. doi: 10.1002/ijc.28565. [DOI] [PMC free article] [PubMed] [Google Scholar]
- 40.Chen Z.H., Na H.K., Hurh Y.J., Surh Y.J. 4-Hydroxyestradiol induces oxidative stress and apoptosis in human mammary epithelial cells: possible protection by NF-kappaB and ERK/MAPK. Toxicol. Appl. Pharmacol. 2005;208:46–56. doi: 10.1016/j.taap.2005.01.010. [DOI] [PubMed] [Google Scholar]
- 41.Downie D., McFadyen M.C.E., Rooney P.H., Cruickshank M.E., Parkin D.E., Miller I.D., Telfer C., Melvin W.T., Murray G.I. Profiling cytochrome P450 expression in ovarian cancer: identification of prognostic markers. Clin. Cancer Res. 2005;11:7369–7375. doi: 10.1158/1078-0432.CCR-05-0466. [DOI] [PubMed] [Google Scholar]
- 42.McFadyen M.C., Cruickshank M.E., Miller I.D., McLeod H.L., Melvin W.T., Haites N.E., Parkin D., Murray G.I. Cytochrome P450 CYP1B1 over-expression in primary and metastatic ovarian cancer. Br. J. Cancer. 2001;85:242–246. doi: 10.1054/bjoc.2001.1907. [DOI] [PMC free article] [PubMed] [Google Scholar]
- 43.Murray G.I., Melvin W.T., Greenlee W.F., Burke M.D. Regulation, function, and tissue-specific expression of cytochrome P450 CYP1B1. Annu. Rev. Pharmacol. Toxicol. 2001;41:297–316. doi: 10.1146/annurev.pharmtox.41.1.297. [DOI] [PubMed] [Google Scholar]
- 44.Li W., Gu X., Liu C., Shi Y., Wang P., Zhang N., Wu R., Leng L., Xie B., Song C., Li M. A synergetic effect of BARD1 mutations on tumorigenesis. Nat. Commun. 2021;12:1243. doi: 10.1038/s41467-021-21519-3. [DOI] [PMC free article] [PubMed] [Google Scholar]
- 45.Xie B., Zhang L., Zhao H., Bai Q., Fan Y., Zhu X., Yu Y., Li R., Liang X., Sun Q.Y., et al. Poly(ADP-ribose) mediates asymmetric division of mouse oocyte. Cell Res. 2018;28:462–475. doi: 10.1038/s41422-018-0009-7. [DOI] [PMC free article] [PubMed] [Google Scholar]
- 46.Li M., Chen Q., Yu X. Chemopreventive effects of ROS targeting in a murine model of BRCA1-deficient breast cancer. Cancer Res. 2017;77:448–458. doi: 10.1158/0008-5472.CAN-16-2350. [DOI] [PMC free article] [PubMed] [Google Scholar]
- 47.Li M., Yu X. Function of BRCA1 in the DNA damage response is mediated by ADP-ribosylation. Cancer Cell. 2013;23:693–704. doi: 10.1016/j.ccr.2013.03.025. [DOI] [PMC free article] [PubMed] [Google Scholar]
- 48.Duijf P.H.G., Schultz N., Benezra R. Cancer cells preferentially lose small chromosomes. Int. J. Cancer. 2013;132:2316–2326. doi: 10.1002/ijc.27924. [DOI] [PMC free article] [PubMed] [Google Scholar]
- 49.Dall'Acqua A., Sonego M., Pellizzari I., Pellarin I., Canzonieri V., D'Andrea S., Benevol S., Sorio R., Giorda G., Califano D., et al. CDK6 protects epithelial ovarian cancer from platinum-induced death via FOXO3 regulation. EMBO Mol. Med. 2017;9:1415–1433. doi: 10.15252/emmm.201607012. [DOI] [PMC free article] [PubMed] [Google Scholar]
- 50.Funston G., Hamilton W., Abel G., Crosbie E.J., Rous B., Walter F.M. The diagnostic performance of CA125 for the detection of ovarian and non-ovarian cancer in primary care: a population-based cohort study. PLoS Med. 2020;17 doi: 10.1371/journal.pmed.1003295. [DOI] [PMC free article] [PubMed] [Google Scholar]
- 51.Nash Z., Menon U. Ovarian cancer screening: current status and future directions. Best Pract. Res. Clin. Obstet. Gynaecol. 2020;65:32–45. doi: 10.1016/j.bpobgyn.2020.02.010. [DOI] [PubMed] [Google Scholar]
- 52.Dauvilliers Y., Tafti M., Landolt H.P. Catechol-O-methyltransferase, dopamine, and sleep-wake regulation. Sleep Med. Rev. 2015;22:47–53. doi: 10.1016/j.smrv.2014.10.006. [DOI] [PubMed] [Google Scholar]
- 53.Bastos P., Gomes T., Ribeiro L. Catechol-O-Methyltransferase (COMT): an update on its role in cancer, neurological and cardiovascular diseases. Rev. Physiol. Biochem. Pharmacol. 2017;173:1–39. doi: 10.1007/112_2017_2. [DOI] [PubMed] [Google Scholar]
- 54.Kurman R.J. Origin and molecular pathogenesis of ovarian high-grade serous carcinoma. Ann. Oncol. 2013;24:x16–x21. doi: 10.1093/annonc/mdt463. [DOI] [PubMed] [Google Scholar]
- 55.Labidi-Galy S.I., Papp E., Hallberg D., Niknafs N., Adleff V., Noe M., Bhattacharya R., Novak M., Jones S., Phallen J., et al. High grade serous ovarian carcinomas originate in the fallopian tube. Nat. Commun. 2017;8:1093. doi: 10.1038/s41467-017-00962-1. [DOI] [PMC free article] [PubMed] [Google Scholar]
- 56.Carlson J.W., Miron A., Jarboe E.A., Parast M.M., Hirsch M.S., Lee Y., Muto M.G., Kindelberger D., Crum C.P. Serous tubal intraepithelial carcinoma: its potential role in primary peritoneal serous carcinoma and serous cancer prevention. J. Clin. Oncol. 2008;26:4160–4165. doi: 10.1200/JCO.2008.16.4814. [DOI] [PMC free article] [PubMed] [Google Scholar]
- 57.Li T.C., Ling E., Dalton C., Bolton A.E., Cooke I.D. Concentration of endometrial protein PP14 in uterine flushings throughout the menstrual cycle in normal, fertile women. Br. J. Obstet. Gynaecol. 1993;100:460–464. doi: 10.1111/j.1471-0528.1993.tb15272.x. [DOI] [PubMed] [Google Scholar]
- 58.Xiao Y., Sun X., Yang X., Zhang J., Xue Q., Cai B., Zhou Y. Leukemia inhibitory factor is dysregulated in the endometrium and uterine flushing fluid of patients with adenomyosis during implantation window. Fertil. Steril. 2010;94:85–89. doi: 10.1016/j.fertnstert.2009.03.012. [DOI] [PubMed] [Google Scholar]
- 59.Bijlsma S., Bobeldijk I., Verheij E.R., Ramaker R., Kochhar S., Macdonald I.A., van Ommen B., Smilde A.K. Large-scale human metabolomics studies: a strategy for data (pre-) processing and validation. Anal. Chem. 2006;78:567–574. doi: 10.1021/ac051495j. [DOI] [PubMed] [Google Scholar]
- 60.Chan E.C.Y., Pasikanti K.K., Nicholson J.K. Global urinary metabolic profiling procedures using gas chromatography-mass spectrometry. Nat. Protoc. 2011;6:1483–1499. doi: 10.1038/nprot.2011.375. [DOI] [PubMed] [Google Scholar]
- 61.Olive P.L., Banáth J.P. The comet assay: a method to measure DNA damage in individual cells. Nat. Protoc. 2006;1:23–29. doi: 10.1038/nprot.2006.5. [DOI] [PubMed] [Google Scholar]
- 62.Xie B., Liang X., Yue W., Ma J., Li X., Zhang N., Wang P., Liu C., Shi X., Qiao J., et al. Targeting cytokinesis bridge proteins to kill high-CIN type tumors. Fundam. Res. 2021;1:752–766. doi: 10.1016/j.fmre.2021.08.015. [DOI] [Google Scholar]
- 63.Li H., Durbin R. Fast and accurate short read alignment with Burrows-Wheeler transform. Bioinformatics. 2009;25:1754–1760. doi: 10.1093/bioinformatics/btp324. [DOI] [PMC free article] [PubMed] [Google Scholar]
- 64.Li H., Handsaker B., Wysoker A., Fennell T., Ruan J., Homer N., Marth G., Abecasis G., Durbin R., 1000 Genome Project Data Processing Subgroup The sequence alignment/map format and SAMtools. Bioinformatics. 2009;25:2078–2079. doi: 10.1093/bioinformatics/btp352. [DOI] [PMC free article] [PubMed] [Google Scholar]
- 65.McKenna A., Hanna M., Banks E., Sivachenko A., Cibulskis K., Kernytsky A., Garimella K., Altshuler D., Gabriel S., Daly M., DePristo M.A. The Genome Analysis Toolkit: a MapReduce framework for analyzing next-generation DNA sequencing data. Genome Res. 2010;20:1297–1303. doi: 10.1101/gr.107524.110. [DOI] [PMC free article] [PubMed] [Google Scholar]
- 66.Wang K., Li M., Hakonarson H. ANNOVAR: functional annotation of genetic variants from high-throughput sequencing data. Nucleic Acids Res. 2010;38:e164. doi: 10.1093/nar/gkq603. [DOI] [PMC free article] [PubMed] [Google Scholar]
- 67.Borowicz S., Van Scoyk M., Avasarala S., Karuppusamy Rathinam M.K., Tauler J., Bikkavilli R.K., Winn R.A. The soft agar colony formation assay. J. Vis. Exp. 2014 doi: 10.3791/51998. [DOI] [PMC free article] [PubMed] [Google Scholar]
- 68.Moore R.G., McMeekin D.S., Brown A.K., DiSilvestro P., Miller M.C., Allard W.J., Gajewski W., Kurman R., Bast R.C., Jr., Skates S.J. A novel multiple marker bioassay utilizing HE4 and CA125 for the prediction of ovarian cancer in patients with a pelvic mass. Gynecol. Oncol. 2009;112:40–46. doi: 10.1016/j.ygyno.2008.08.031. [DOI] [PMC free article] [PubMed] [Google Scholar]
Associated Data
This section collects any data citations, data availability statements, or supplementary materials included in this article.
Supplementary Materials
Data Availability Statement
All raw files and search results for mass spectrometry of metabolomics have been deposited in MetaboLights (https://www.ebi.ac.uk/metabolights) with the identification No. MTBLS4861. Whole genome sequencing (WGS) data of T1074, SKOV3, and A2780 cells reported in this study have been deposited in the genome sequence archive of Beijing Institute of Genomics, Chinese Academy of Sciences, Beijing, China (https://ngdc.cncb.ac.cn/, BioProject accession no. PRJCA009525). Any additional information required to reanalyze the data reported in this paper is available from the lead contact upon request.