

Abstract
Identification of CD8+ T-cell epitopes is critical for the development of immunotherapeutics. Existing methods for MHC class I ligand discovery are time-intensive, specialized and unable to interrogate specific proteins on a large scale. Here we present EpiScan, which uses surface MHC class I levels as a readout for whether a genetically encoded peptide is an MHC class I ligand. Predetermined starting pools comprising >100,000 peptides can be designed using oligonucleotide synthesis, permitting large-scale MHC class I screening. We exploit this programmability of EpiScan to uncover an unappreciated role for cysteine that increases the number of predicted ligands by 9-21%, reveal affinity hierarchies by analysis of biased-anchor peptide libraries, and screen viral proteomes for MHC class I ligands. Using these data, we generate and iteratively refine peptide binding prediction predictions to create EpiScan Predictor. EpiScan Predictor performs comparably to other state-of-the-art MHC class I peptide binding prediction algorithms without suffering from underrepresentation of cysteine-containing peptides. Thus, targeted immunopeptidomics using EpiScan will accelerate CD8+ T-cell epitope discovery towards the goal of patient-specific immunotherapeutics.
The presentation of intracellular peptides in the context of major histocompatibility complex class I (MHC class I) molecules on the cell surface allows surveilling cytotoxic CD8+ T cells to identify pathogen-infected or malignant cells1. Most peptides bound to MHC class I molecules are derived from the degradation of intracellular proteins by the proteasome2; these peptides are pumped into the endoplasmic reticulum (ER) by the TAP transporter where they can be further processed and loaded onto MHC class I3. Peptide ligands for MHC class I can also be derived from lysosomal protein degradation4,5 and through the action of proteases in the cytosol or ER.
A better understanding of the rules governing peptide binding by MHC class I molecules would facilitate the development of more effective vaccines and other immune-based therapies, but this task is complicated by the diverse array of MHC class I molecules (HLA-A, -B, -C, -E, and -G) expressed in human cells and their highly polymorphic nature across the human population6. Given that MHC class I peptide ligands are typically 8-12 amino acids in length, and an individual may have up to six unique HLA-I alleles, the theoretical diversity of an individual’s immunopeptidome is over one billion7.
Mass spectrometry (MS) is currently the most dependable and accurate method for identifying MHC class I ligands, with large-scale experiments capable of identifying roughly a thousand peptides eluted from any given HLA-I allele product8. One key limitation, however, is that MS-based approaches must inevitably sample peptides derived from the entire cellular proteome; the presence of thousands of self-peptides means it is statistically challenging to confidently identify the spectra of potential T cell epitopes generated from a particular pathogen, for example, or the potential neo-antigens presented by a particular patient’s tumor. Biochemical reconstitution of the MHC class I complex can generate precise measurement of the affinity of diverse peptide ligands, including those with post-translational modifications (PTMs), but solid-phase peptide synthesis (SPPS) is costly and limited in throughput9,10. Similarly, the throughput of cell-based MHC class I stabilization assays is limited due to their reliance on SPPS11–13. Thus, we developed EpiScan, an alternative approach that is both high-throughput and permits targeted immunopeptidomics.
Results
Development of EpiScan
EpiScan is a genetic platform that allows for the high-throughput identification of peptides that bind MHC class I molecules from within a defined starting pool. EpiScan relies on the well-established principle that MHC class I molecules are only trafficked to, and maintained on, the cell surface after stably binding a high-affinity peptide in the endoplasmic reticulum (ER) (Fig. 1a)13. In the absence of the TAP complex, which pumps proteasomally-derived peptide fragments into the ER lumen14, peptide loading onto MHC class I molecules is impaired and cell surface MHC class I levels are markedly reduced (Fig. 1b). Under these conditions, we reasoned that the introduction of a single exogenous high-affinity MHC class I peptide ligand into the ER should restore cell surface MHC class I levels, thereby permitting the binding of individual peptides to MHC class I molecules to be assayed by flow cytometry15 (Fig. 1c,d).
Fig. 1. Genetic identification of MHC class I ligands using the EpiScan platform.
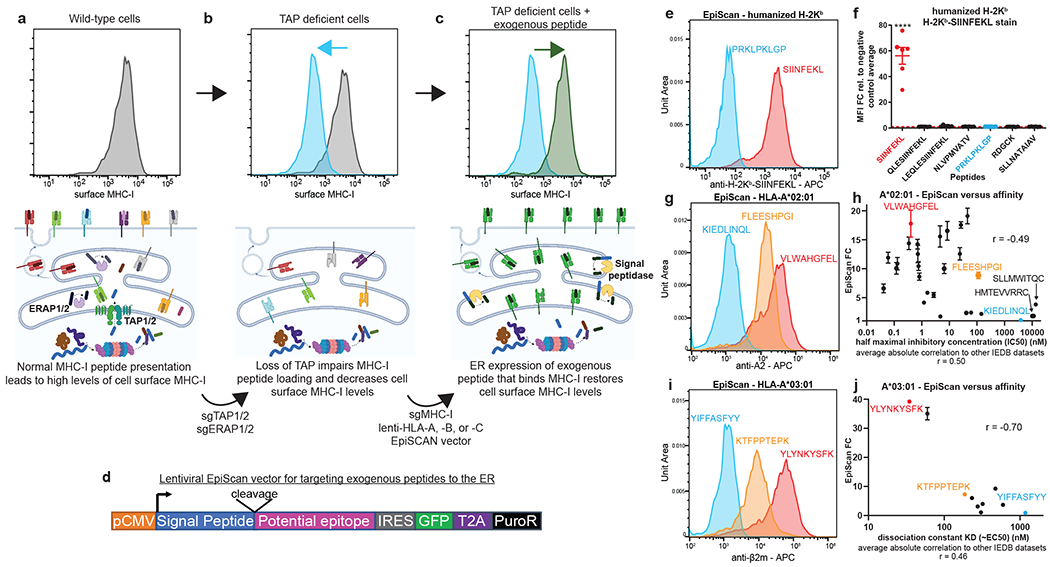
(a-d) Schematic representation of the EpiScan approach. In wild-type cells (a), proteasome-derived peptides are imported into the ER by the TAP complex, trimmed by the N-terminal peptidases ERAP1 and ERAP2 and loaded onto MHC class I molecules for presentation on the cell surface. In the absence of TAP (b), however, MHC class I peptide loading is impaired; empty MHC class I molecules remain in the ER and cell surface MHC class I levels decrease. Under these conditions, delivery of exogenous peptide into the ER that binds MHC class I restores cell surface MHC class I levels (c). Exogenous peptides are targeted to the ER using the lentiviral EpiScan vector (d), which expresses a putative MHC class I ligand downstream of a signal peptide.
(e-j) Validation of the EpiScan approach. EpiScan cells expressing either a humanized H-2Kb allele (e and f), HLA-A*02 (g and h) or HLA-A*03 (i and j) were transduced with the EpiScan vector expressing the indicated peptides and cell surface MHC class I levels were measured by flow cytometry. Representative histograms are shown in (e), (g) and (i); the data shown in (f), (h) and (j) represent the mean ± SEM of the fold change in mean fluorescence intensity (MFI) relative to the average of the negative controls for that experiment. Peptides shown in blue represent negative controls; peptides shown in red or orange represent positive controls. Peptides are color-coded such that histograms display representative data of the corresponding plot results. (f) Each dot represents a different biological replicate, n = 6. (****p < 0.0001 relative to the PRKLPKLGP negative control peptide, one-way ANOVA with Dunnett’s multiple-comparison test). (h and j) EpiScan data is compared to IEDB affinity data with the Spearman correlation shown on the graph. Below is the average absolute correlation of the affinity data shown relative to other IEDB datasets with the same peptides. For (h), n = 4 independent biological replicates. For (j), n = 3 independent biological replicates.
We validated the EpiScan platform using the model ovalbumin antigen, SIINFEKL. Using CRISPR/Cas9-mediated gene disruption, we isolated a HEK 293T clone (henceforth ‘EpiScan cells’) lacking MHC class I (HLA-A, -B, -C), TAP, and the ER-resident metallopeptidases ERAP1 and ERAP216,17 (Extended Data Fig. 1a–d). We subsequently re-expressed a single MHC class I allele, a humanized version of the murine H-2Kb wherein the beta-2-microglobulin (B2M) interacting domain was replaced with the human equivalent, and examined whether exogenous delivery of the SIINFEKL peptide into the ER would restore cell surface MHC class I levels. Using an expression construct containing the signal peptide from the gp70 gene of mouse mammary tumor virus18 (Extended Data Fig. 1e), we found that exogenous expression of SIINFEKL, but not a variety of control peptides, increased cell surface MHC class I levels (Fig. 1e,f and Extended Data Fig. 2a,b)19. In addition, we obtained similar results using the common human MHC class I alleles HLA-A*02 and HLA-A*03 with corresponding positive control peptides (Extended Data Fig. 2c,d). Furthermore, all of the EpiScan results were consistent with peptide media addition experiments in TAP-deficient cells12 (Extended Data Fig. 2d–f).
Peptidase activity in the ER could adversely affect the performance of EpiScan: destruction of the exogenous peptide would reduce the sensitivity of the assay, while partial proteolysis could generate false positives as a processed form of the peptide - and not the genetically-encoded peptide itself - might bind to MHC class I. Thus we also chose to mutate the genes encoding peptidases ERAP1 and ERAP2, which trim antigenic peptides from their N-termini to generate fragments of the optimal size for MHC class I binding (8-12-mers)16,17. To verify the loss of the activity of these enzymes in EpiScan cells we expressed N-terminally extended versions of our positive control peptides, reasoning that these should not result in increased surface MHC class I levels in the absence of N-terminal peptidase activity. Indeed, N-terminally extended versions of SIINFEKL or NLVPMVATV, a peptide derived from the pp65 gene of human cytomegalovirus, did not lead to increased MHC class I surface staining in either humanized-H-2Kb- or HLA-A*02-expressing EpiScan cells (Extended Data Fig. 3a–c). Genetic complementation with exogenous ERAP1 or ERAP2 led to a restoration of cell surface MHC class I levels upon expression of the N-terminally extended peptides, confirming that the effect was due to a lack of ERAP1/2 activity (Extended Data Fig. 3a–c).
MHC class I chaperones, such as TAPBP and TAPBR, play an important role in assembly and peptide selection of MHC class I20. Furthermore, TAP1/2 directly interact with these and other chaperones. Therefore, we wanted to test whether increased expression of TAPBP or TAPBPR, or addition of catalytically inactive TAP1/2, could improve EpiScan signal. Interestingly, the primary difference upon expression of the chaperones was an increase in the surface MHC class I when negative control peptides were expressed (Extended Data Fig. 3d), and little difference in surface MHC class I with positive control peptides (Extended Data Fig. 3e). As a result, EpiScan cells without any additional chaperone expression had the best signal to noise ratio (Extended Data Fig. 3f).
Imprecise signal peptide cleavage could also lead to false positives in the EpiScan assay, and so we sought to challenge the system with exogenous peptides that would be most likely to be cleaved at the improper location. As the gp70 signal peptide ends with a glycine residue, we selected three HLA-A*02 peptide ligands that commenced with glycine for detailed characterization. In addition to the wild-type 9-mer peptides, we also tested 8-mer variants in which the initial glycine residue was removed and 10-mer variants in which an additional glycine was added (Extended Data Fig. 3g,h). If signal peptidase cleavage is precise and consistent, then only expression of the wild-type 9-mer peptides should increase cell surface MHC class I levels in the EpiScan assay. However if signal peptidase cleavage occurs “early”, such that the terminal glycine residue of the signal peptide remains on the liberated HLA-I peptide ligand, then the 8-mer variants should increase cell surface MHC class I in the EpiScan assay; conversely, if signal peptidase cleavage occurs “late”, removing an additional glycine, then the 10-mer variant should increase cell surface MHC class I. Reassuringly we observed that only the wild-type version of the peptides led to increased surface MHC class I (Extended Data Fig. 3h), demonstrating that precise signal peptidase cleavage occurs even for these challenging substrates.
To examine the sensitivity of EpiScan, we tested a series of peptides with HLA-A*02 and HLA-A*03 for which there was known affinity as well as stability data in the Immune Epitope Database (IEDB)21. We saw that EpiScan data from both alleles correlated at least as well with their respective IEDB affinity datasets as those datasets correlated with all other available IEDB datasets (11 for A*02 and six for A*03) (Fig. 1g–j, Extended Data Fig. 3i, Supplementary Table 1, and Source Data 1). Peptides with affinity of 600nm and lower scored positively with EpiScan. Two apparent false positives for A*02 were cysteine-ended peptides for which IEDB binding affinity values were ≥ 10 μM. However, it has been previously shown that cysteine oxidation, and resultant disulfide-linked peptide multimers, can interfere within vitro binding affinity measurements22. Thus, we believe EpiScan more accurately reflects the affinity of these peptides for A*02. Altogether, these data demonstrate that EpiScan constitutes an accurate and robust system for the identification of high-affinity MHC class I peptide ligands.
High-throughput MHC class I ligand discovery using EpiScan
Having optimized and validated the EpiScan platform using individual peptides, we sought to implement the approach for high-throughput screening to identify MHC class I peptide ligands at scale (Fig. 2a). We synthesized a pool of oligonucleotides encoding random 9-mer peptides and cloned them into the EpiScan vector, resulting in a library of ~500,000 unique 9-mer sequences. The library was packaged into lentiviral particles and introduced into EpiScan cells expressing a single HLA allele at low multiplicity of infection (MOI), such that, following puromycin selection to remove untransduced cells, each cell in the remaining population expressed a single 9-mer peptide (Extended Data Fig. 4a). As expected, only a small percentage of these cells exhibited cell surface MHC class I levels above those of the untransduced cells (Fig. 2a and Extended Data Fig. 4b–j), consistent with the notion that only a small fraction (~0.1%) of all possible 9-mer peptides bind any given HLA allele21,23. This positive population was then partitioned into four bins based on the degree of positivity via fluorescence-activated cell sorting (FACS), followed by genomic DNA extraction, PCR amplification of the EpiScan construct, and next-generation sequencing to identify the enriched peptides. We confirmed that the FACS did indeed enrich for cells expressing MHC class I ligands, as, after recovery and expansion, the sorted cells retained elevated surface MHC class I (Extended Data Fig. 4b–j).
Fig. 2. EpiScan pooled screening allows high-throughput MHC class I ligand discovery.
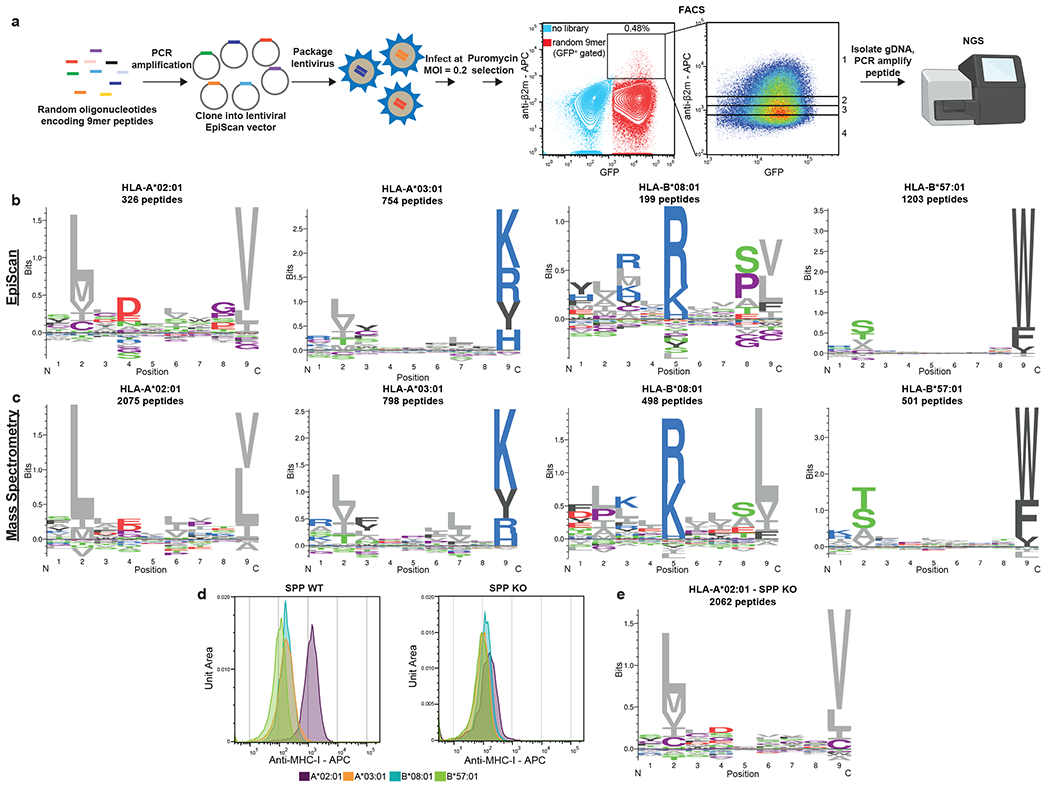
(a) Schematic representation of the screening procedure. A pool of random oligonucleotides encoding 9-mer peptides were cloned into the EpiScan lentiviral vector and introduced into EpiScan cells expressing a single HLA allele. Cells expressing exogenous peptides binding MHC class I that hence exhibited elevated cell surface MHC class I levels were isolated by FACS and the identity of the peptides revealed by next-generation sequencing. The left dot plot displays two separate samples; light blue dots represent negative control EpiScan cells prior to transduction, while red dots show EpiScan cells expressing the library of exogenous peptides.
(b and c) EpiScan screens recapitulate known binding preferences for common MHC class I alleles. Logoplots summarize the sequences of the MHC class I ligands identified by EpiScan (b); for comparison, analogous logoplots based on MHC class I ligands identified by mass spectrometry8 are shown in (c).
(d) Histograms show cell surface MHC class I levels on EpiScan cells expressing the indicated MHC class I alleles with (left) or without (right) SPP.
(e) Logoplot summarizing the composition of the HLA-A*02:01 ligands identified by EpiScan screens using SPP-deficient EpiScan cells.
To validate the utility of the EpiScan screening approach, we asked if the sequences of the peptide ligands recapitulated the known preferences of four common, well studied, MHC class I alleles: HLA-A*02, HLA-A*03, HLA-B*08 and HLA-B*57. In each case, the sequences of the high-confidence peptides identified by EpiScan closely mirrored those of the corresponding sequences identified by mass spectrometry8 (Fig. 2b,c and Source Data 2). For this analysis, the sorting bins were treated as replicate experiments and high-confidence MHC class I binders were identified based on enrichment relative to input, with reproducible enrichments across bins used as an additional threshold for some alleles (see Methods).
We further validated our EpiScan screening approach by investigating the underlying cause of abacavir hypersensitivity syndrome. Abacavir is an HIV reverse transcriptase inhibitor that causes hypersensitivity in around 5% of patients24. Predisposition to abacavir hypersensitivity reactions is strongly associated with HLA*B57:01, and crystal structures show abacavir binding in the peptide binding groove of HLA*B57:0125,26. Screening our library of random 9-mer peptides in HLA-B*57-expressing EpiScan cells in the presence and absence of abacavir yielded both overlapping and distinct sets of binding peptides (Extended Data Fig. 4k,l and Supplementary Table 2). Consistent with previous mass spectrometry-based studies25,26, the primary difference between the two conditions occurs at the C-terminal anchor position: the frequency of the two most common residues, tryptophan and phenylalanine, decreased upon abacavir treatment, while the frequency of valine, leucine, isoleucine, and glycine increased (Extended Data Fig. 4k,l and Supplementary Table 2). These changes ranged from 0.5-10% differences in amino acid usage. Such differences would create a substantial number of novel peptides displayed by HLA*B57:01, and hence may explain the widespread T cell activation elicited in the hypersensitivity reaction. Thus, EpiScan is capable of detecting subtle changes in MHC class I binding specificity and can be further exploited to investigate autoimmunity and the interactions of drugs with the immune system.
Signal peptide peptidase (SPP) loss improves HLA-A*02 EpiScan
In the absence of exogenous peptide expression, we noticed that there was substantially more residual MHC class I on the surface of EpiScan cells expressing HLA-A*02 relative to the other HLA-I alleles (Fig. 2d). Previous observations of high HLA-A*02 background in TAP-deficient cells determined that peptides derived from signal peptides bind HLA-A*0227,28. One potential route through which these peptides could be generated is via signal peptide peptidase (SPP, encoded by the HM13 gene), an enzyme responsible for intramembrane cleavage of signal peptides which have been released from secretory proteins by signal peptidase (SP)29. Thus, we generated SPP knockout (KO) EpiScan cells in which HM13 was also disrupted (Extended Data Fig. 1f). Upon introduction of exogenous MHC class I alleles but in the absence of exogenous expression of MHC class I ligands, SPP KO EpiScan cells generally displayed less surface MHC class I relative to wild-type cells (Fig. 2d). The difference was especially pronounced for HLA-A*02, which prefers aliphatic amino acids such as leucine and valine8 that are commonly found in the hydrophobic region of signal peptides30. However, when comparing the fold change for positive control peptides relative to negative control peptides in our EpiScan assay, only for the HLA-A*02 allele was there a clear benefit resulting from a lack of SPP (Supplementary Fig. 1).
We therefore repeated our EpiScan screen of the random 9-mer library for the HLA-A*02 allele using the SPP KO EpiScan cells. The lack of SPP resulted in only subtle changes in the amino acid composition of HLA-A*02 ligands, but, consistent with the enhanced signal-to-background in SPP KO cells (Extended Data Fig. 4m), we were able to identify many more peptides as high-confidence HLA-A*02 binders (Fig. 2e). We anticipate that ablation of SPP KO will be crucial to improve the sensitivity of EpiScan for other MHC class I alleles that prefer amino acids commonly found in signal peptides.
EpiScan versus mass spectrometry for MHC class I ligand discovery
Mass spectrometry (MS) represents the current best-in-class method for high-throughput MHC class I immunopeptidomics, thus we wanted to scrutinize the differences between EpiScan and MS in an unbiased manner. First, we generated a position-specific frequency matrix (PSFM), which contains the frequency of occurrence of amino acids at each position, for each result, and used unsupervised clustering of the PSFMs to examine the similarities between the MHC class I ligands identified by MS and EpiScan. The clustering indicated that the differences between alleles was greater than the differences between the two methodologies (Fig. 3a). Additionally, we noticed correlation between HLA-A*02 and HLA-B*08, and to a lesser extent, HLA-A*02 and HLA-A*03, evidence for the potential for the allele molecules to share peptide ligands – several of which we validated with individual EpiScan assays (Extended Data Fig. 4n).
Fig. 3. EpiScan and mass spectrometry represent complementary approaches for MHC class I ligand identification.
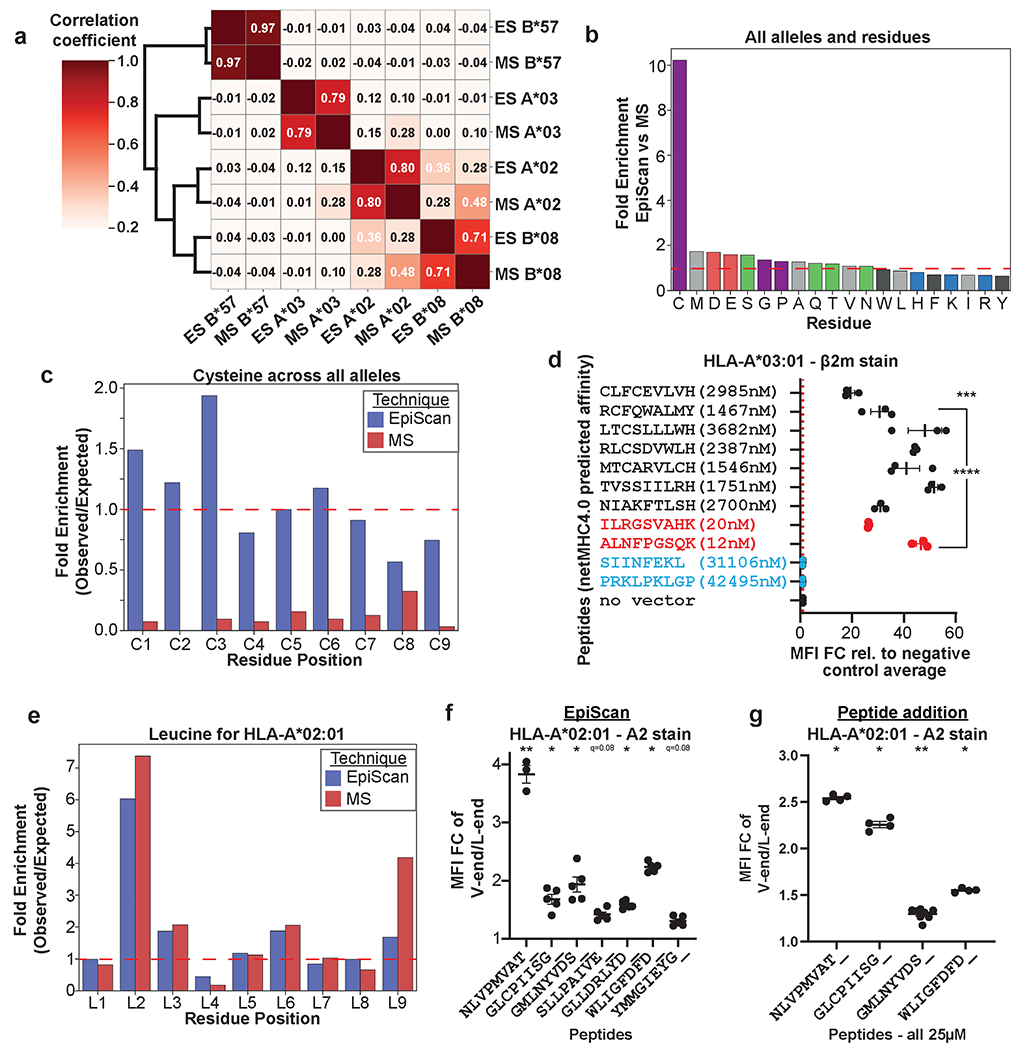
(a) EpiScan- and MS-identified peptides reveal similar MHC class I binding preferences. Clustergram represents the pairwise correlation coefficients comparing the MHC class I ligands identified by EpiScan (ES) and MS; correlations were calculated by linearizing a matrix of amino acid frequencies for each of the nine positions of the peptides after normalization for background amino acid frequency for the EpiScan random 9mer library or the human proteome.
(b and c) Effective detection of cysteine-containing MHC class I ligands by EpiScan. (b) Cysteine is greatly enriched among MHC class I ligands identified by EpiScan compared to MS. (c) Cysteine is observed at approximately the expected frequency across MHC class I ligands identified by EpiScan, while it is depleted across all positions if MS-identified MHC class I ligands.
(d) Individual EpiScan validation that cysteine-containing peptides bind HLA-A*03. The indicated peptides, that were not predicted to bind HLA-A*03 by NetMHC, were introduced into HLA-A*03-expressing EpiScan cells and cell surface MHC class I levels measured by flow cytometry. Positive and negative control peptides are shown in red and blue respectively. Data are represented as mean ± SEM of the fold change in mean fluorescence intensity (MFI) relative to the average of two negative control peptides, PRKLPKLGP and SIINFEKL. Each dot represents a different biological replicate, n = 3. ***p = 0.008, ****p < 0.0001 for each group relative to SIINFEKL by one-way ANOVA with Dunnett’s multiple-comparison test.
(e-g) Comparison of the affinity of L- and V-ended 9mers for HLA-A*02. (e) Leucine is more frequently observed in the 9th position in MS data than in EpiScan data. V-ended 9mer peptides increase surface MHC class I levels in EpiScan cells expressing HLA-A*02 following either the exogenous peptide expression through lentiviral EpiScan vector transduction (f) or addition of synthesized peptides to the medium (g). Data are represented as mean ± SEM of the fold change in MFI of V-ended peptides over L-ended peptides. Dots represent different biological replicates, for (f) n = 5 except for NLVPMVAT_ n =3, and for (g) n = 4 except for GMLNYVDS_ n = 8. *q < 0.05, **q < 0.01 for V-ended versus L-ended peptides via Mann-Whitney U-test with two-stage step-up (Benjamini, Krieger, and Yekutieli) multi-hypothesis correction.
For all four MHC class I alleles we noticed differences between the peptide binding preferences as determined by EpiScan and MS (Figs. 2b,c and 3b). With the exception of anchor positions, one would expect that the overall representation of amino acids in MHC class I ligands should closely mirror their frequency in the proteome; however, even after normalizing for the differences in amino acid frequencies in our 9-mer randomer peptide library compared to the human proteome, cysteine was greatly enriched across all peptide positions among the MHC class I peptide ligands identified by EpiScan versus those identified by MS (Fig. 3c and Extended Data Fig. 5). As a result of its varied in vivo modifications and its propensity for oxidation during sample preparation, cysteine-containing peptides are known to be difficult to identify by MS31. Indeed, cysteine was present at roughly the expected frequency across the MHC class I ligands detected by EpiScan but was dramatically depleted (5- to 10-fold) among peptides identified by MS (Fig. 3c). Notably, these differences are present despite the use of iodoacetamide to reduce and alkylate cysteine to prevent it from unwanted modification during MS sample preparation, and the inclusion of carbamidomethylation modification of cysteine in their spectral database search8. To further validate these findings, we selected a panel of high-confidence HLA-A*03 ligands detected by EpiScan that (1) contained cysteine residues and (2) were not predicted to bind by NetMHC4.0 or MSi, the HLAthena model based only on intrinsic peptide features (Supplementary Table 3)8,32,33 and performed individual EpiScan assays: all of the peptides increased surface MHC class I levels at least 20-fold compared to negative controls (Fig. 3d). Thus, we conclude that EpiScan can be used to detect cysteine-containing peptides that are otherwise underrepresented in MS-based datasets of MHC class I ligands.
Among other noticeable differences in amino acid preferences between EpiScan and MS are a relative increase of valine at the expense of leucine in the last position for HLA-A*02 in EpiScan (Figs. 2b,c and 3e), and the abundance of proline at the penultimate position for HLA-A*02 and HLA-B*08 in EpiScan (Extended Data Fig. 5a–d, Supplementary Table 4). Proteasome cleavage is strongly disfavored downstream of proline residues34,35; thus the position-specific enrichment of proline emphasizes that peptide ligands are detected by EpiScan solely on the basis of MHC class I affinity, whereas the endogenous MHC class I ligands detected by mass spectrometry approaches are impacted by proteasome cleavage preferences. To examine the differences in leucine representation at the last position of HLA-A*02 between EpiScan and MS, we compared a series of 9-mer peptides for which the first eight residues were identical but the last was either valine (V) or leucine (L). In all cases, the V-ended 9-mer resulted in more surface HLA-A*02 relative to the L-ended 9-mer when tested by EpiScan (Fig. 3f), or exogenous peptide addition experiments (Fig. 3g). These results were also confirmed by in vitro peptide binding experiments (Extended Data Fig. 5e). This suggests that V-ended peptides generally bind HLA-A*02 better than L-ended peptides, and that our EpiScan data accurately reflects this difference. Why MS detects a greater abundance of leucine despite lower affinity relative to valine is unclear: the difficulty in detecting cysteine could partially contribute to an inflated proportion of leucine, but the difference could also involve subtle differences in gene expression, proteasome cleavage specificity, TAP transporter specificity, other MS sample preparation or detection issues, or other yet to be discovered factors.
EpiScan reveals CD8+ T cell epitopes from human pathogens
A key advantage of EpiScan over MS-based approaches is that it permits the targeted identification of MHC class I ligands from a defined pool of potential epitopes. Thus, we sought to test the ability of EpiScan to identify disease-relevant MHC class I ligands in a well-studied human pathogen. SARS-CoV-2 has spread rapidly across the globe; as of early March 2022, SARS-CoV-2 had caused over 462 million confirmed infections and was responsible for over 6 million deaths (https://coronavirus.jhu.edu/map.html). Outcomes resulting from SARS-CoV-2 infection vary greatly for individuals36, and recent work has shown that a robust T cell response is correlated with favorable outcomes36–41. Furthermore, patients with agammaglobulinemia, who are unable to generate mature B cells, are able to recover from COVID-1942–44.
We synthesized an oligonucleotide library encoding all possible 9-, 10- and 11-mer peptides covering 11 different strains of SARS-CoV-2 (a total of ~30,000 sequences), and performed a series of EpiScan screens using a panel of cell lines expressing 11 of the most common HLA-I alleles (Fig. 4a–c). Using next-generation sequencing, we compared the representation of peptide sequences in the input samples versus the samples sorted for high surface MHC class I. We identified high-confidence binders for each allele tested from every open reading frame (ORF) of the virus (Fig. 4d, e and Source Data 3). Overall, 10- and 11-mer peptides made up a larger proportion of binders, at the expense of 9-mers, than typically seen via MS8,23. The number of hits per ORF increased with the length of the ORF (Fig. 4e). Notably, approximately one-quarter of all ligands identified contained one or more cysteine residues, which would likely have escaped detection by MS-based approaches (Fig. 4f). We found 78 high-confidence binders derived from the spike glycoprotein (S) across 10 of the alleles screened (Fig. 4e), and 104 potential epitopes across the entire virus for HLA-A*02 alone, the most common MHC class I allele (Fig. 4f and Extended Data Fig. 6a). Individual EpiScan experiments validated 100% of the candidate ligands for HLA-A*02 (21/21; Extended Data Fig. 7b) and HLA-A*24:02 (9/9; Extended Data Fig. 6c,d), half of which were 10- and 11-mer peptides. In addition, we validated seven A03:01 peptides for which there was a least one less-common amino acid at an anchor position (Extended Data Fig. 6e).
Fig. 4. Comprehensive identification of MHC class I ligands expressed by SARS-CoV-2.
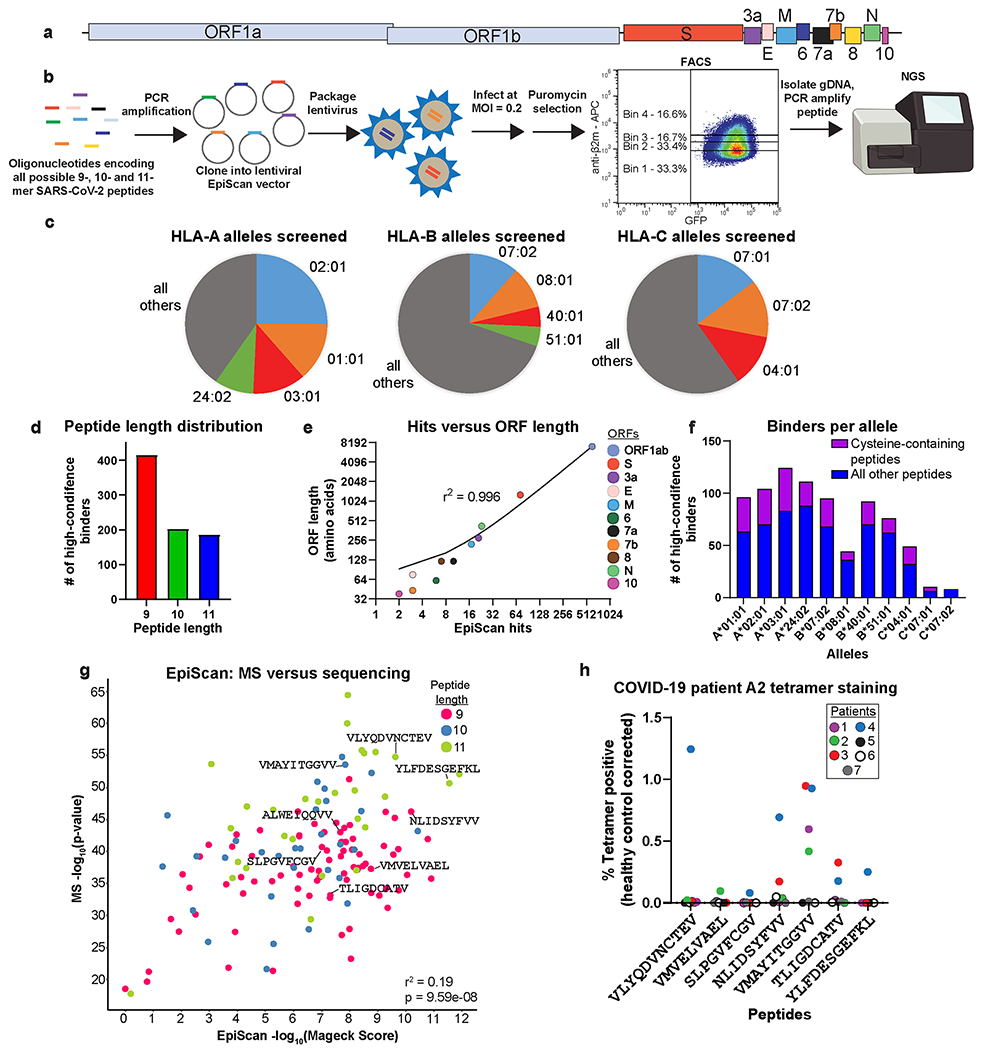
(a-f) EpiScan analysis of the SARS-CoV-2 immunopeptidome. All possible 9-, 10- and 11-mer peptides encoded by the SARS-CoV-2 genome (a) were synthesized via an oligonucleotide array, cloned into the lentiviral EpiScan vector, and MHC class I ligands identified by the EpiScan screening procedure described previously (b). In total, 11 alleles were screened; the proportion of the US population represented by these alleles is indicated in (c). (d) Peptide length distribution of hits from all alleles. (e) ORF length versus high-confidence binders per ORF. R-squared value is derived from the linear regression goodness of fit. (f) The number of high-confidence binders per allele; cysteine-containing peptides are highlighted in purple.
(g) Comparison of HLA-A*02:01 SARS-CoV2 peptides identified by mass spectrometry of EpiScan cells sorted for high MHC class I levels to EpiScan screen results. R-squared value was derived from the linear regression goodness of fit. P-value was calculated via Spearman correlation.
(h) Convalescent COVID-19 patients harbor CD8+ T cells specific for HLA-A*02 ligands identified by EpiScan. Dot plot values represent the percent tetramer positive CD8+ T cells from convalescent COVID-19 (n = 7) expressed relative to the mean value of the COVID-19 negative samples (n = 4). Each dot represents a different COVID-19 patient sample.
Given the role of S mutations in the transmissibility, disease progression, and vaccine evasion of SARS-CoV-2 strains45, we wanted to use EpiScan to more closely examine S peptides, and their common variants, for binding to HLA-A*02. We made an EpiScan library encoding all possible 8- through 12-mer peptides for the original S sequence and the top 250 most common mutations. We did not find a bias toward spike mutations eliminating possible HLA-A*02 T cell epitopes, as more mutations improved HLA-A*02 binding than worsened it (Extended Data Fig. 7a,b and Source Data 4). Additionally, the wildtype and mutant peptides containing the variant of concern mutations D614G and A701V both bound to HLA-A*02.
As additional validation of HLA-A*02 binders across the entire virus, we subjected sorted EpiScan cells to MS for MHC-binding peptides and found that of the 224 9- to 11-mer peptides identified, 164 were SARS-CoV-2 peptides (Fig. 4g and Source Data 5). Using the combined approach of EpiScan and MS we found roughly 70x more viral peptides per MS run than traditional approaches46. In contrast to the traditional MS analysis that identified 29 SARS-CoV-2 peptides of which only 2 contained cysteine, 21% of SARS-CoV-2 peptides in our EpiScan MS run contained cysteine, closer to the 33% observed with EpiScan for HLA-A*02. We attribute this increase in detectable cysteine-containing peptides to the high expression level of individual peptides by EpiScan cells reduces the risk that all of the cysteine is modified during sample preparation such that it would obscure the peptides from detection.
Optimal peptides for potential CD8+ T cell vaccines might be those that bind more than one HLA allele in order to be efficacious in the largest number of individuals and that are derived from regions that are evolutionarily conserved across coronaviruses to hinder viral escape47: we identified 33 peptides that bound two HLA allele gene products (Extended Data Fig. 4n and Supplementary Table 5), and 83 peptides located in highly conserved regions (Supplementary Table 6)48,49. Furthermore, peptides unique to SARS-CoV-2 among the human coronaviruses will be important for assessing T cell-based immunity, particularly in seronegative individuals (Supplementary Table 5)50,51.
Lastly, we evaluated whether COVID-19 patients mount T cell responses against these potential epitopes. For 11 of the validated HLA-A*02 ligands, we generated peptide-MHC tetramers (Supplementary Table 7) and used them to assess the prevalence of reactive CD8+ T cells in the blood of convalescent COVID-19 patients. Six of the seven patients tested had CD8+ T cells that reacted with at least one of the 11 tetramers (Fig. 4h and Extended Data 7c). In total, seven of the 11 different tetramers reacted with patient T cells. Importantly, one of these peptides, VMAYITGGVV, was not predicted to bind by NetMHC4.0, NetMHCpan4.1 or MSi (Supplementary Table 7) but reactive CD8+ T cells were readily identified in four of seven patients. Furthermore, we used GSEA to test whether our EpiScan SARS-CoV-2 data enriched for T cell reactive peptides from four previous studies using COVID-19 convalescent patient samples41,52–54. For our analysis, all SARS-CoV-2 peptides were ranked via EpiScan and “gene” sets were made up of the T cell reactive peptides for each allele. As expected, for each allele queried by EpiScan, the most enriched published T cell reactive peptide sets were those belonging to the corresponding allele (Extended Data Fig. 8 and Supplementary Table 8). The only exceptions occurred with alleles that share amino acid preferences at anchor positions, such as with HLA-B*07:02 and HLA-B*51; both alleles prefer proline in position two and small aliphatic amino acids at position nine. Although our approach is agnostic to immune responses and only evaluates peptide affinity for MHC class I, this comparison supports the notion that T cell responses are enriched for high affinity peptide:MHC class I interactions55. Our implementation of EpiScan to identify MHC class I ligands from SARS-CoV-2 represents the first effort to experimentally query all of the potential CD8 T cell epitopes from a single organism in a systematic way. The identification of conserved, high-affinity, and T cell reactive epitopes via EpiScan can enable the development of T cell-oriented vaccines and diagnostics for new and recently emerging zoonotic viruses.
Peptide binding prediction with EpiScan Predictor
An important goal in the field of immunopeptidomics is the development of computational models that can accurately predict MHC class I ligands starting from the primary sequence of a protein8,56,57. Given the differences between the MHC class I ligands identified by EpiScan and MS (Fig. 3b), we wanted to provide proof-of-principle that an effective prediction algorithm could be developed from EpiScan data. Using a neural network architecture analogous to the MSi algorithm recently developed by Sarkizova and colleagues8 (Fig. 5a), we developed EpiScan Predictor, ESP. We trained machine learning models to classify 9-mer peptide sequences as binders or non-binders for HLA-A*02, HLA-A*03, HLA-B*08 and HLA-B*57. As proposed previously8,35, we evaluated the positive predictive value (PPV) of these models based on their ability to correctly identify true binders (peptide ligands identified in the random 9-mer EpiScan screens) in the presence of a 999-fold excess of random decoys. Overall, the performance of our first-pass (ESPv1) models were roughly similar to the performance of the MSi models (as evaluated by Sarkizova and colleagues8 on their own MS dataset): ESP showed somewhat superior performance to the MSi models for the two HLA-A alleles, but inferior performance for the two HLA-B alleles8 (Fig. 5b). Because of the shared algorithmic framework of the two sets of models, these differences reflect the inherent effectiveness of the respective datasets in training the neural network and does not mean that one algorithm would be superior to another on an orthogonal dataset.
Fig. 5. Computational prediction of MHC class I ligands from EpiScan data and assessment of performance.
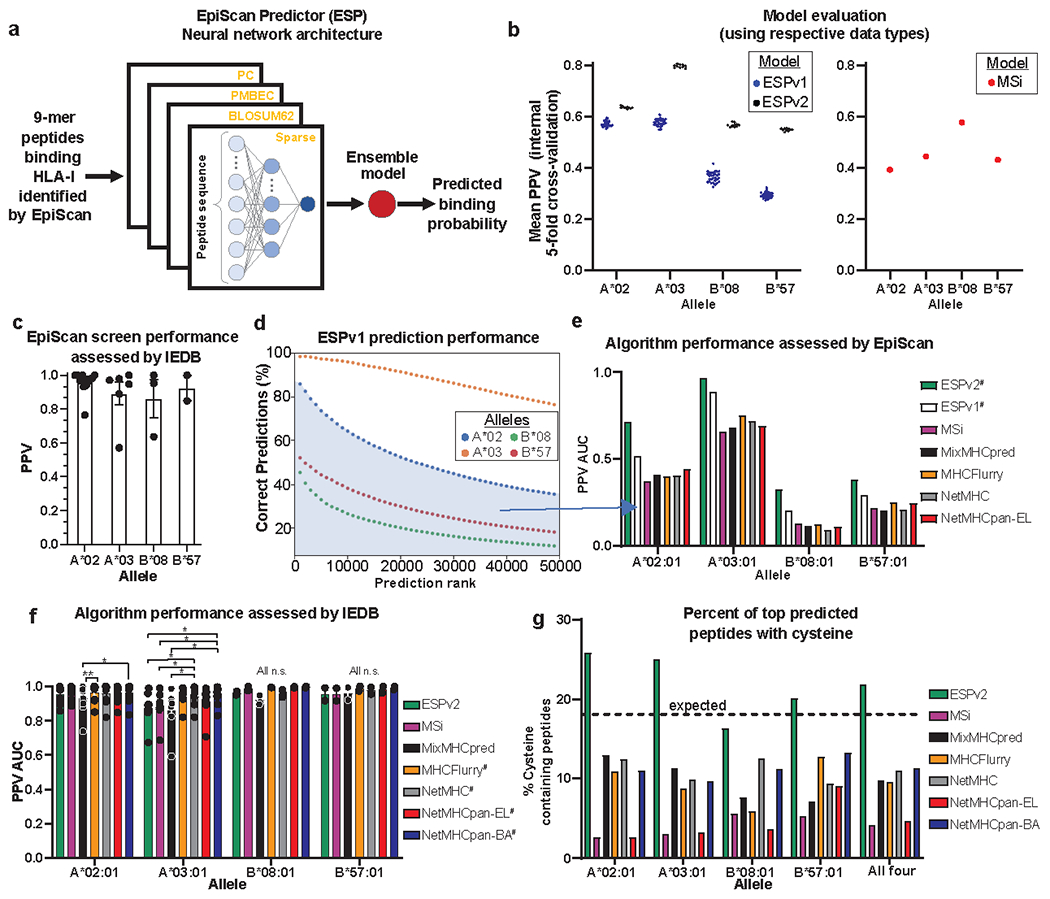
(a) Schematic representation of the neural network architecture employed for the EpiScan Predictor (ESP) models (adapted from ref. 8).
(b) Predictive power of the ESP (left) and MSi (right) models8. Each dot represents the PPV from a different cross-validation set and the bar represents the mean. ESP was evaluated on EpiScan data and MSi was evaluated on mass spectrometry data. For ESPv1 n = 30, for ESPv2 n = 10, for MSi n = 1.
(c) Performance of EpiScan screens when predicting binders in IEDB datasets. Each dot represents the PPV of a distinct IEDB dataset and the bars represent mean ± SEM. N = 12 for A*02, n = 6 for A*03, n = 3 for B*08, and n = 2 for B*57.
(d) The accuracy of the top 50,000 ESPv1 predictions from the human proteome as determined by EpiScan.
(e) Comparison of algorithm performance for predicting binders as determined by EpiScan for the top 0.48% ranked 9mer peptides of the human proteome of each algorithm. # denotes algorithms that were trained on EpiScan screen data: ESPv1 was trained on the random 9mer library and ESPv2 was trained on the retraining library.
(f) Performance of the indicated MHC class I ligand prediction algorithms when predicting binders in IEDB datasets. Each dot represents the PPV of a distinct IEDB dataset and the bars represent mean ± SEM. *p < 0.05, **p = 0.0066, for each group relative to one another by two-way Friedman’s test with Dunn’s multiple hypothesis test correction. # denotes algorithms that were trained partially, or exclusively, on IEDB binding affinity data. N = 11 for A*02, n = 7 for A*03, n = 3 for B*08, and n = 2 for B*57.
(g) The percent of the top 50,000 predicted 9mer peptides of the human proteome that contain cysteine for the indicated algorithms. The dotted line indicates the percentage of 9mer peptides that should contain cysteine given its frequency in the proteome.
Biased-anchor peptide EpiScan reveals affinity hierarchies
We wanted to utilize the programmability of the EpiScan platform to probe the relative affinity of particular amino acid residues for MHC class I alleles. We created EpiScan libraries encoding potential 9-mer ligands for each of the four alleles (HLA-A*02, HLA-A*03, HLA-B*08 and HLA-B*57) wherein one of the critical anchor positions of the peptide encoded a favored residue but the second anchor position did not. For example, one half of the HLA-A*02 library encoded peptides that contained either isoleucine, leucine, methionine or valine at the second position while the ninth position was occupied by any amino acid except alanine, isoleucine, leucine or valine; similarly, the second half of the library encoded peptides containing either alanine, isoleucine, leucine or valine at the ninth position while isoleucine, leucine, methionine or valine were prohibited at the second position (Extended Data Fig. 9a). By using EpiScan to identify the MHC class I ligands amongst these peptide pools, we reasoned that we would be able to infer which anchor position, and which of the residues at that anchor position, contribute the most to binding affinity. In agreement with our previous data comparing valine- and leucine-ended HLA-A*02 ligands (Fig. 3f,g), valine-ended 9-mers constituted the largest fraction of binders relative to all other residues favored at anchor positions. At the ninth position for HLA-A*03, HLA-B*08 and HLA-B*57, it was lysine, leucine and tryptophan, respectively, that contributed the most to binding affinity (Extended Data Fig. 9b). Additionally, these data indicated which amino acids are preferred after the top residues are excluded, something that would be difficult to detect in a typical MS experiment. Using HLA-A*02 as an example, glutamine was the top alternative when isoleucine, leucine, methionine or valine were barred from the second position (Extended Data Fig. 9c,e). Furthermore, when comparing L- and V-ended peptides where favored residues were excluded from the second position, stronger preferences were exhibited at non-anchor positions (such as four and seven) for the generally lower affinity L-ended peptides relative to the V-ended peptides (Extended Data Fig. 9c,d). We observed the same phenomenon for HLA-A*03, HLA-B*08 and HLA-B*57 when excluding favored anchor residues (Extended Data Fig. 9e–h), suggesting that peptides with lower affinity residues in anchor positions rely more heavily on other positions to interact with MHC class I. Altogether, these data demonstrate that programming the EpiScan platform with specific peptide libraries can rapidly advance our understanding of MHC-peptide binding properties.
EpiScan allows for iterative refinement of the ESP models
EpiScan provides the ability to improve the performance of our ESPv1 models by re-training our models based on new sets of allele-specific peptide libraries. For each of the four alleles, HLA-A*02, HLA-A*03, HLA-B*08 and HLA-B*57, we designed allele-specific oligonucleotide libraries encoding >100,000 putative 9-mer peptide ligands. The principal component of these libraries was the best 50,000, or top 0.48%, binders from the human (9-mer) proteome as predicted by ESPv1: we reasoned that by taking the predictions from the initial ESPv1 model and evaluating those predictions experimentally, we would generate a far more informative dataset that could be exploited to train superior ESP models. To increase the diversity of potential ligands and to allow for a direct comparison between prediction algorithms, we also included all peptides from the IEDB, and the top 50,000 binders predicted by the MSi and the NetMHC algorithms.
We performed the EpiScan screens as for the random 9-mer libraries described above, and first used the results as an opportunity to evaluate the concordance of EpiScan relative to in vitro assays in the IEDB21. We derived PPV scores based on what fraction of the EpiScan screen-enriched peptides were also classified as binders in each set of IEDB assays. We found that EpiScan had an average PPV for IEDB-identified MHC class I ligands of greater than 85% for all alleles (Fig. 5c, Supplementary Table 9, Source Data 1). Examination of the false positive peptides for HLA-A*02 and HLA-A*03 shows that most had at least one, if not both, canonical residues at anchor positions (Supplementary Table 9, Supplementary Fig. 2a,b), suggesting EpiScan may be correct for a subset of these peptides.
Using this EpiScan screen data to generate a list of high-confidence binders for each allele (Source Data 6), we found that the majority of ESPv1-predicted HLA-A*02 and HLA-A*03 ligands did indeed bind MHC class I in the EpiScan assay, whereas inferior performance was observed for HLA-B*08 and HLA-B*57 (Fig. 5d), consistent with the earlier internal validation data (Fig. 5b). To evaluate the performance of ESPv1 relative to other algorithms, we asked how many of each algorithm’s top 0.48% predicted binders of the human proteome were also determined to be binders via our EpiScan screens. ESPv1 outperformed all other algorithms compared in this assay (Fig. 5e, Extended Data Fig. 10); although these algorithms were placed at a disadvantage given that the experimental evaluation was performed using EpiScan.
From the collective results of the IEDB, predictor peptide and biased-anchor screens, we derived a larger dataset of both binders and non-binders to train ESPv2. Notably, we observed a ~0.2 increase in PPV over the previous performance of ESPv1 (Fig. 5b). The improvement for HLA-A*02 was less than for the other alleles; we suspect this is because the HLA-A*02 library was designed using ESPv1 trained on data derived from the random 9-mer library screened in SPP-sufficient cells, whereas the evaluation screen was performed in SPP KO cells. Our success in improving ESP suggests that it should be possible to further enhance performance, particularly for the HLA-B alleles, from further iterations of this process.
To assess the performance of ESPv2 relative to other state-of-the-art MHC class I peptide binding prediction algorithms, we ran predictions of all peptides on an orthogonal data set, the IEDB, with each algorithm. Again, we asked of each algorithm’s top 0.48%-ranked predicted peptides, how many were classified as binders in different IEDB assays. We found that ESPv2 performed comparably to the other algorithms in its ability to predict binders from the IEDB (Fig. 5f, Source Data 1). The only exception was A*03 where we saw statistically significant differences between ESPv2 and algorithms that were trained exclusively on IEDB data, NetMHC and NetMHCpan-BA. Overall, these comparisons allows us to conclude that ESPv2 is faithfully capturing MHC class I binding preferences as determined by EpiScan.
However, comparing the proportion of cysteine containing peptides in the top 0.48% predicted human proteome peptides of all algorithms for all four alleles reveals a dramatic difference: 21% of ESPv2 predicted peptides contain cysteine relative to an average of 8% for the other six algorithms (Fig. 5g, Supplementary Table 10). Accounting for the difference in cysteine containing peptides between the algorithms, ESPv2 predicts an increase in the total number of predicted MHC class I binding peptides of 9% (B*08) to 21% (A*03), depending on whether cysteine specificity participates as an anchor residue of the allele. Overall, the new specificities identified by EpiScan and ESP increase the number of peptides predicted to bind MHCs by over 15% on average. This greatly expands the potential human epitope landscape, facilitating epitope discovery efforts and the design of immunotherapeutics.
Discussion
EpiScan allows for rapid empirical determination of MHC class I binding for large pools of peptides, leveraging inexpensive DNA oligonucleotide synthesis to generate pre-defined libraries for targeted immunopeptidomics. As we have demonstrated with SARS-CoV-2, uncovering the entire MHC class I immunopeptidome for a single pathogen is readily achievable. Indeed, EpiScan could be used to find potential epitopes in any given foreign protein, facilitating the ‘deimmunization’ of proteins58 and paving the way for nonimmunogenic gene therapies in humans. In the future, this may be possible entirely in silico: our early-generation predictive algorithms show comparable or superior performance to existing algorithms trained on MS data. We have demonstrated that sequential EpiScan screens can be performed to generate more informative training data, thus leading to iterative improvements in predictive power. Furthermore, EpiScan provides the possibility of analyzing longer peptides, such as 12mers, that are too rare for reliable binding prediction.
One advantage of EpiScan is that it is not subject to bias introduced by limitations in MS-based peptide detection, upon which many prediction algorithms are based. Early iterations of prediction algorithms were based on biochemical affinity measurements59,60. Both of these can be affected by cysteine oxidation during sample preparation22. By circumventing these inherent biases EpiScan reveals a substantially greater proportion of cysteine-containing peptides among MHC class I ligands than previously appreciated. When comparing to MSi, ESPv2’s lack of bias against cysteine alone results in an increase of 9-21% of total peptides predicted to be binders, depending on the MHC class I allele examined (Supplementary Table 10). Also, the reactivity of CD8 T-cells toward cysteine-containing peptides can be modulated by cysteine modification61, further highlighting the importance of accurate prediction of cysteine-containing peptides.
Although many assays exist to characterize the targets of CD8 T cells, they all rely on the successful prediction, and/or validation, of peptide binding to MHC class I. Classical approaches, such as tetramer staining or ELISpot, rely on peptide synthesis to make tetramers or elicit cytokine release and are thus not amenable for genome-scale epitope discovery. Our lab previously developed T-Scan for high-throughput T cell receptor specificity elucidation using genetically encoded protein fragments of at least 60 amino acids62. Therefore, further work is still required to identify the precise peptide responsible for T cell activation. EpiScan acts as a complementary tool to these top-down, T cell receptor-centric approaches, by eliminating the potential peptides that are not MHC class I ligands.
Although we have demonstrated EpiScan can capably determine the capacity for peptides to bind MHC class I, it does not consider endogenous proteasome cleavage or processing that would impact peptide presentation in vivo. Peptide processing can be influenced by the expression of the immunoproteasome63, varying ERAP1/2 expression levels (Extended Data Fig. 3a–c), and ERAP1/2 variants64,65. To improve predictive accuracy for in vivo epitope presentation we have incorporated an option to add proteasomal cleavage predictions via NetChop66 to our ESP online tool. However, proteasome-agnostic prediction methodology could be particularly important for peptides generated by proteasome-independent means or whose C-termini are created by a stop codon. Specifically, activation of CD8 T cells by dendritic cell cross-presentation can occur independent of the proteasome67. We saw relatively large percentages of >9-mer peptides in our SARS-CoV-2 screens (Fig. 4d), likely due to the absence of ERAP1/2 that would shorten those longer peptides. Longer peptides, such as 10- and 11mers, have been shown to adopt more unusual binding configurations that allow for amino acids at non-canonical positions to behave as “anchors”68–72. Although ERAP1/2-expressing cells may be less likely to present longer peptides, it is important to be able to demonstrate they are capable of binding MHC class I. Thus, ESP will be a valuable tool for predicting potentially antigenic peptides that lacks bias from proteasomal and peptidase processing inherent to MS-based predictors. In future work, we hope to generate sufficient data on peptides other than 9mers to extend the predictive ability of ESP to potential MHC class I ligands of other lengths.
One limitation of the current configuration of EpiScan is the absence of amino acid modifications in the presented peptides. This may be addressable in certain cases by the use of systems to incorporate non-canonical amino acids such as phosphoserine into peptides at specific positions73. Alternatively, specific modifying enzymes could be expressed in the ER to modify peptides, or modification-mimetic amino acids can be substituted in positions where phospho-serine or -threonine are known to reside.
Relative to the other alleles, we had difficulty in determining as many high-confidence binders for HLA-C (Fig. 4f). Those screens had relatively poor intra-replicate correlation (Supplementary Table 11). In the future we intend to determine whether this was due to technical issues or biological differences inherent to HLA-C alleles relative to HLA-A and HLA-B. It is possible that the chaperone requirements of HLA-C alleles are different74, and thus the endogenous chaperone expression in the EpiScan cells are not ideal for HLA-C peptide binding and trafficking to the cell surface. Testing HLA-C EpiScan with over-expression of TAPBP, TAPBPR, and dead TAP1/2, such as we did for HLA-A*02 (Extended Data Fig. 3f), may reveal better conditions for screening HLA-C.
Given the polymorphic nature of MHC alleles, many alleles remain under-characterized, especially in other species, thus targeted immunopeptidomics could provide great utility. Applying EpiScan to the alleles of other species, such as mouse models of infectious disease, could facilitate rapid immunogenicity predictions. Furthermore, EpiScan could be used to understand and overcome Cas9 immunogenicity75,76, and refine organ transplantation77. Thus, knowledge of foreign species MHC class I peptide specificities could enhance therapeutic approaches for humans and animals.
In addition to deep profiling of peptides, EpiScan can be used to determine the effects of chemicals on MHC class I presentation of specific peptides or alteration of MHC-specificity. There are a large number of small molecule-induced adverse drug reactions (ADRs) whose toxicities are linked to specific HLA alleles78. We have demonstrated that EpiScan can detect altered HLA specificity for one such ADR caused by abacavir, an anti-HIV drug. Abacavir is known to bind to HLA-B*57 and alter its specificity to generate an autoimmune response. We easily detected this difference using EpiScan in which abacavir permitted HLA-B*57 to bind small aliphatic residues that previously did not bind. There are dozens of examples of ADR-causing drugs which can be interrogated using this technology.
Classical vaccination methods utilize immunization with full-length proteins, but the immune response that follows typically focuses on only a subset of potential antigenic epitopes through the poorly understood process of T cell immunodominance79. Knowledge of the assortment of potential T cell epitopes given the MHC class I haplotype of any particular individual could guide the development of personalized vaccines, which should provide broader and potentially more durable responses80. In particular, EpiScan would permit the swift assessment of potential neo-antigen peptide:MHC class I complexes necessary for personalized cancer vaccines81. In addition to strong binding peptides, it is possible that peptides exist that are loaded onto MHC class I but bind too poorly to prime the immune system and generate an immune response. However, were an immune response already present that recognized that peptide, it may be sufficient to be eliminate that cell. EpiScan could be utilized to quickly engineer enhancement of binding derivatives of peptides to generate peptides capable of eliciting an immune response, thereby expanding the vaccine space to additional peptides.
Targeted immunopeptidomics enabled by EpiScan technology expands our ability to interrogate and manipulate the immune system and should find many applications in both basic and translational research, thereby bringing us closer to personalized therapies that harness the power of the immune system.
Methods
Cell culture
HEK-293T (CRL-3216), T2 (CRL-1992) and C1R (CRL-2369) cells were obtained from ATCC. T2 and C1R cells were cultured in IMDM (Gibco, 12440053) with 10% FBS (HyClone) and 1% penicillin–streptomycin (15140-122, Invitrogen); HEK-293T were cultured in 10% DMEM (Gibco, 11995065) with 10% FBS (HyClone) and 1% penicillin–streptomycin (15140-122, Invitrogen). All cell lines were regularly tested for mycoplasma and all negative. Cells were obtained directly from ATCC, and thus were not authenticated.
T cell isolation and expansion
Peripheral blood was provided by the Ragon Institute of Massachusetts General Hospital that were PCR-confirmed COVID-19 cases. All study participants provided verbal and/or written informed consent. Participation in these studies was voluntary and the study protocols have been approved by the Partners Institutional Review Board. Memory CD8+ T cells were isolated using the Miltenyi CD8+ Memory T cell isolation kit according to manufacturer’s instructions. T cells were expanded using irradiated peripheral blood mononuclear cells (PBMCs). Briefly, apheresis collars were obtained from the Brigham and Women’s Hospital Specimen Bank under protocol T0276 and PBMCs were purified on a Ficoll gradient. The cells at the interface were extracted, washed twice, and irradiated (60 Gy IR). For expansion, isolated memory CD8+ patient T cells were added to 2 million irradiated PBMCs in a final volume of 20 ml RPMI, 10% FBS, 100 units/ml penicillin, 0.1 mg/ml streptomycin, 50 U/ml IL-2 (Sigma), and 0.1 ug/ml anti-CD3 antibody (OKT3, ebioscience).
Generation of EpiScan cells
HEK-293T cells were transfected with sgRNAs targeting TAP1 and TAP2; cells exhibiting diminished cell surface MHC class I were then single cell cloned by sorting into 96-well plates. An MHC class Ilow clone was then transfected with two sgRNAs targeting all endogenous MHC class I alleles. Cells lacking any detectable cell surface MHC class I were then single cell cloned. Then, a TAP1/2 deficient, MHC class I null clone was transfected with sgRNAs targeting ERAP1 and ERAP2 and single cell clones again generated from the resulting population. Successful disruption of ERAP1 and ERAP2 was confirmed by immunoblot and TOPO cloning and Sanger sequencing, respectively. Finally, the MHC class I, TAP1/2, ERAP1/2 null clone was transfected with sgRNAs targeting HM13 then single cell clones were generated. Successful disruption of HM13 was confirmed by Sanger sequencing.
All sgRNAs were cloned into either lentiCRISPR v2-FE or PX458 (Addgene #48138); sequences used were:
| sgRNA name | sgRNA target sequence |
|---|---|
| sgTAP1-1 | GCCATGCGAGAGAAGCTCCG |
| sgTAP1-2 | AGTTCGAAGCTTTGCCAACG |
| sgTAP2-1 | ATCCCCATATATGTATACCA |
| sgTAP2-2 | ACAACAAAGTCTTGATGTGG |
| sgPan-MHC class I 1 | CGGCTACTACAACCAGAGCG |
| sgPan-MHC class I 2 | GAGATCACACTGACCTGGCAG |
| sgERAP1-1 | AGATTATGCACTGGATGCTG |
| sgERAP1-2 | GTGCAATTTGCTCCTGACGG |
| sgERAP1-3 | AAGGCCATTCTAGCTGCAGT |
| sgERAP2-1 | GAGATGCAACAAAGTCCAGAG |
| sgERAP2-2 | GCCTCACCTGAAATACTATG |
| sgHM13-1 | GCCCCACCAACAGCACTACG |
| sgHM13-2 | AGAAATACATGGACAGCAGG |
| sgHM13-3 | GGTATTTGGCACCAATGTGA |
Generation of EpiScan vector
A lentiviral pHAGE vector with a CMV promoter plus an EF1α promoter driving EGFP-P2A-PuroR was used as the backbone. The vector was digested with PstI and AgeI to excise the EF1α promoter, and the Gibson assembly method used to insert a gBlock (IDT) encoding (1) a codon-optimized MMTV gp70 signal peptide, (2) filler region flanked by BsmBI sites and (3) an IRES element. The resulting vector was then converted into a Gateway destination-like vector by inserting the CmR and ccdB cassettes into the SphI site located in the filler region.
Digital droplet PCR
Genomic DNA from input EpiScan libraries was digested with HaeII (NEB cat# R0108) for 1 h at 37 C. The QX200 Droplet Digital PCR system (Bio-Rad cat. # 1864001) was used to create and evaluate droplets after the ddPCR reaction according to manufacturer guidelines (Bio-Rad cat. #s 1863005, 1863023) with the following primers. Puro resistance gene Forward primer: 5’-GTCACCGAGCTGCAAGAAC-3’, Puro resistance gene Reverse primer: 5’-CCACACCTTGCCGATGTC-3’, Puro resistance gene Probe: 5’ 6-FAM-CTTCCTCACGCGCGTCGG-3’ Iowa Black FQ. RPP30 reagents were purchased as a kit from BioRad (cat. #: dHsaCP2500350). Multiplicity of infection was then determined by dividing the number of puromycin resistance gene positive droplets by half the number of RPP30 positive droplets.
Peptide pulsing
Cells were washed with PBS three times to remove FBS, resuspended in IMDM with 1% penicillin–streptomycin (15140-122, Invitrogen) without FBS, and 100,000 cells seeded per well of a 96-well plate. Peptides were added 24 h before analysis by flow cytometry.
Flow cytometry
Cells were stained for at least 30 m in PBS, washed in PBS and then analyzed with a BD LSR2. All antibodies were from BioLegend and used at 1:100: 141605 - APC anti-mouse H-2Kb bound to SIINFEKL, 343305 - PE anti human HLA-A2, 316317 - PE/Cy7 anti-human B2-microglobulin, 141603 - PE anti-mouse H-2Kb bound to SIINFEKL, 311410 - APC anti-human HLA-A,B,C, 316312 - APC anti-human B2-microglobulin,125506 - PE anti-mouse H-2, 343308 - APC anti human HLA-A2, 300434- Brilliant Violet 421- anti-CD3, 344726 - Alexa Fluor 647 anti-CD8. Data collection was performed on BD LSR2 with FACSDiva 6.0 (BD) and analysis was performed using FlowJo v10.6.1 (BD).
FACS
For EpiScan screens, 30 μl of antibody (APC-conjugated anti-human HLA-A2 antibody, BioLegend, 343308 or APC-conjugated anti-human B2-microglobulin antibody, BioLegend, 316312) in a total volume of 1.5 ml was used per 10 million cells. Staining was conducted for 30 min at 4°C; cells were then washed in PBS prior to sorting. Sorting was performed on a Sony MA900 instrument. For EpiScan screen sorts, the small remaining library negative population was used to draw the MHC class I surface positive gate. Within that gate, four bins subdivided the positive population into equal populations. Examples can be found in Extended Data Fig. 4.
Immunoblotting
Cells were pelleted, washed in PBS, and then lysed in RIPA buffer. Lysates were mixed with Novex Tris-Glycine SDS Sample Buffer containing B-mercaptoethanol and resolved on a 4-20% Tris-Glycine SDS-PAGE gel. Antibodies used were anti-GAPDH (sc-47724, Santa Cruz, 1:200) and anti-ERAP1 (MABF851, Millipore, 1:1000).
Transfection and single cell cloning
HEK-293T cells were transfected using PolyJet (SignaGen, SL100688) as recommended by the manufacturer. Single cell cloning was carried out after 7 d by FACS using a Sony MA900 instrument.
Lentiviral transduction
293T cells were transfected with PolyJet (SignaGen, SL100688) according to manufacturer’s directions using a 1:1 ratio of lentiviral plasmids to packaging vectors (encoding VSV-G, Tat, Rev and Gag-Pol). Viral supernatants were harvested at 48 h and 72 h post-transfection, passaged through a .45 μm filter, and applied to target cells for 48 h in the presence of 8 μg/ml polybrene. Transduced cells were selected with 2 μg/ml puromycin for at least four days.
EpiScan library generation
Random 9-mer library.
An oligo of the follow sequence was ordered from Integrated DNA Technologies: ccacctgtgagcgggNNBNNBNNBNNBNNBNNBNNBNNBNNBtaaGCacgttactgg. ‘NNB’ was used to exclude two (TAA and TGA) of the three stop codons from randomly occurring. It was amplified by PCR using the primers, tggccgtattggccccgccacctgtgagcggg and attccaagcggcttcggccagtaacgtGCtta, and then cloned into the EpiScan vector digested with BsmBI using the Gibson assembly method. The resulting plasmids were then electroporated into Electromax DH10B competent cells (ThermoFisher Scientific).
SARS-CoV-2 library.
Protein sequences of SARS-CoV-2 available as of 2/06/20 were downloaded from the NCBI Severe acute respiratory syndrome coronavirus 2 data hub. This represented a total of 11 strains of SARS-CoV-2. All protein sequences were broken into 9-, 10- and 11-mer fragments and duplicates were removed. The remaining sequences were then reverse translated using a custom script written in MATLAB R2019b to avoid restriction sites for EcoRI/XhoI/BsmBI/BbsI and to ensure GC content between 30% and 70%. Sequences were amplified from a SurePrint Oligonucleotide Library (Agilent) and digested with BbsI to liberate sticky ended peptide-encoding fragments. The EpiScan vector was digested with BsmBI to generate compatible sticky ends and the fragments were cloned in via T4 ligation. The ligation products were then electroporated into Electromax DH10B competent cells (ThermoFisher Scientific).
Spike Variant library.
All available sequences of SARS-CoV-2 spike were downloaded from GISAID on 1/7/21. The top 250 most frequent mutations relative to the original Wuhan strain were chosen for inclusion in the library. All sequences were broken into 8-, 9-, 10-, 11-, and 12mer fragments and duplicates were removed. The remaining sequences were then reverse translated using a custom script written in MATLAB R2019b to avoid restriction sites for EcoRI/XhoI/BsmBI/BbsI and to ensure GC content between 30% and 70%. Sequences were amplified from a SurePrint Oligonucleotide Library (Agilent) with common primers, ccccctcctgtgtcaggg and taagcacgttactggccg. The product cloned into the EpiScan vector digested with BsmBI using the Gibson assembly method. The resulting plasmids were then electroporated into Electromax DH10B competent cells (ThermoFisher Scientific).
Retraining libraries.
The specific libraries, all 9mers, were designed as follows:
1) Evaluating predictions of ESPv1, MSi and NetMHC. Proteome predictions were generated for each algorithm, then ranked, and then 100 peptides at random from each percentile were chosen. 100 percentiles x 100 peptides = 10,000 peptides per algorithm = 30,000 peptides total per allele.
2) Evaluating all top ESP predictions on the proteome. Of all ESPv1 proteome predictions, those with peptides of binding probability < 0.05 or < 0.1 were chosen. 84,580 peptides for A2, B8 and B57, 92,000 for A3
3) Evaluating best MSi and NetMHC predictions. Of all of the MSi and NetMHC proteome predictions, the best 50,000 peptides in each case were chosen for 100,000 peptides per allele.
4) EpiScan IEDB benchmarking. All IEDB 9mer peptides for each allele were included, 5,000 to 19,000 per allele.
5) MS peptide benchmarking. All 9-mer MS binders = 500 to 2,000 peptides per allele.
6) Exploring biased-anchor binders. EpiScan and MS binders were combined and used to generate a position-specific frequency matrix (PSFM). Using this information, anchor positions and their favored residues were defined: A2: pos2: I,L,M,V pos9: A,I,L,V A3: pos2, I,L,T,V pos9: H,K,R,Y B8: pos5: K,R pos9: L,V,I,F B57: pos2: A,S,T,V pos9: F,W,Y,L. Then peptides were generated by picking at random based on each alelle’s PSFM, but fixing it such that one of the anchor positions contains an optimal residue but the other anchor position does not. 2,000 peptides in each case = 8,000 total for B8, 12,000 total for B57, 16,000 total for A2 and A3
Sequences were PCR amplified from a SurePrint Oligonucleotide Library (Agilent), first with allele specific primers, then with common primers, ccccctcctgtgtcaggg and taagcacgttactggccg, and then cloned into the EpiScan vector digested with BsmBI using the Gibson assembly method. The resulting plasmids were then electroporated into Electromax DH10B competent cells (ThermoFisher Scientific).
NGS library preparation
Genomic DNA was isolated via phenol/chloroform extraction. EpiScan vector sequences were amplified (F: tccctacacgacgctcttccgatcttacagctcgccacctgtgagcggg and R: ggcttcggccagtaacgtgc; the underlined sequence represents a 0-7 nt variable stagger region) in a 125 μl reaction with 5 μg gDNA. PCR reactions for each sample were pooled, purified using the Machery-Nagel PCR clean-up kit (Takara, 740609), and 400 ng used for a second round of PCR to add Illumina P5 and P7 sequences and indices for multiplexing (F: aatgatacggcgaccaccgagatctacactcttTCCCTACACGACGCTCTTCCG and R: caagcagaagacggcatacgagat[xxxxxxx]GTGACTGGAGTTCAGACGTGT; where [xxxxxx] represents the sample index). Finally, samples were pooled, gel purified and then sequenced using an Illumina NextSeq or NovaSeq instrument. Read processing and alignment were performed with CutAdapt82 and Bowtie 283, respectively.
Expression vectors
All cDNAs were cloned into expression vectors via Gateway Cloning (ThermoFisher). ERAP1 (IOH80668) was obtained from the Harvard ORFeome v8 collection. CD40 (IOH10427) and CD80 (IOH27312) were obtained from the Ultimate ORF LITE Human collection from ThermoFisher. ERAP2 and MHC class I alleles were codon optimized and synthesized as gBlocks with flanking attB sites by Integrated DNA Technologies. The “humanized” H-2Kb vector was generated by flanking the peptide binding domains of H-2Kb, α1 and α2, with the signal sequence and α3 domain from HLA-A*02:01. The sequence is as follows with the underlined amino acids taken from HLA-A*02:01: MAVMAPRTLVLLLSGALALTQTWAGPHSLRYFVTAVSRPGLGEPRYMEVGYVDDTEFVRFDSDAENPRYEPRARWMEQEGPEYWERETQKAKGNEQSFRVDLRTLLGYYNQSKGGSHTIQVISGCEVGSDGRLLRGYQQYAYDGCDYIALNEDLKTWTAADMAALITKHKWEQAGEAERLRAYLEGTCVEWLRRYLKNGNATLLRTDAPKTHMTHHAVSDHEATLRCWALSFYPAEITLTWQRDGEDQTQDTELVETRPAGDGTFQKWAAVVVPSGQEQRYTCHVQHEGLPKPLTLRWEPSSQPTIPIVGIIAGLVLFGAVITGAVVAAVMWRRKSSDRKGGSYSQAASSDSAQGSDVSLTACKV*. Destination vectors all used the EF1α promoter to drive cDNA expression and contained a selectable marker (BFP, mAmetrine, tdTomato or HygroR) driven by the PGK promoter.
Criteria for selection of MHC class I ligands
Each library had slightly varied high-confidence MHC class I ligand hit calling based on the number of peptides and reproducibility inherent to the library. Generally, the smaller the library, the higher the reproducibility, and the more stringent the hit requirements were.
Random 9mers - required reads in at least one out of four bins and the log2(FC) threshold for both replicates varied by allele to try to include roughly the same number peptides as MS. The minimum bins required for each allele are as follows: A2 WT SPP, B8: 1, A2 SPP KO, B57 untreated: 2, B57 abacavir: 4, and A3: 5.
SARS-CoV-2 - required reads in at least three out of four bins and log2(FC) > 2.5 for both replicates. If only one replicate was performed, then bins one and three were treated as one replicate and bins two and four were treated as another for the fold change requirement.
Retraining – two tiers of binders were established “high threshold” which were the positives for training and “low threshold” which were excluded from the negative set for training. Low threshold peptides were present in at two out of four bins for each replicate and had log2(FC) > 1 for both reps. High threshold peptides were present in at two bins out of four for each replicate and had log2(FC) > 2.5 for both replicates.
S Variants – required at least log2(FC) > 4 for both replicates and an FDR < 0.2 as required by Mageck analysis.
Computational prediction of MHC class I ligands
The Keras Python library was used to train machine learning models to predict the likelihood of any given 9-mer binding MHC class I. A neural network architecture analogous to that developed by Sarkizova and colleagues8 was employed, with only minor modifications. Four different models were trained, each with different encodings of the peptide sequence: (1) sparse matrix encoding, (2) similarity encoding using the Blosum62 matrix, (3) similarity encoding based on the PMBEC matrix84, and (4) an encoding in which each amino acid was represented by the first three principal components derived from dimensionality reduction based on physiochemical properties85. For each model a single hidden layer of 100 neurons with sigmoid activation was used; the outputs of these models were combined in a single output layer to generate the final binding prediction.
For each allele, the positive hits were the MHC class I ligands identified by EpiScan, while the set of negative decoys comprised all other peptides which were identified in the input 9-mer random library but which were not found in any of the EpiScan sorting bins. Training was performed as described8, except that a 10-fold excess of decoys was used. Predictive power was assessed as recommended8, whereby the ability of the model to predict true binders amongst the top 0.1% of the dataset was evaluated in the presence of a 999-fold excess of decoy peptides, in which peptides resembling true positives were not excluded (PPV metric). The data depicted in Figure 5A represents the mean PPV obtained from each of 30 iterations of a five-fold cross-validation procedure (blue dots); for comparison, the mean PPV metric reported for the equivalent allele-specific MSi model for 9-mer peptides (Table S5 of 8) is represented by the red dots.
EpiScan Predictor (ESP) is available for public use at episcan-predictor.com
Conservation scoring
SARS-CoV-2 protein sequences were obtained from UniProt and entered into the ConSurf Server48,49,86. For S, 3a and 7a RCSB PDB structures (6VXX, 6XDC and 6W37, respectively) were used. HMMER was used as the homolog search algorithm with Uniprot as the protein database. Automatic homologue selection settings of a 35-95% homologue identity were required. The alignment method was MAFFT-L-INS-I with Bayesian calculation method with the default evolutionary substitution model. ORF10 was excluded due to lack of a sufficient number of homologues to perform conservation scoring. To locate epitopes in conserved regions, the conservation score was averaged over the length of the epitope.
Mass Spectrometry
HLA-A*02:01 EpiScan cells bearing the SARS-CoV-2 library were sorted in one bin based on surface MHC class I. After recovering from sorting, the cells were expanded and then 200 million cells were harvested by incubating with Accutase (#A6964 from Sigma) at RT and then washing twice in PBS. Then cells were snap frozen in liquid nitrogen.
For immunoprecipitation of MHC Class I and elution of associated peptides, the following reagents and buffers were used: Protease inhibitor (PI) tablet (Roche Complete Mini, EDTA free, # 11836170001), W6/32-sepharose (DMP-crosslinked Protein A sepharose at 20 mg/mL), Eppendorf Lo-Bind Microcentrifuge Tube (Eppendorf #022431081), Lysis buffer - Human class I (0.25% Sodium deoxycholate, 200μM iodoacetamide, 1% N-Octyl- B-D-thioglucoside. 1mM EDTA, 25 μg/mL DNase, Protease inhibitors: 1 tablet per 10mL buffer), Wash buffer 1 (Lysis buffer, no protease inhibitor), Wash buffer 2 (20 mM Tris-HCl, 400 mM NaCl, pH 8.0), Wash buffer 3 (20 mM Tris-HCl, 150 mM NaCl, pH 8.0), Wash buffer 4 (20 mM Tris-HCl, pH 8.0), MHC class I Elution buffer (0.1 M Acetic acid, 0.1% TFA).
Cell pellets were thawed on ice, then lysed at 50 million cells/mL of lysis buffer, incubating 30 min on ice. Insoluble material was pelleted at 800 × g for 5 min. Supernatant was centrifuged at 20,000 × g for 30 min at 4°C. Resin was washed and combined with clarified lysates. Resin was mixed with lysates (normalized by BCA to lowest protein yield) by gentle rotation at 4°C overnight. The next day, samples were centrifuged at 800 × g for 5 min at 4°C. Three washes (Buffers 1-3) of the resin were performed, which consisted of the following: Add 2.5 mL of buffer to resin, vortex then centrifuge 800 × g, 5 min at 4°C then discard the supernatant. At wash #4, 0.75 mL of Buffer 4 was added, and the total volume was transferred to loBind tubes. Then, centrifuge 800 × g, 5 min at 4°C and discard the supernatant. 1 mL of Elution buffer was added to each tube and incubated at 37°C for 5 min. Samples were centrifuged at 800 × g for 5 min at 4°C to elute. Eluates (supernatant) were collected into new loBind Eppendorf tubes and stored at −80°C until transfer to MSB. Eluates were submitted for LC-MS/MS analysis and PRE and POST samples were tested by ELISA. Peptides were desalted and concentrated using a Waters HLB solid phase extraction plate.
Half of each enriched sample was analyzed by nano LC-MS/MS using a Waters M-Class HPLC system interfaced to a ThermoFisher Fusion Lumos mass spectrometer. Peptides were loaded on a trapping column and eluted over a 75μm analytical column at 350nL/min; both columns were packed with Luna C18 resin (Phenomenex). A 2hr gradient was employed. The mass spectrometer was operated using a custom data-dependent method, with MS performed in the Orbitrap at 60,000 FWHM resolution and sequential MS/MS performed using high resolution CID and EThcD in the Orbitrap at 15,000 FWHM resolution. All MS data were acquired from m/z 300-800. A 3s cycle time was employed for all steps.
Data were searched using a local copy of PEAKS (Bioinformatics Solutions) with the following parameters: Enzyme: None Database: SwissProt Human appended with the protein sequences of SARS-CoV-2 available as of 2/06/20 from the NCBI. Fixed modification: Carbamidomethylation (C). Variable modifications: Oxidation (M), Deamidation (N,Q), Acetyl (Protein N-term) Mass values: Monoisotopic Peptide Mass Tolerance: 10 ppm Fragment Mass Tolerance: 0.02 Da PSM FDR: 1% PEAKS output was further processed using Microsoft Excel. Contaminant peptides like albumin, keratin and poly-proline peptides, such as HPPPPPPPP, were eliminated from the count of 9- through 11mers used for MS-EpiScan comparison analysis
Cell lysis, peptide elution, mass spectrometry and data analysis was performed by MS Bioworks of Ann Arbor, MI.
Tetramer generation and staining of patient samples
The HLA-A*02:01 L- versus V-ended peptides (NLVPMVAT_, GLCPIISF_, WLIGFDFD_) were synthesized by Genscript. They were loaded onto APC QuickSwitch Quant HLA-A*02:01 Tetramers (MBL International) such that the final concentrations of peptide were 20, 10, 5 and 2.5 μM. Peptide exchange was quantified by absence of exiting peptide antibody signal, as indicated by the manufacturer.
The following peptides were synthesized by New England Peptide: SLPGVFCGV, NLIDSYFVV, VMAYITGGVV, TLIGDCATV, VLYQDVNCTEV, VMVELVAEL, YIDIGNYTV, VMAYITGGV, AMDEFIERYKL, TLATHGLAAV, YLFDESGEFKL. Peptides were loaded at 10 mg/ml and exchange was quantified onto the QuickSwitch Quant HLA-A*02:01 Tetramers (PE and/or APC labeled) (MBL International) according to manufacturer’s instructions. Tetramers were used for staining at a final concentration of 10 μg/ml. Where specified, cells were additionally stained at 1:100 with a Brilliant Violet 421-conjugated anti-CD3 antibody (BioLegend - 300434) and an Alexa Fluor 647-conjugated anti-CD8 antibody (BioLegend - 344726).
Gene Set Enrichment Analysis
EpiScan data for all alleles with at least 40 high-confidence hits were ranked via MageckScore to serve as the input for GSEAPreranked. “Gene” sets were generated from peptides that had been shown to generate responses in CD8 T cells from COVID-19 convalescent datasets41,52–54. Sets with fewer than seven peptides were excluded and all other default settings were preserved.
Graph generation
All dot plots or bar graphs were created using either GraphPad Prism 9 or the Python Seaborn library. Unless otherwise noted, data are represented as mean ± SEM of the fold change in mean fluorescence intensity (MFI) relative to the average of the negative controls for that experiment. Each dot represents a different biological replicate. Scatter plots were created using Spotfire 6.5.1 and Spotfire 10(TIBCO). For computing differences in Spike variant wildtype and mutant peptide log2(FC), peptides with negative values were set to zero before calculating the difference.
Logoplot generation
Logoplots were generated with Seq2Logo87. Logoplots were of type Kullback-Leibler (-I 1), with Hobohm clustering (-C 2) and no weight on prior (-b 0). To account for the difference in amino acid frequencies between the 9-mer randomer library and the human proteome, for plots describing EpiScan data a custom (--bg argument) position-specific frequency matrix (PSFM) was employed, and for plots based on MS data a PSFM based on the human proteome was used. The EpiScan PSFM was generated using the amino acid frequency present in the input library of random 9mers.
Allele specificity correlation
For each allele for each methodology, the frequency of every amino acid at each of nine positions was calculated to create a 9x20 position-specific frequency matrix (PSFM). The random 9mer PSFMs were then normalized according to the differences in background amino acid representation between the randomer library and the human proteome. The PSFMs were flattened into a 1D array and then pairwise Pearson calculations for all EpiScan and mass spectrometry amino acid frequencies were computed using numpy.corrcoef.
Correlation analysis between EpiScan screen replicates
All screens with at least two replicates were compared by Pearson and Spearman correlation analysis after eliminating peptides that did not have at least fold change greater than or equal to one for each replicate. For screens with more than two replicates, correlation coefficients were conducted for each pairwise combination and then averaged. The results of this analysis are shown in Supplementary Table 11.
Correlation analysis between IEDB datasets
Spearman correlation coefficients were calculated between all A*02:01 and A*03:01 IEDB datasets for which there were at least 10 peptides in common after duplicate IEDB binding affinity values were averaged. Any dataset with distinct Method Name and Assay Group pairings were treated as different datasets. The results of this analysis are shown in Supplementary Table 1.
EpiScan performance assessment via IEDB
All retraining screen peptides were first filtered with the requirement that there was fold change relative to input of one or more in both replicates. Those peptides were then cross-referenced to all IEDB 9mer peptides. Duplicate IEDB binding affinity values were averaged. Datasets with fewer than 19 peptides and/or no negative peptides after averaging were eliminated. EpiScan hits were called positive above the fold change threshold for which there was the greatest difference between true positive rate and false positive rate. The positive predictive value (PPV) was then calculated by dividing the number of true positives by the total number of IEDB “QualitativeMeasure” positives. The results of this analysis are shown in Fig. 5c and Supplementary Table 9.
Algorithm performance assessments
Each algorithm (NetMHC4.056, netMHCpan4.188, MHCFlurry 2.089, mixMHCpred2.190, ESPv2) was run on the whole human proteome and all available peptides in IEDB21 with binding affinity data as of 1/4/22. For performance assessment according to EpiScan (Fig. 5e), the top 50,000 peptides, or 0.48% of the top peptides of the 9mer proteome, according to %rank, or affinity percentile for MHCFlurry, were selected for each algorithm and then cross referenced to the peptides that were screen in the EpiScan retraining libraries (MHCFlurry-B*08 had the least with 31,624 peptides available for comparison). Then, in 49 equal steps through the top peptides to the lowest, we asked of the peptides included in that step, how many were called hits by EpiScan to get that segment’s PPV. The sum of each step was divided by 49 to arrive at the PPV AUC. For Fig. 5f, This same procedure using the top 0.48% of algorithm predictions by %rank, or affinity percentile, was used to generate IEDB PPV AUCs with the IEDB “QualitativeMeasure” serving as the standard. IEDB peptide sets with fewer than 29 peptides were eliminated. We also eliminated IEDB datasets where it was indicated abacavir may have been used.
Quantification and statistical analysis
Unless otherwise noted in the figure legends, each dot represents a biological replicate and significance for all dot plots was measured by one-way ANOVA with Dunnett’s multiple-comparison test with *p < 0.05 **p<0.01 ***p < 0.001 or ****p < 0.0001 for each group relative to the negative control conditions. Additionally, unless otherwise noted, data are represented as mean ± SEM of the fold change in mean fluorescence intensity (MFI) relative to the average of the negative controls for that experiment. This was performed using GraphPad Prism 9. Fishers Exact Test was performed with fishertest using MATLAB R2021a. Mageck 0.5.8 was used to assign p-values to peptides in EpiScan screens whereby different codon usage for a peptide were treated as sgRNAs and amino acid sequence as the genes91. Where unclear from the number of dots, sample numbers are also found in the figure legends. All statistical tests for bar or dot plots were non-parametric. All comparisons of amino acid frequency using datasets of varying background amino acid frequency (such as MS versus EpiScan random 9mer) were normalized to their respective background frequency. No blinding, randomization, or sample size or power calculations were performed.
Extended Data
Extended Data Fig. 1. Generation and validation of EpiScan cells.
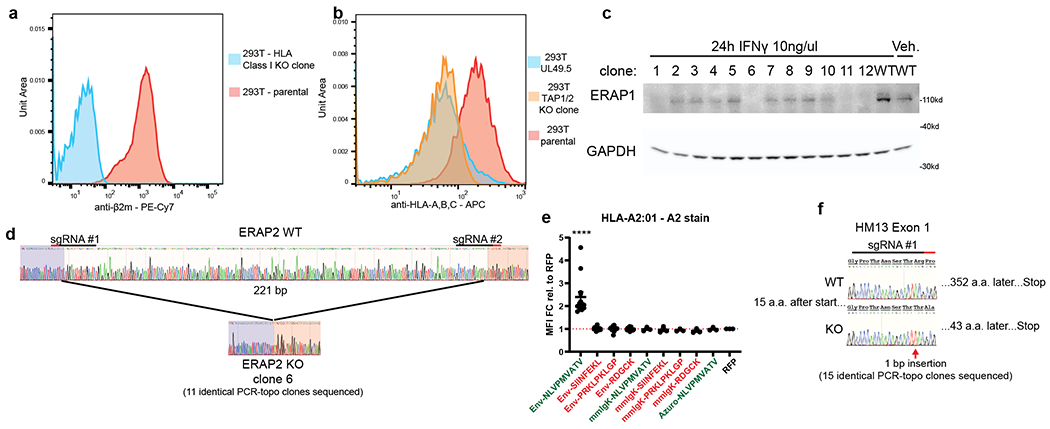
(a) Histograms depicting the relative amounts of surface MHC class I, as determined by B2M staining, between parental 293T cells and the HLA-I KO clone. (b) Histogram depicting the relative amounts of surface MHC class I comparing parental HEK-293T cells, the TAP1/2 knockout clone and cells expressing the BoHV-1 UL49.5 gene, which inhibits the TAP complex93. (c) Immunoblot validation of CRISPR-Cas9 mediated knockout of ERAP1; GAPDH was used as a loading control. This blot was conducted once. (d) Sanger sequencing of the ERAP2 locus targeted by CRISPR-Cas9. The locus was amplified by PCR and the products cloned into ZeroBlunt TOPO vectors and Sanger sequenced. ERAP2 KO clone 6 exhibited a 221 bp deletion in all 11 sequenced clones. (e) Testing signal peptides for the delivery of exogenous peptides to the ER. HEK-293T cells lacking TAP1/2 were infected with vectors expressing the indicated peptides fused to the following signal peptides: Env, signal peptide from the gp70 gene of mouse mammary tumor virus94; mmIgK, modified murine Kappa Immunoglobulin signal peptide95; and Azuro, signal peptide from the human Azurocidin preproprotein95. Sequences highlighted in green indicate positive controls, while sequences highlighted in red indicate negative controls. Data are represented as mean ± SEM of the fold change in mean fluorescence intensity (MFI) relative to the average of the negative controls for that experiment. Each dot represents a different biological replicate. N = 13 for the four leftmost and n = 3 for the rest. ****p < 0.0001 for each group relative to RFP by one-way ANOVA with Dunnett’s multiple-comparison test. (f) Sanger sequencing of the HM13 locus targeted by CRISPR-Cas9. The locus was amplified by PCR and the products cloned into ZeroBlunt TOPO vectors and Sanger sequenced. This clone exhibited a 1 bp deletion in all 15 sequenced clones.
Extended Data Fig. 2. Validation of the EpiScan approach.
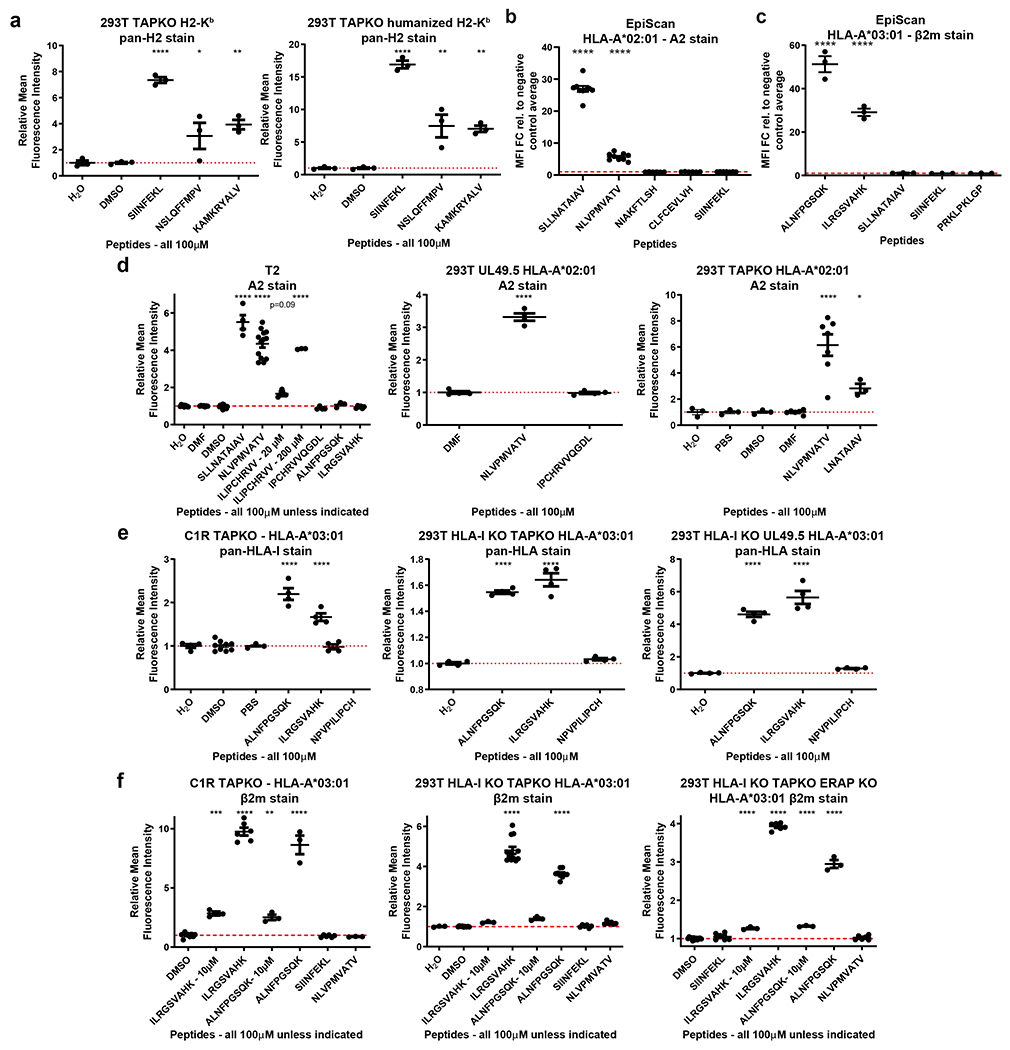
(a) Peptide pulsing experiments in TAP-deficient cells expressing H2-Kb (left) or a humanized version of the murine H2-Kb wherein the B2M interacting domain was replaced with the human equivalent (right); a pan-H2 antibody was used for flow cytometry. Cells were plated into serum-free media and treated with the indicated peptides at the indicated concentration for 24 h, and then subjected to flow cytometry to measure cell surface MHC class I levels. N = 3 biological replicates. (b-c) EpiScan SPP-KO or SPP sufficient cells expressing either HLA-A*02 (b) or HLA-A*03 (c), respectively, were transduced with the EpiScan vector expressing the indicated peptides and cell surface MHC class I levels were measured by flow cytometry. N = 9 for A*02 and n = 3 for A*03. (d-f) Peptide pulsing experiments in TAP-deficient cells expressing the indicated alleles. (d) HLA-A*02-expressing cell lines were stained with A2 antibody. T2 cells endogenously express HLA-A*02 and are TAP1/2 deficient. UL49.5 is a viral gene whose product inhibits TAP1/2. (e) C1R cells are MHC class I deficient and TAP1/2 was knocked out. The indicated HLA-A*03-expressing cell lines were stained with a pan-HLA-I antibody. (f) The indicated HLA-A*03-expressing cell lines were stained with B2M antibody. For all panels, data are represented as mean ± SEM of the fold change in mean fluorescence intensity (MFI) relative to the average of the vehicle controls. *p < 0.05, **p < 0.01, ***p<0.001, ****p < 0.0001 for each group relative to vehicle control by one-way ANOVA with Dunnett’s multiple-comparison test. Each dot represents a different biological replicate for all panels. Unless otherwise stated, MHC class I null cells were used and then the indicated allele was re-introduced via lentiviral transduction.
Extended Data Fig. 3. EpiScan optimization.
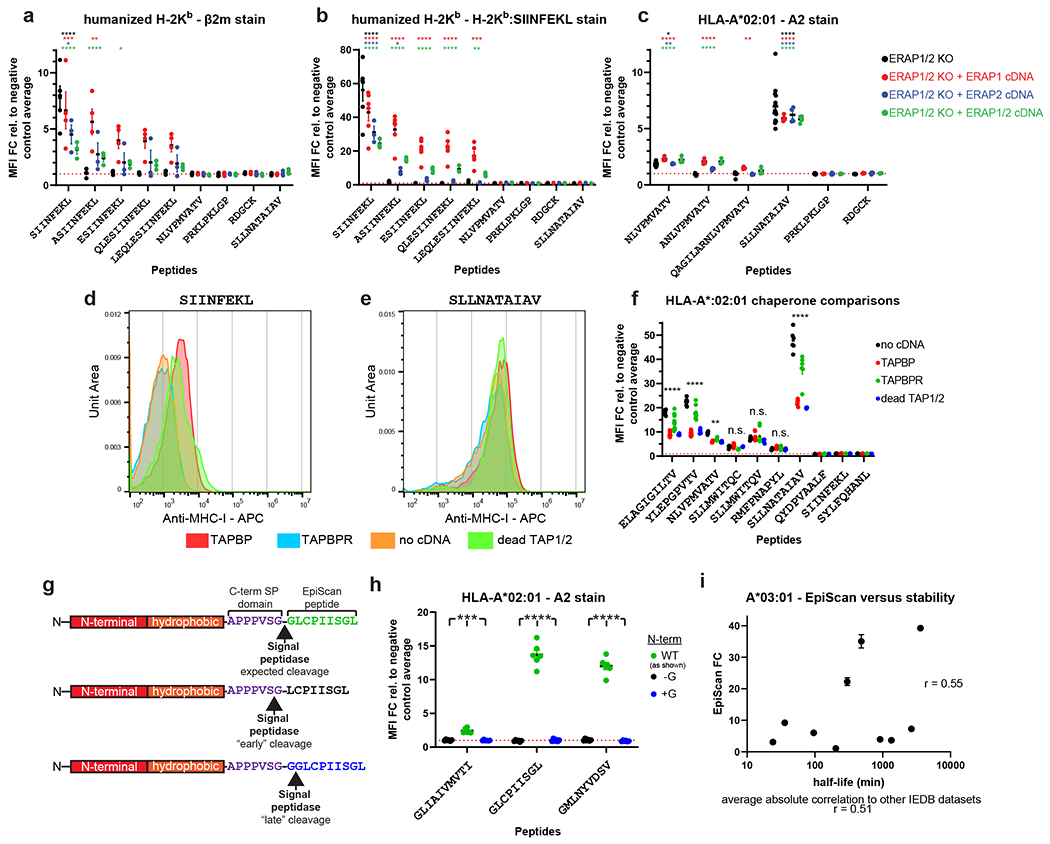
(a-c) Examining the role of ERAP1 and ERAP2 in the processing of exogenous peptides delivered to the ER. EpiScan SPP WT cells, with or without exogenous ERAP1/2 complementation, expressing the indicated MHC class I alleles and EpiScan vectors expressing the indicated peptides and MHC class I levels assessed by flow cytometry using the indicated antibodies. Data are biological replicates, mean±SEM of the fold change (FC) in mean fluorescence intensity (MFI) relative to the average of negative control (NC) peptides, PRKLPKLGP and RDGCK. *p<0.05, **p<0.01, ***p<0.001, ****p<0.0001 for each group relative to RDGCK by one-way ANOVA with Dunnett’s test. (a) ERAP1/2 KO n=5, ERAP1 n=4, and ERAP2, ERAP1/2 n=3. (b) ERAP1/2 KO, ERAP1 n=6, and ERAP2 cDNA, ERAP1/2 n=3. For (c), n=7 for ERAP1/2 KO except for SIINFEKL and SLLNATAIAV which were n=15 and NLVPMVATC n=12, n=4 for ERAP1, ERAP2 and ERAP1/2. (d-f) EpiScan signal-to-noise with chaperone over-expression. Surface MHC class I flow cytometry of EpiScan SPP KO HLA-A*02 cells expressing SIINFEKL (d), SLLNATAIAV (e), and other peptides (f). (f) Data are biological replicates, mean±SEM of the FC in MFI relative to the average of NC peptides. For deadTAP1/2 and no cDNA n=6. For TAPBP and TAPBPR, n=10, except for NLVPMVATV and SLLNATAIAV n=6 and ELAGIGILTV n=14. **p<0.01, ****p<0.0001 by two-way ANOVA for the no cDNA cells relative to other conditions. Symbols indicate the highest p-value for the comparisons within a peptide. (g and h) Signal peptidase cleavage accuracy. (g) Schematic of potential signal peptidase cleavage events. (h) Flow cytometry for surface MHC class I was performed on EpiScan SPP KO HLA-A*02 cells expressing peptides as shown, with an additional glycine, or without the initial glycine. Data are biological replicates, n =6, mean±SEM of the FC in MFI relative to the NC peptide average. *p<0.05, **p<0.01, ***p<0.001, ****p<0.0001 by two-way ANOVA for the wild-type 9-mer peptides relative to either (-G) or (+G) peptides. (i) EpiScan A*03:01 compared to IEDB stability data, and Spearman correlation. Data are mean±SEM of the FC in MFI relative to the NC peptide average, n=3. Below, the average absolute correlation of the data shown relative to other IEDB datasets with the same peptides.
Extended Data Fig. 4. Digital droplet PCR, EpiScan sorting schematics, and shared allele peptide validation.
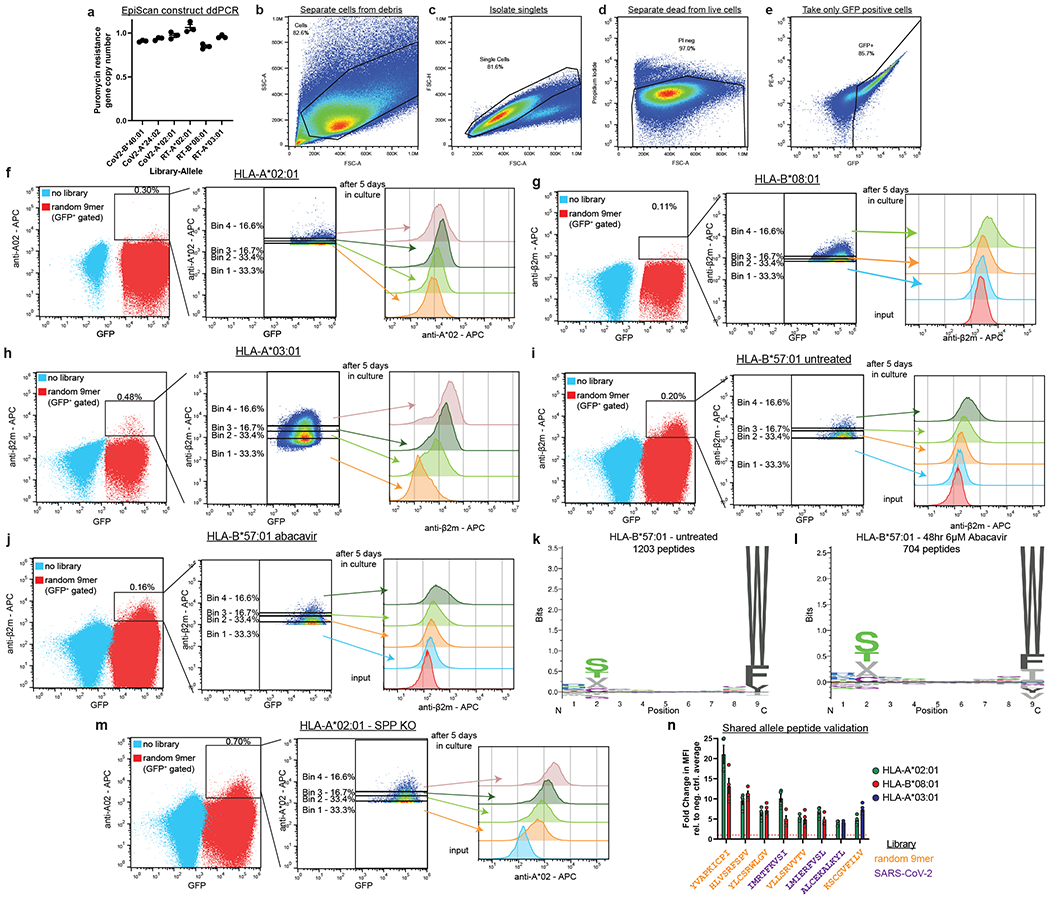
(a) Digital droplet PCR of EpiScan gDNA input libraries quantifying the average copy number of EpiScan vectors per cell. Data are represented as mean ± SEM puromycin resistance gene positive droplet number normalized relative to the positive drop number for a control genomic sequence, RPP30. N = 3 of technical replicates. (b-j) Sorting strategy for the random 9-mer EpiScan screens and HLA-B*57:01 abacavir comparison. EpiScan cells were infected with lentiviral vectors expressing the random 9-mer library and GFP, selected with puromycin and sorted into four bins. After five days in culture, the sorted cells were stained and analyzed by flow cytometry to assess enrichment elevated cell surface MHC class I. (b) First, cells are gated away from debris. (c) Doublets are excluded. (d) Dead cells (propidium iodide positive) are excluded. (e) Cells expressing the EpiScan vector (GFP positive) are selected. The alleles assayed were (f) HLA-A*02:01, (g) HLA-B*08:01, (h) HLA-A*03:01, (i) HLA-B*57:01, and (j) HLA-B*57:01 after 48 h abacavir treatment at 6 μM. Except for the HLA-B*57:01 screen in the presence of abacavir, all screens were performed in duplicate. (k and l) Logoplots summarize the composition of the peptide ligands identified in HLA-B*57:01-expressing cells, either untreated (j) or treated with abacavir for 48 h (k). (m) Cell sorting results for HLA-A*02:01 with SPP KO. (n) EpiScan validation of peptides that were found to be binders to multiple alleles via screens. Bar colors indicate which alleles was tested, and peptide text colors represent which screening library the hit was derived from. Data are represented as mean ± SEM of the fold change in mean fluorescence intensity (MFI) relative to the average of negative control peptides. Each dot represents a different biological replicate.
Extended Data Fig. 5. EpiScan systematic differences in amino acid representation of MHC class I ligands relative to mass spectrometry.
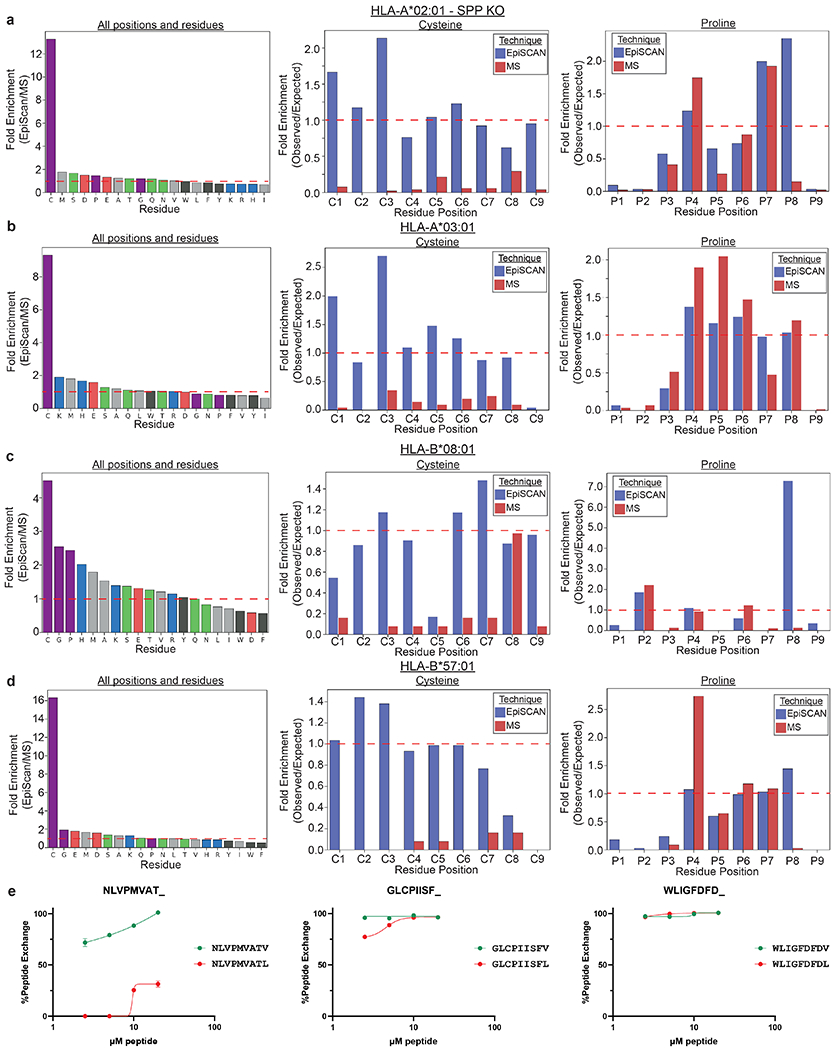
(a-d) The bar graphs on the left show the fold difference in amino acid representation across all positions and residues for the indicated allele. The bar graphs in the middle and left represent the fold enrichment of cysteine (middle) and proline (right) across each position of MHC class I peptide ligands, relative to the expected frequency based on the overall abundance of cysteine in the random 9-mer library (EpiScan data) or the human proteome (MS data). The MHC class I alleles assayed were (a) HLA-A*02:01, (b) HLA-A*03:01, (c) HLA-B*08:01 and (d) HLA-B*57:01. (e) Peptide tetramer exchange assays on L- versus V-ended 9mer peptides with HLA-A*02:01. Data are from three technical replicates represented as mean ± SEM and curves fit by four parameter nonlinear regression.
Extended Data Fig. 6. Validation of MHC class I ligands expressed by SARS-CoV-2.
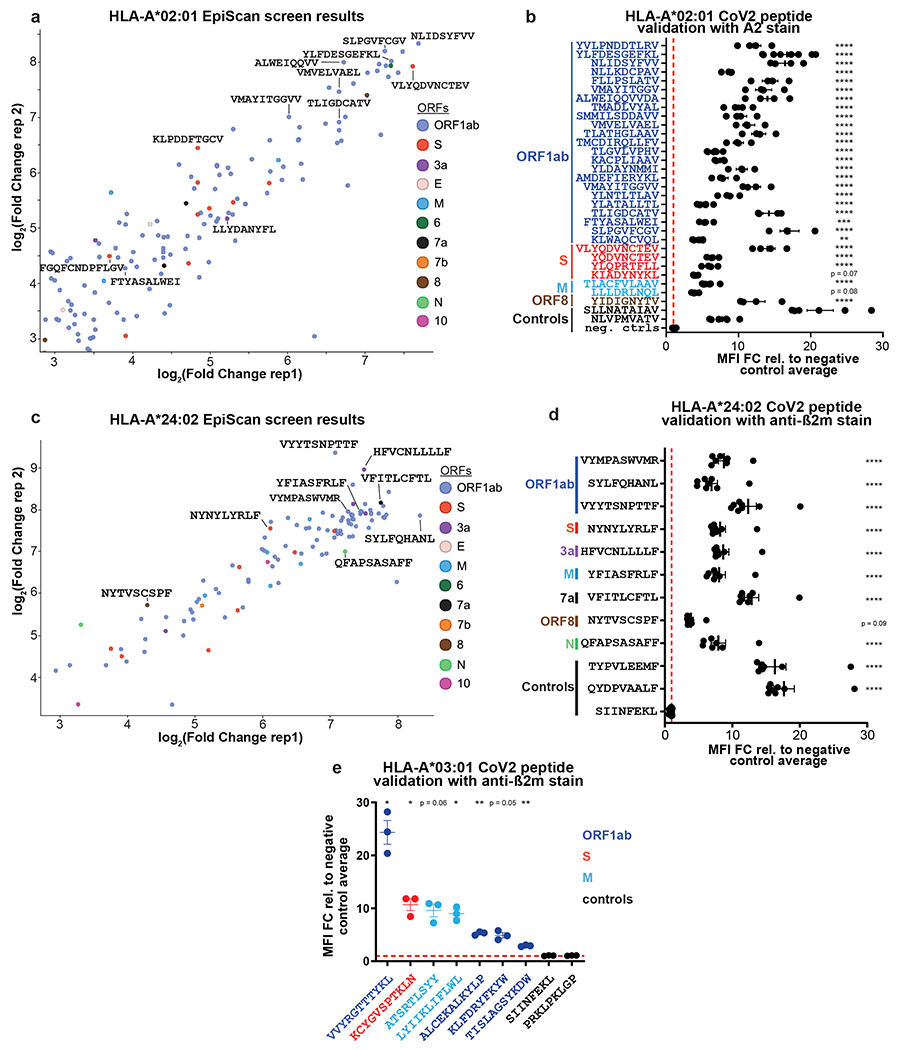
(a) SARS-CoV-2 EpiScan SPP-KO screen results for HLA-A*02:01. Scatterplot showing HLA-A*02 peptide ligands concordantly identified across screen replicates. (b) Individual validation of HLA-A*02:01 screen hits in the EpiScan assay. HLA-A*02:01-expressing EpiScan cells were transduced with lentiviral EpiScan vectors expressing the indicated peptides were introduced into HLA-A*02:01-expressing EpiScan cells and cell surface MHC class I levels were measured by flow cytometry. Data are represented as mean ± SEM of the fold change in mean fluorescence intensity (MFI) relative to the average of negative control peptides. Each dot represents a different biological replicate, with n = 6 for the controls and n = 4 for the rest **p = 0.002, ***p = 0.0003, ****p < 0.0001 for each group relative to the SIINFEKL peptide by one-way ANOVA with Dunnett’s multiple-comparison test. (c) SARS-CoV-2 EpiScan screen results for HLA-A*02:01. Scatterplot showing HLA-A*024:02 peptide ligands concordantly identified across screen replicates. (d) Individual validation of HLA-A*24:02 screen hits in the EpiScan assay. Lentiviral vectors expressing the indicated peptides were introduced into HLA-A*24:02-expressing EpiScan cells and an increase in cell surface MHC class I was measured by flow cytometry. Data are represented as mean ± SEM of the fold change in mean fluorescence intensity (MFI) relative to the average of negative control peptides. Each dot represents a different biological replicate, with n = 7 for VYMPASWVMR, QFAPSASAFF, and YFIASFRLF, and n = 8 for the rest. ****p < 0.0001 for each group relative to the SIINFEKL peptide by one-way ANOVA with Dunnett’s multiple-comparison test. (e) Individual validation of HLA-A*03:01 screen hits with less common anchor residues in the EpiScan assay. Lentiviral vectors expressing the indicated peptides were introduced into HLA-A*03:01-expressing EpiScan cells and an increase in cell surface MHC class I was measured by flow cytometry. Data are represented as mean ± SEM of the fold change in mean fluorescence intensity (MFI) relative to the average of negative control peptides. Each dot represents a different biological replicate for n = 3. *p < 0.05, **p < 0.01, for each group relative to the negative control peptides by one-way ANOVA with Dunnett’s multiple-comparison test.
Extended Data Fig. 7. EpiScan of SARS-CoV-2 Spike variants and tetramer staining.
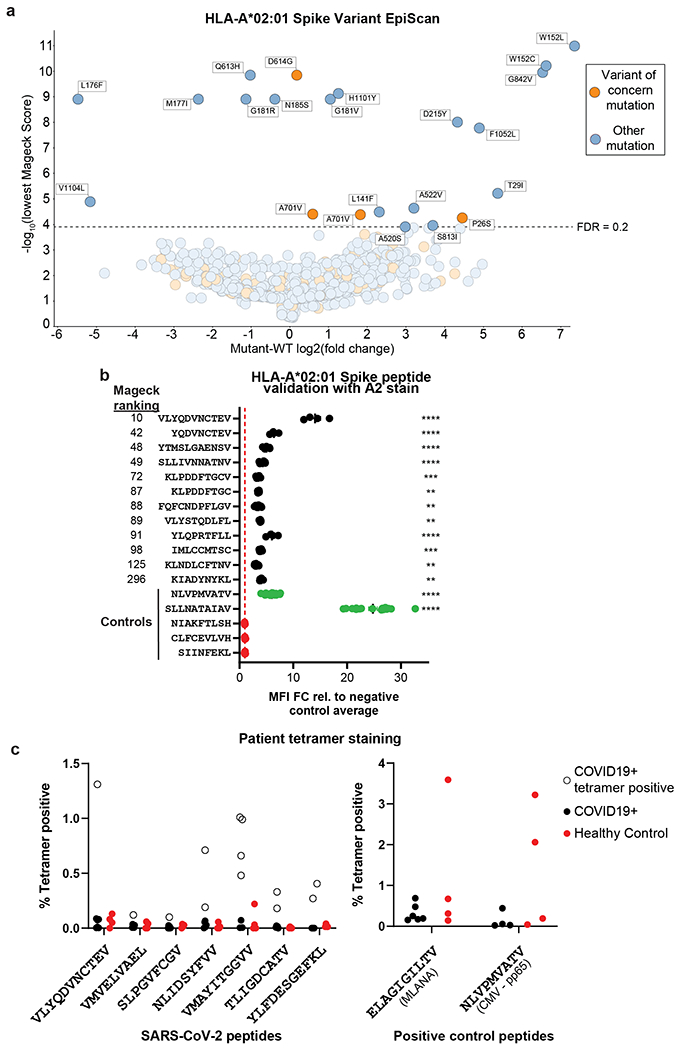
(a) SARS-CoV-2 Spike Variant EpiScan screen results for HLA-A*02:01. Scatterplot showing the difference between wildtype and mutant in EpiScan enrichment for SARS-CoV-2 Spike peptides. Negative log2(fold change) values were set to zero prior to subtraction, and peptide pairs with no difference in log2(fold change) are omitted. Orange circles represent peptides that contain a mutation present in a variant of concern. Circles are grayed out for the peptide pairs in which neither constituent was below the FDR threshold of 0.20. (b) Individual validation of HLA-A*02:01 Spike screen hits in the EpiScan assay. Data are represented as mean ± SEM of the fold change in mean fluorescence intensity (MFI) relative to the average of negative control peptides in red. Spike peptides are arranged from top to bottom by relative screen rank, with peptides on the top ranked higher by Mageck as shown on the right. Each dot represents a different biological replicate, with n = 19 for SLLNATAIAV and NLVPMVATV, n = 15 for SIINFEKL, n = 10 for FQFCNDPFLGV and KLNDLCFTNV, n = 4 for VLYQDVNCTEV, YQDVNCTEV, YLQPRTFLL, and KIADYNYKL, and n = 6 for the rest. **p < 0.01, ***p < 0.001, ****p < 0.0001 for each group relative to the SIINFEKL peptide by one-way ANOVA with Dunnett’s multiple-comparison test. (c) Tetramer staining of CD8 memory T cells. Dot plot values are the percent HLA-A*02:01 tetramer positive CD8+ T cells for convalescent COVID-19 samples (black solid or empty circle, n = 7) and healthy control samples (red, n = 4). On left, SARS-CoV-2 peptides are shown. On the right, ELAGIGILTV and NLPMVATV are positive control peptides derived from MLANA and CMV pp65 proteins, respectively. Dots on the y-axis are zero values that would otherwise not be displayed on a log2 axis.
Extended Data Fig. 8. SARS-CoV-2 EpiScan screen results are enriched for T cell epitopes.
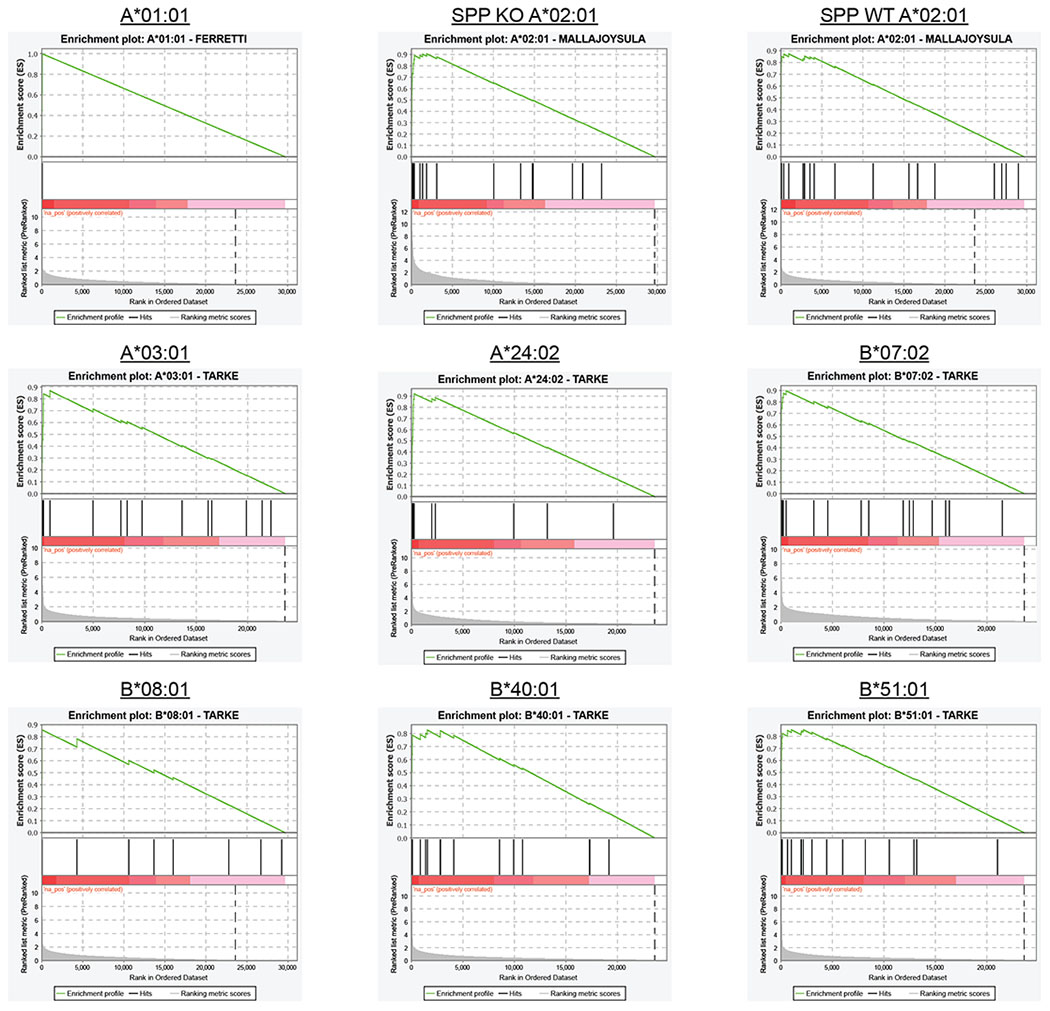
Here, representative EpiScan GSEA plots of previously published SARS-CoV-2 T cell epitope sets are shown. For most of the EpiScan alleles, more than one peptide set from the same allele scored as significant, but only one is shown for demonstration purposes. Full GSEA statistical output from the top five enriched sets of each EpiScan allele are shown in Supplementary Table 6.
Extended Data Fig. 9. Examination of biased-anchor peptide ligands.
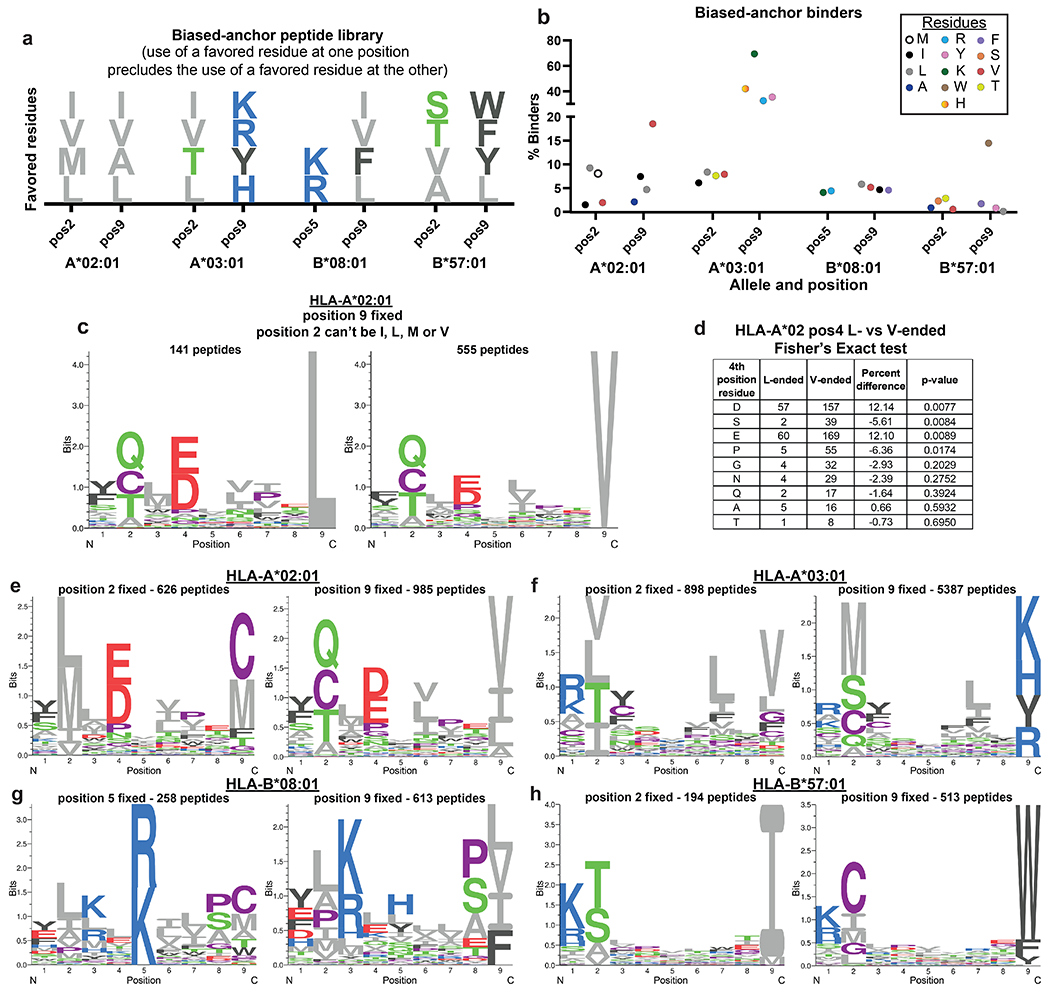
(a) Schematic representation of the library design used to examine biased-anchor peptide ligands. The favored residues at each anchor position are shown for the indicated MHC class I allele; peptides selected for characterization by EpiScan contained a favored residue at one of the critical anchor positions but an unfavored residue at the other. (b) Evaluation of biased-anchor binders by EpiScan. The percent of binders for the given fixed residues at each anchor position are shown. (c) Logoplots summarize the sequences of the MHC class I ligands identified by EpiScan for HLA-A*02:01 where the ninth position has been fixed with either leucine or valine and isoleucine, leucine, methionine and valine are excluded from the second position. (d) Statistical analysis of the residues at the fourth position of biased-anchor HLA-A*02:01 ligands identified by EpiScan that ended with either L or V. A positive percent difference indicates a larger fraction of that amino acid occurred in L-ended peptides relative to V-ended peptides. P-values were determined by a two-tailed Fisher’s exact test, comparing amino acids at the fourth position across the two conditions (only those seen at least seven times are shown). (e to h) Logoplots summarizing the composition of biased-anchor MHC class I ligands identified by EpiScan, wherein one anchor position contains a favored residue but the other anchor position does not: (c) HLA-A*02:01, with positions 2 and 9 as anchors, (d) HLA-A*03:01, with positions 2 and 9 as anchors, (e) HLA-B*08:01, with positions 5 and 9 as anchors, and (f) HLA-B*57:01 with positions 2 and 9 as anchors.
Extended Data Fig. 10. Evaluating the performance of the indicated algorithms by EpiScan.
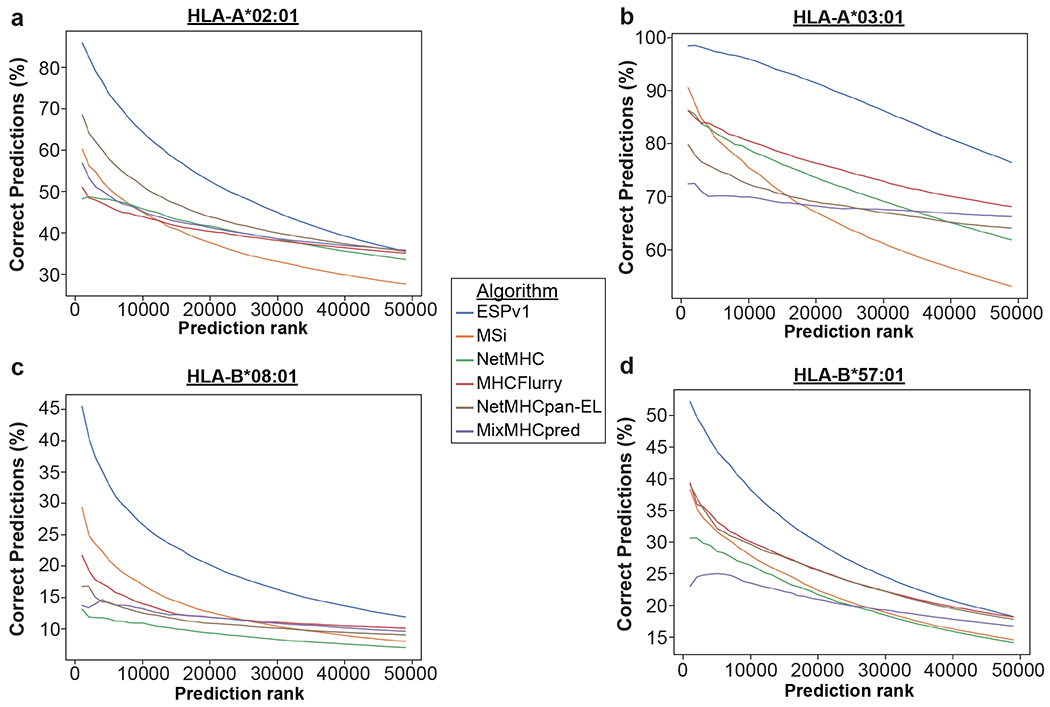
These algorithms were used to predict the top 50,000 binders for each allele from the human (9-mer) proteome, and EpiScan screens were used to evaluate the accuracy of these predictions. Not all 50,000 top binders for MHCFlurry, NetMHCpan-BA, and MixMHCpred were present in the library and so the overlap between each algorithm’s top 50,000 and those present were used. Overlap for each algorithm/allele: MHCFlurry: A2 – 43973 A3 – 44218 B8 – 35212 B57 - 43746 mixMHCpred: A2 – 31605 A3 – 35217 B8 – 31624 B57 – 40400 NetMHCpan: A2 – 40711 A3 – 42199 B8 – 36766 B57 - 44541
Supplementary Material
Acknowledgments:
The authors would like to thank members of the Elledge lab for discussion and advice, M.Z. Li and MSBioworks for technical assistance, and C. O’Leary and C. Wang for thoughts and comments on the manuscript. The MGH/MassCPR COVID biorepository was supported by a gift from Ms. Enid Schwartz, by the Mark and Lisa Schwartz Foundation, the Massachusetts Consortium for Pathogen Readiness and the Ragon Institute of MGH, MIT and Harvard. This study was supported by the following funding sources: Howard Hughes Medical Institute Fellow of the Jane Coffin Childs Memorial Fund (P.M.B.), Pemberton-Trinity Fellow and a Sir Henry Wellcome Postdoctoral Fellow 201387/ Z/16/Z (R.T.T.), Howard Hughes Medical Institute Investigator (S.J.E.), Department of Defense BC171184 (S.J.E.), Massachusetts Consortium on Pathogenesis Readiness (S.J.E., X.G.Y., D.R.W.), National Institutes of Health grant AI139538 (D.R.W.), 5R01CA234600 (S.J.E.) and Fast Grant funding for COVID-19 science (D.R.W.).
Footnotes
Competing interests: S.J.E. is a founder of TSCAN Therapeutics, MAZE Therapeutics, ImmuneID and Mirimus, serves on the scientific advisory boards of Homology Medicines, ImmuneID, MAZE Therapeutics and TSCAN Therapeutics, and is an advisor for MPM Capital; none of which affect this work. P.M.B. and S.J.E. are inventors of and have submitted a patent on the EpiScan technology. The remaining authors have no competing interests to declare.
Code Availability:
Custom Python script to generate and evaluate models to predict MHC class I ligands is available in the Supplementary Information file. EpiScan binding predictions can be generated via the web interface available at https://www.episcan-predictor.com. A dockerized version of EpiScan Predictor is available on the website also.
Data availability:
Plasmids and cell lines generated in this study are available upon reasonable request, and subject to MTA, from the Lead Contact. The databases used were the NCBI Severe acute respiratory syndrome coronavirus 2 data hub, (https://www.ncbi.nlm.nih.gov/labs/virus/vssi/#/), GISAID (https://gisaid.org/), SwissProt Human (https://www.uniprot.org/proteomes/UP000005640), and IEDB (https://www.iedb.org/, also Source Data S1). The mass spectrometry proteomics data have been deposited to the ProteomeXchange Consortium (http://proteomecentral.proteomexchange.org) via the PRIDE partner repository92 with the dataset identifier PXD036939. All screening data can be found in the Source Data files.
References
- 1.Chaplin DD Overview of the immune response. J. Allergy Clin. Immunol 125, S3–23 (2010). [DOI] [PMC free article] [PubMed] [Google Scholar]
- 2.Rock KL et al. Inhibitors of the proteasome block the degradation of most cell proteins and the generation of peptides presented on MHC class I molecules. Cell 78, 761–771 (1994). [DOI] [PubMed] [Google Scholar]
- 3.Neefjes J, Jongsma MLM, Paul P & Bakke O Towards a systems understanding of MHC class I and MHC class II antigen presentation. Nat. Rev. Immunol 11, (2011). [DOI] [PubMed] [Google Scholar]
- 4.Shen L, Sigal LJ, Boes M & Rock KL Important role of cathepsin S in generating peptides for TAP-independent MHC class I crosspresentation in vivo. Immunity 21, 155–165 (2004). [DOI] [PubMed] [Google Scholar]
- 5.Embgenbroich M & Burgdorf S Current concepts of antigen cross-presentation. Frontiers in Immunology vol. 9 1643 (2018). [DOI] [PMC free article] [PubMed] [Google Scholar]
- 6.Walz S et al. The antigenic landscape of multiple myeloma: Mass spectrometry (re)defines targets for T-cell-based immunotherapy. Blood 126, 1203–1213 (2015). [DOI] [PMC free article] [PubMed] [Google Scholar]
- 7.Rock KL, Reits E & Neefjes J Present Yourself! By MHC Class I and MHC Class II Molecules. Trends Immunol. 37, 724–737 (2016). [DOI] [PMC free article] [PubMed] [Google Scholar]
- 8.Sarkizova S et al. A large peptidome dataset improves HLA class I epitope prediction across most of the human population. Nat. Biotechnol 38, 199–209 (2020). [DOI] [PMC free article] [PubMed] [Google Scholar]
- 9.Luescher IF, Romero P, Cerottini JC & Maryanski JL Specific binding of antigenic peptides to cell-associated MHC class I molecules. Nature 351, 72–74 (1991). [DOI] [PubMed] [Google Scholar]
- 10.Elvin J, Cerundolo V, Elliott T & Townsend A A quantitative assay of peptide-dependent class I assembly. Eur. J. Immunol 21, 2025–31 (1991). [DOI] [PubMed] [Google Scholar]
- 11.Stuber G et al. Assessment of major histocompatibility complex class I interaction with Epstein-Barr virus and human immunodeficiency virus peptides by elevation of membrane H-2 and HLA in peptide loading-deficient cells. Eur. J. Immunol 22, 2697–703 (1992). [DOI] [PubMed] [Google Scholar]
- 12.Nijman HW et al. Identification of peptide sequences that potentially trigger HLA-A2.1-restricted cytotoxic T lymphocytes. Eur. J. Immunol 23, 1215–1219 (1993). [DOI] [PubMed] [Google Scholar]
- 13.Townsend A et al. Association of class I major histocompatibility heavy and light chains induced by viral peptides. Nature 340, 443–8 (1989). [DOI] [PubMed] [Google Scholar]
- 14.Androlewicz MJ, Anderson KS & Cresswell P Evidence that transporters associated with antigen processing translocate a major histocompatibility complex class I-binding peptide into the endoplasmic reticulum in an ATP-dependent manner. Proc. Natl. Acad. Sci. U. S. A 90, 9130–9134 (1993). [DOI] [PMC free article] [PubMed] [Google Scholar]
- 15.Gejman RS et al. Identification of the Targets of T-cell Receptor Therapeutic Agents and Cells by Use of a High-Throughput Genetic Platform. Cancer Immunol. Res 1–13 (2020) doi: 10.1158/2326-6066.cir-19-0745. [DOI] [PMC free article] [PubMed] [Google Scholar]
- 16.Serwold T, Gonzalez F, Kim J, Jacob R & Shastri N ERAAP customizes peptides for MHC class I molecules in the endoplasmic reticulum. Nature 419, 480–483 (2002). [DOI] [PubMed] [Google Scholar]
- 17.Saveanu L et al. Concerted peptide trimming by human ERAP1 and ERAP2 aminopeptidase complexes in the endoplasmic reticulum. Nat. Immunol 6, 689–697 (2005). [DOI] [PubMed] [Google Scholar]
- 18.Gejman RS et al. Rejection of immunogenic tumor clones is limited by clonal fraction. Elife 7, 1–22 (2018). [DOI] [PMC free article] [PubMed] [Google Scholar]
- 19.Porgador A, Yewdell JW, Deng Y, Bennink JR & Germain RN Localization, quantitation, and in situ detection of specific peptide-MHC class I complexes using a monoclonal antibody. Immunity 6, 715–26 (1997). [DOI] [PubMed] [Google Scholar]
- 20.Thomas C & Tampé R MHC I assembly and peptide editing — chaperones, clients, and molecular plasticity in immunity. Curr. Opin. Immunol 70, 48–56 (2021). [DOI] [PubMed] [Google Scholar]
- 21.Vita R et al. The immune epitope database (IEDB) 3.0. Nucleic Acids Res. 43, D405–D412 (2015). [DOI] [PMC free article] [PubMed] [Google Scholar]
- 22.Sachs A et al. Impact of Cysteine Residues on MHC Binding Predictions and Recognition by Tumor-Reactive T Cells. J. Immunol 205, 539–549 (2020). [DOI] [PMC free article] [PubMed] [Google Scholar]
- 23.Bassani-Sternberg M, Pletscher-Frankild S, Jensen LJ & Mann M Mass spectrometry of human leukocyte antigen class i peptidomes reveals strong effects of protein abundance and turnover on antigen presentation. Mol. Cell. Proteomics 14, 658–673 (2015). [DOI] [PMC free article] [PubMed] [Google Scholar]
- 24.Yuen GJ, Weller S & Pakes GE A Review of the Pharmacokinetics of Abacavir. Clin. Pharmacokinet 47, 351–371 (2008). [DOI] [PubMed] [Google Scholar]
- 25.Martin AM et al. Predisposition to abacavir hypersensitivity conferred by HLA-B*5701 and a haplotypic Hsp70-Hom variant. Proc. Natl. Acad. Sci. U. S. A 101, 4180–5 (2004). [DOI] [PMC free article] [PubMed] [Google Scholar]
- 26.Ostrov DA et al. Drug hypersensitivity caused by alteration of the MHC-presented self-peptide repertoire. Proc. Natl. Acad. Sci. U. S. A 109, 9959–64 (2012). [DOI] [PMC free article] [PubMed] [Google Scholar]
- 27.Wei ML & Cresswell P HLA-A2 molecules in an antigen-processing mutant cell contain signal sequence-derived peptides. Nature 356, 443–446 (1992). [DOI] [PubMed] [Google Scholar]
- 28.Henderson RA et al. HLA-A2.1-Associated peptides from a mutant cell line: A second pathway of antigen presentation. Science (80-.). 255, 1264–1266 (1992). [DOI] [PubMed] [Google Scholar]
- 29.Weihofen A, Binns K, Lemberg MK, Ashman K & Martoglio B Identification of signal peptide peptidase, a presenilin-type aspartic protease. Science (80-.). 296, 2215–2218 (2002). [DOI] [PubMed] [Google Scholar]
- 30.Choo KH & Ranganathan S Flanking signal and mature peptide residues influence signal peptide cleavage. BMC Bioinformatics 9, 1–11 (2008). [DOI] [PMC free article] [PubMed] [Google Scholar]
- 31.Gfeller D & Bassani-Sternberg M Predicting antigen presentation-What could we learn from a million peptides? Frontiers in Immunology vol. 9 1716 (2018). [DOI] [PMC free article] [PubMed] [Google Scholar]
- 32.Andreatta M & Nielsen M Gapped sequence alignment using artificial neural networks: application to the MHC class I system. Bioinformatics 32, 511–517 (2016). [DOI] [PMC free article] [PubMed] [Google Scholar]
- 33.Nielsen M et al. Reliable prediction of T-cell epitopes using neural networks with novel sequence representations - Nielsen - 2009 - Protein Science - Wiley Online Library. Protein Sci. 12, 1007–1017 (2003). [DOI] [PMC free article] [PubMed] [Google Scholar]
- 34.Harris JL, Alper PB, Li J, Rechsteiner M & Backes BJ Substrate specificity of the human proteasome. Chem. Biol 8, 1131–1141 (2001). [DOI] [PubMed] [Google Scholar]
- 35.Abelin JG et al. Mass Spectrometry Profiling of HLA-Associated Peptidomes in Mono-allelic Cells Enables More Accurate Epitope Prediction. Immunity 46, 315–326 (2017). [DOI] [PMC free article] [PubMed] [Google Scholar]
- 36.Zhang X et al. Viral and host factors related to the clinical outcome of COVID-19. Nature 1–7 (2020) doi: 10.1038/s41586-020-2355-0. [DOI] [PubMed] [Google Scholar]
- 37.Rydyznski Moderbacher C et al. Antigen-Specific Adaptive Immunity to SARS-CoV-2 in Acute COVID-19 and Associations with Age and Disease Severity. Cell 183, 996–1012.e19 (2020). [DOI] [PMC free article] [PubMed] [Google Scholar]
- 38.Sekine T et al. Robust T Cell Immunity in Convalescent Individuals with Asymptomatic or Mild COVID-19. Cell 183, 158–168.e14 (2020). [DOI] [PMC free article] [PubMed] [Google Scholar]
- 39.Kusnadi A et al. Severely ill COVID-19 patients display impaired exhaustion features in SARS-CoV-2-reactive CD8 + T cells . Sci. Immunol 6, eabe4782 (2021). [DOI] [PMC free article] [PubMed] [Google Scholar]
- 40.Takahashi T et al. Sex differences in immune responses that underlie COVID-19 disease outcomes. Nature 588, 315–320 (2020). [DOI] [PMC free article] [PubMed] [Google Scholar]
- 41.Mallajosyula V et al. CD8+ T cells specific for conserved coronavirus epitopes correlate with milder disease in COVID-19 patients. Sci. Immunol 6, eabg5669 (2021). [DOI] [PMC free article] [PubMed] [Google Scholar]
- 42.Soresina A et al. Two X-linked agammaglobulinemia patients develop pneumonia as COVID-19 manifestation but recover. Pediatr. Allergy Immunol 31, 565–569 (2020). [DOI] [PMC free article] [PubMed] [Google Scholar]
- 43.Mira E et al. Rapid recovery of a SARS-CoV-2–infected X-linked agammaglobulinemia patient after infusion of COVID-19 convalescent plasma. J. Allergy Clin. Immunol. Pract 8, 2793–2795 (2020). [DOI] [PMC free article] [PubMed] [Google Scholar]
- 44.Jin H et al. Three patients with X-linked agammaglobulinemia hospitalized for COVID-19 improved with convalescent plasma. J. Allergy Clin. Immunol. Pract 8, 3594–3596.e3 (2020). [DOI] [PMC free article] [PubMed] [Google Scholar]
- 45.Harvey WT et al. SARS-CoV-2 variants, spike mutations and immune escape. Nat. Rev. Microbiol 19, 409–424 (2021). [DOI] [PMC free article] [PubMed] [Google Scholar]
- 46.Weingarten-Gabbay S et al. SARS-CoV-2 infected cells present HLA-I peptides from canonical and out-of-frame ORFs. doi: 10.1101/2020.10.02.324145. [DOI] [Google Scholar]
- 47.Toussaint NC, Maman Y, Kohlbacher O & Louzoun Y Universal peptide vaccines - Optimal peptide vaccine design based on viral sequence conservation. Vaccine 29, 8745–8753 (2011). [DOI] [PubMed] [Google Scholar]
- 48.Ashkenazy H et al. ConSurf 2016: an improved methodology to estimate and visualize evolutionary conservation in macromolecules. Nucleic Acids Res. 44, W344–W350 (2016). [DOI] [PMC free article] [PubMed] [Google Scholar]
- 49.Celniker G et al. ConSurf: Using evolutionary data to raise testable hypotheses about protein function. Israel Journal of Chemistry vol. 53 199–206 (2013). [Google Scholar]
- 50.Le Bert N et al. SARS-CoV-2-specific T cell immunity in cases of COVID-19 and SARS, and uninfected controls. Nature 2020.05.26.115832 (2020) doi: 10.1038/s41586-020-2550-z. [DOI] [PubMed] [Google Scholar]
- 51.Dan JM et al. Immunological memory to SARS-CoV-2 assessed for up to 8 months after infection. Science (80-.). 371, eabf4063 (2021). [DOI] [PMC free article] [PubMed] [Google Scholar]
- 52.Ferretti AP et al. Unbiased Screens Show CD8+ T Cells of COVID-19 Patients Recognize Shared Epitopes in SARS-CoV-2 that Largely Reside outside the Spike Protein. Immunity 53, 1095–1107.e3 (2020). [DOI] [PMC free article] [PubMed] [Google Scholar]
- 53.Saini SK et al. SARS-CoV-2 genome-wide T cell epitope mapping reveals immunodominance and substantial CD8 + T cell activation in COVID-19 patients. Sci. Immunol 6, eabf7550 (2021). [DOI] [PMC free article] [PubMed] [Google Scholar]
- 54.Tarke A et al. Comprehensive analysis of T cell immunodominance and immunoprevalence of SARS-CoV-2 epitopes in COVID-19 cases. Cell Reports Med. 2, 100204 (2021). [DOI] [PMC free article] [PubMed] [Google Scholar]
- 55.Croft NP et al. Most viral peptides displayed by class I MHC on infected cells are immunogenic. Proc. Natl. Acad. Sci. U. S. A 116, 3112–3117 (2019). [DOI] [PMC free article] [PubMed] [Google Scholar]
- 56.Andreatta M & Nielsen M Gapped sequence alignment using artificial neural networks: Application to the MHC class i system. Bioinformatics 32, 511–517 (2015). [DOI] [PMC free article] [PubMed] [Google Scholar]
- 57.O’Donnell TJ et al. MHCflurry: Open-Source Class I MHC Binding Affinity Prediction. Cell Syst. 7, 129–132.e4 (2018). [DOI] [PubMed] [Google Scholar]
- 58.Scott DW & De Groot AS Can we prevent immunogenicity of human protein drugs? Annals of the Rheumatic Diseases vol. 69 (2010). [DOI] [PubMed] [Google Scholar]
- 59.Parker KC, Bednarek MA & Coligan JE Scheme for ranking potential HLA-A2 binding peptides based on independent binding of individual peptide side-chains. J. Immunol 152, 163–75 (1994). [PubMed] [Google Scholar]
- 60.Stryhn A et al. Peptide binding specificity of major histocompatibility complex class I resolved into an array of apparently independent subspecificities: quantitation by peptide libraries and improved prediction of binding. Eur. J. Immunol 26, 1911–8 (1996). [DOI] [PubMed] [Google Scholar]
- 61.Trujillo JA et al. The cellular redox environment alters antigen presentation. J. Biol. Chem 289, 27979–27991 (2014). [DOI] [PMC free article] [PubMed] [Google Scholar]
- 62.Kula T et al. T-Scan: A Genome-wide Method for the Systematic Discovery of T Cell Epitopes. Cell 178, 1016–1028.e13 (2019). [DOI] [PMC free article] [PubMed] [Google Scholar]
- 63.Winter MB et al. Immunoproteasome functions explained by divergence in cleavage specificity and regulation. Elife 6, (2017). [DOI] [PMC free article] [PubMed] [Google Scholar]
- 64.López de Castro JA How ERAP1 and ERAP2 Shape the Peptidomes of Disease-Associated MHC class I Proteins. Front. Immunol 9, 2463 (2018). [DOI] [PMC free article] [PubMed] [Google Scholar]
- 65.Reeves E, Edwards CJ, Elliott T & James E Naturally Occurring ERAP1 Haplotypes Encode Functionally Distinct Alleles with Fine Substrate Specificity. J. Immunol 191, 35–43 (2013). [DOI] [PMC free article] [PubMed] [Google Scholar]
- 66.Nielsen M, Lundegaard C, Lund O & Keşmir C The role of the proteasome in generating cytotoxic T-cell epitopes: Insights obtained from improved predictions of proteasomal cleavage. Immunogenetics 57, 33–41 (2005). [DOI] [PubMed] [Google Scholar]
- 67.Cruz FM, Colbert JD, Merino E, Kriegsman BA & Rock KL The biology and underlying mechanisms of cross-presentation of exogenous antigens on MHC class I molecules. Annu. Rev. Immunol 35, 149–176 (2017). [DOI] [PMC free article] [PubMed] [Google Scholar]
- 68.Guillaume P et al. The C-terminal extension landscape of naturally presented HLA-I ligands. Proc. Natl. Acad. Sci 201717277 (2018) doi: 10.1073/pnas.1717277115. [DOI] [PMC free article] [PubMed] [Google Scholar]
- 69.Samino Y et al. A Long N-terminal-extended Nested Set of Abundant and Antigenic Major Histocompatibility Complex Class I Natural Ligands from HIV Envelope Protein. J. Biol. Chem 281, 6358–6365 (2006). [DOI] [PubMed] [Google Scholar]
- 70.Hassan C et al. Naturally Processed Non-canonical HLA-A*02:01 Presented Peptides. J. Biol. Chem 290, 2593–2603 (2015). [DOI] [PMC free article] [PubMed] [Google Scholar]
- 71.Josephs TM, Grant EJ & Gras S Molecular challenges imposed by MHC class I restricted long epitopes on T cell immunity. Biol. Chem 398, 1027–1036 (2017). [DOI] [PubMed] [Google Scholar]
- 72.SG R et al. Unconventional Peptide Presentation by Major Histocompatibility Complex (MHC) Class I Allele HLA-A*02:01: BREAKING CONFINEMENT. J. Biol. Chem 292, 5262–5270 (2017). [DOI] [PMC free article] [PubMed] [Google Scholar]
- 73.Nödling AR, Spear LA, Williams TL, Luk LYP & Tsai YH Using genetically incorporated unnatural amino acids to control protein functions in mammalian cells. Essays in Biochemistry vol. 63 237–266 (2019). [DOI] [PMC free article] [PubMed] [Google Scholar]
- 74.Sibilio L et al. A Single Bottleneck in HLA-C Assembly. J. Biol. Chem 283, 1267–1274 (2008). [DOI] [PubMed] [Google Scholar]
- 75.Moreno AM et al. Immune-orthogonal orthologues of AAV capsids and of Cas9 circumvent the immune response to the administration of gene therapy. Nat. Biomed. Eng 3, 806–816 (2019). [DOI] [PMC free article] [PubMed] [Google Scholar]
- 76.Ajina R et al. SpCas9-expression by tumor cells can cause T cell-dependent tumor rejection in immunocompetent mice. Oncoimmunology 8, (2019). [DOI] [PMC free article] [PubMed] [Google Scholar]
- 77.Ayala García MA, González Yebra B, López Flores AL & Guaní Guerra E The Major Histocompatibility Complex in Transplantation. J. Transplant 2012, 1–7 (2012). [DOI] [PMC free article] [PubMed] [Google Scholar]
- 78.Deshpande P et al. Immunopharmacogenomics: Mechanisms of HLA-Associated Drug Reactions. Clin. Pharmacol. Ther 110, 607–615 (2021). [DOI] [PMC free article] [PubMed] [Google Scholar]
- 79.Yewdell JW Confronting Complexity: Real-World Immunodominance in Antiviral CD8+ T Cell Responses. Immunity 25, 533–543 (2006). [DOI] [PubMed] [Google Scholar]
- 80.Panagioti E, Klenerman P, Lee LN, van der Burg SH & Arens R Features of effective T cell-inducing vaccines against chronic viral infections. Frontiers in Immunology vol. 9 276 (2018). [DOI] [PMC free article] [PubMed] [Google Scholar]
- 81.Hu Z, Ott PA & Wu CJ Towards personalized, tumour-specific, therapeutic vaccines for cancer. Nat. Rev. Immunol 18, 168–182 (2018). [DOI] [PMC free article] [PubMed] [Google Scholar]
Methods-only References
- 82.Martin M Cutadapt removes adapter sequences from high-throughput sequencing reads. EMBnet.journal 17, 10 (2011). [Google Scholar]
- 83.Langmead B & Salzberg SL Fast gapped-read alignment with Bowtie 2. Nat. Methods 9, 357–359 (2012). [DOI] [PMC free article] [PubMed] [Google Scholar]
- 84.Kim Y, Sidney J, Pinilla C, Sette A & Peters B Derivation of an amino acid similarity matrix for peptide:MHC binding and its application as a Bayesian prior. BMC Bioinformatics 10, 394 (2009). [DOI] [PMC free article] [PubMed] [Google Scholar]
- 85.Bremel RD & Homan EJ An integrated approach to epitope analysis I: Dimensional reduction, visualization and prediction of MHC binding using amino acid principal components and regression approaches. Immunome Res. 6, 7 (2010). [DOI] [PMC free article] [PubMed] [Google Scholar]
- 86.Ashkenazy H, Erez E, Martz E, Pupko T & Ben-Tal N ConSurf 2010: Calculating evolutionary conservation in sequence and structure of proteins and nucleic acids. Nucleic Acids Res. 38, (2010). [DOI] [PMC free article] [PubMed] [Google Scholar]
- 87.Thomsen MCF & Nielsen M Seq2Logo: a method for construction and visualization of amino acid binding motifs and sequence profiles including sequence weighting, pseudo counts and two-sided representation of amino acid enrichment and depletion. Nucleic Acids Res. 40, W281–W287 (2012). [DOI] [PMC free article] [PubMed] [Google Scholar]
- 88.Reynisson B, Alvarez B, Paul S, Peters B & Nielsen M NetMHCpan-4.1 and NetMHCIIpan-4.0: improved predictions of MHC antigen presentation by concurrent motif deconvolution and integration of MS MHC eluted ligand data. Nucleic Acids Res. 48, W449–W454 (2020). [DOI] [PMC free article] [PubMed] [Google Scholar]
- 89.O’Donnell TJ, Rubinsteyn A & Laserson U MHCflurry 2.0: Improved Pan-Allele Prediction of MHC Class I-Presented Peptides by Incorporating Antigen Processing. Cell Syst. 11, 42–48.e7 (2020). [DOI] [PubMed] [Google Scholar]
- 90.Gfeller D et al. The Length Distribution and Multiple Specificity of Naturally Presented HLA-I Ligands. J. Immunol 201, 3705–3716 (2018). [DOI] [PubMed] [Google Scholar]
- 91.Li W et al. MAGeCK enables robust identification of essential genes from genome-scale CRISPR/Cas9 knockout screens. Genome Biol. 15, 554 (2014). [DOI] [PMC free article] [PubMed] [Google Scholar]
- 92.Perez-Riverol Y et al. The PRIDE database and related tools and resources in 2019: improving support for quantification data. Nucleic Acids Res. 47, D442–D450 (2019). [DOI] [PMC free article] [PubMed] [Google Scholar]
- 93.Verweij MC et al. The Capacity of UL49.5 Proteins To Inhibit TAP Is Widely Distributed among Members of the Genus Varicellovirus. J. Virol 85, 2351–2363 (2011). [DOI] [PMC free article] [PubMed] [Google Scholar]
- 94.Byun H et al. Requirements for mouse mammary tumor virus Rem signal peptide processing and function. J. Virol 86, 214–25 (2012). [DOI] [PMC free article] [PubMed] [Google Scholar]
- 95.Kober L, Zehe C & Bode J Optimized signal peptides for the development of high expressing CHO cell lines. Biotechnol. Bioeng 110, 1164–1173 (2013). [DOI] [PubMed] [Google Scholar]
Associated Data
This section collects any data citations, data availability statements, or supplementary materials included in this article.
Supplementary Materials
Data Availability Statement
Plasmids and cell lines generated in this study are available upon reasonable request, and subject to MTA, from the Lead Contact. The databases used were the NCBI Severe acute respiratory syndrome coronavirus 2 data hub, (https://www.ncbi.nlm.nih.gov/labs/virus/vssi/#/), GISAID (https://gisaid.org/), SwissProt Human (https://www.uniprot.org/proteomes/UP000005640), and IEDB (https://www.iedb.org/, also Source Data S1). The mass spectrometry proteomics data have been deposited to the ProteomeXchange Consortium (http://proteomecentral.proteomexchange.org) via the PRIDE partner repository92 with the dataset identifier PXD036939. All screening data can be found in the Source Data files.