

Abstract
Cancer cells often encounter hypoxic and hypo-nutrient conditions, which force them to make adaptive changes to meet their high demands for energy and various biomaterials for biomass synthesis. As a result, enhanced catabolism (breakdown of macromolecules for energy production) and anabolism (macromolecule synthesis from bio-precursors) are induced in cancer. This phenomenon is called “metabolic reprogramming,” a cancer hallmark contributing to cancer development, metastasis, and drug resistance. HCC and cholangiocarcinoma (CCA) are 2 different liver cancers with high intertumoral heterogeneity in terms of etiologies, mutational landscapes, transcriptomes, and histological representations. In agreement, metabolism in HCC or CCA is remarkably heterogeneous, although changes in the glycolytic pathways and an increase in the generation of lactate (the Warburg effect) have been frequently detected in those tumors. For example, HCC tumors with activated β-catenin are addicted to fatty acid catabolism, whereas HCC tumors derived from fatty liver avoid using fatty acids. In this review, we describe common metabolic alterations in HCC and CCA as well as metabolic features unique for their subsets. We discuss metabolism of NAFLD as well, because NAFLD will likely become a leading etiology of liver cancer in the coming years due to the obesity epidemic in the Western world. Furthermore, we outline the clinical implication of liver cancer metabolism and highlight the computation and systems biology approaches, such as genome-wide metabolic models, as a valuable tool allowing us to identify therapeutic targets and develop personalized treatments for liver cancer patients.
INTRODUCTION
Uncontrolled cell proliferation and activation of invasion and metastasis pathways are 2 hallmarks of cancer, and they both require ATP as a main source of energy along with various biomaterials for high biomass synthesis.[1–3] Due to the desmoplastic stroma, defective tumor vasculature, and rapid cell proliferation, cancer cells often encounter hypoxic and hypo-nutrient conditions, and they must make adaptive bioenergetic changes to meet high energy demands or create a favorable microenvironment for their growth. This process is termed “metabolic reprogramming,” which results in enhanced catabolic metabolism (energy production by the breakdown of macromolecules) and anabolic metabolism (synthesis of macromolecules from small metabolic intermediates using energy) in cancerous tissues compared with normal tissues.[4,5]
In a nonmalignant cell, ATPs are mainly generated by the breakdown of energy inputs, such as glucose, fatty acids (FAs), and amino acids, through multiple biochemical processes like glycolysis, the tricarboxylic acid (TCA) cycle, oxidative phosphorylation (OXPHOS), beta-oxidation, amino acid catabolism, and so on (cell A, Figure 1). These processes constitute cellular respiration events that occur in the cytosol or mitochondria where glucose, FAs, and proteins are converted into energy stored in the form of ATPs or broken down into bio-precursors for macromolecule synthesis. Among the ATP-generating pathways, OXPHOS in mitochondria is the most efficient mechanism. However, cancer cells tend to utilize glycolytic pathways and generate lactate in the presence of sufficient oxygen, which is known as “the Warburg effect.”[6–8] Although the Warburg effect was observed 100 years ago, the interest in cancer metabolism has been renewed and tremendous progress has been made since the last 20 years.
FIGURE 1.
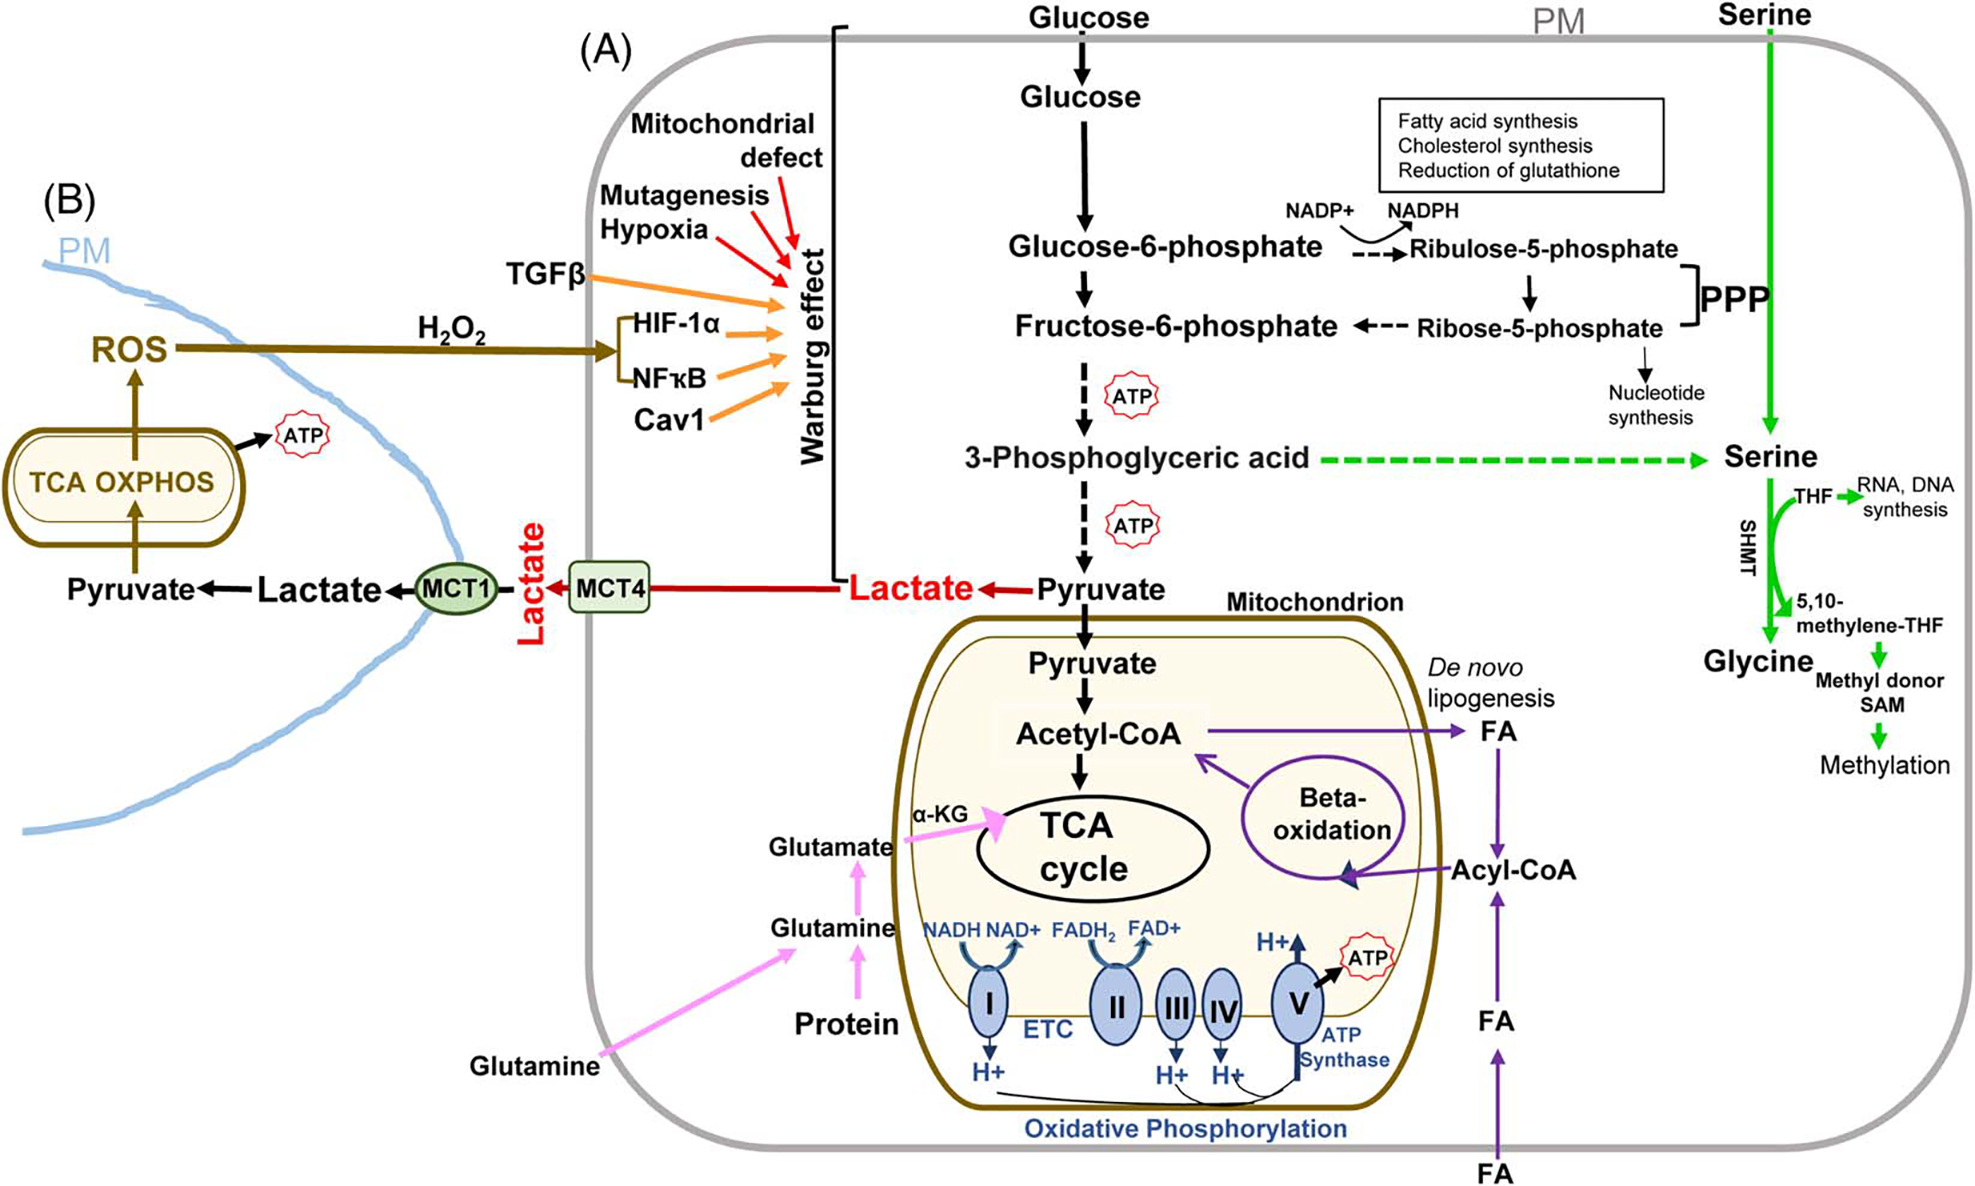
Major metabolic pathways and alterations in cancer. Upon entering a cell, glucose undergo glycolysis to form pyruvate. In the absence of oxygen, pyruvate engages in fermentation to form lactate (cell A, red). If the cell has a sufficient oxygen supply, pyruvate is converted into acetyl-CoA in the mitochondria where the TCA cycle and OXPHOS occur. The TCA cycle plays a central role in the breakdown of organic molecules and in generation of NADH and FADH2 for OXPHOS, a process that produces the most amount of ATP from the transfer of electrons through the ETC (cell A, blue). Through β-oxidation, FAs are broken down to form acetyl-CoA to enter the TCA cycle (cell A, purple lines). FAs are either imported from the extracellular space or by de novo lipogenesis (cell A, purple lines). Amino acids can enter different pathways of cellular respiration. For example, glutamine is converted to α-KG to refills the TCA cycle (cell A, pink lines). PPP is a branch of the glycolysis that forms ribulose-5-phosphate, NADPH, and ribose-5-phosphate used for synthesis of cholesterol, FAs, nucleotides, as well as for reduction of glutathione. The serine synthesis pathway is another branch of the glycolysis pathway (cell A, green lines). SHMT converts serine to glycine and the metabolites THF and 5,10-methylene THF are used for DNA and RNA synthesis or converted into a methyl donor S-adenosyl methionine (SAM). Mitochondrial defects, oncogenic mutations and signals, or hypoxia lead to the Warburg effect in cancer cells (cell A, red lines). TGFβ is in the extracellular space and ROS can be released from a neighboring cell that engages in mitochondrial metabolism (cell B, brown lines). TGFβ or ROS is able to reprogram a CAF or cancer cell to the Warburg effect by a HIF-1α-, NFҡB, or Cav1-dependent mechanism (cell A, orange lines). MCT4 at the plasma membrane is responsible for lactate export (cell A, green) and MCT1 is responsible for lactate uptake (cell B, green). A dashed line indicates multiple steps in between. Acetyl-CoA indicates acetyl coenzyme A; α-KG: α-ketoglutarate; CAF, cancer-associated fibroblast; Cav1, caveolin-1; ETC, electron transport chain; FA, fatty acid; FADH2, reduced flavin adenine dinucleotide; FAD, flavin adenine dinucleotide; HIF-1α, hypoxia-induced factor 1 alpha; OXPHOS, oxidative phosphorylation; MCT1, monocarboxylate transporter 1; MCT4, monocarboxylate transporter 4; PM, plasma membrane; PPP: the pentose phosphate pathway; ROS, reactive oxygen species; SAM, S-adenosyl methionine; SHMT, serine hydroxylmethyltransferase; TCA: tricarboxylic acid; THF, tetrahydrofolate; 5,10-methylene THF, 5,10-methylene tetrahydrofolate; I: NADH-coenzyme Q reductase; II: succinate coenzyme Q reductase; III: coenzyme Q cytochrome c reductase; IV: cytochrome c oxidase; V: ATP synthase.;
We now know that cancer consists of metabolically heterogeneous cells. For example, cancer stem-like cells (CSCs) possess a unique metabolic feature responsible for developing resistance to anti-cancer therapies.[9] Stromal cells within cancer, such as cancer-associated fibroblasts (CAFs), neurons, vascular endothelial cells, and immune cells also undergo metabolic reprogramming in response to the cues in the tumor microenvironment.[10,11] To support maximal tumor growth, cancer and stromal cells, or metabolically heterogeneous cancer cells engage in crosstalk by transferring their metabolites including lactate between each other. This phenomenon is termed as “metabolic coupling” or “metabolic symbiosis”[9,11] (Figure 1). In addition, lactate released by cancer cells leads to an acidic microenvironment that, in turn, inhibits proliferation of the immune cells, causes apoptosis of the tumor lytic immune cells, and polarizes the macrophages towards a type 2 subpopulation favoring growth, invasion and migration of cancer cells.[12–14] Thus, metabolic reprogramming contributes significantly to the immune evasion of cancer. It also allows cancer cells to adapt to the changing environment and survive unfavorable conditions so that the resistance develops against anti-cancer therapy.[9]
Primary liver cancer consists of 2 major types, HCC and cholangiocarcinoma (CCA), with HCC accounting for 75%–85% and CCA for 10%–15% of malignancies in the liver.[15,16] Although HCC and CCA share common risk factors such as hepatitis viral infection, alcohol abuse, and exposure to environmental toxins, they are 2 distinct types of cancer with high intertumoral heterogeneity in terms of mutational landscapes, histological representations, and transcriptomes.[16–19] Although the Warburg effect is detected in both HCC and CCA tumors,[15,20–22] liver cancer subsets possess unique metabolic features, and their metabolic heterogeneity contributes to the development of drug resistance and treatment failure of patients. The recent exploitation of computation and systems biology approaches, such as genome-wide metabolic models (GEMs) reconstructed through integrating genomics, transcriptomics, epigenomics, proteomics, and metabolomics for individual liver cancer, may help us better understand cancer metabolism, speed up drug development, and create personalized treatment for liver cancer patients.[15] In this review, we describe the major metabolic pathways in mammalian cells for maintaining physiological functions and summarize metabolic alterations commonly detected across various cancer types. We also review metabolic features specific for HCC or CCA subsets, followed by a discussion of their clinical implications. Since metabolic reprogramming in the immune cells is an important and very hot topic that has been reviewed elsewhere,[23–26] it is only briefly mentioned in this review. NAFLD has been predicted as a leading etiology for liver cancer in the future due to a rising global obesity rate. Therefore, we discuss its metabolism as well.
Overview of the major metabolic pathways in mammalian cells
Fermentation (anaerobic glycolysis), the TCA cycle, and OXPHOS
Glycolysis refers to a process where glucose is broken down into pyruvate by sequential enzymatic reactions, leading to generation of 2 ATPs (cell A, Figure 1). In the absence of oxygen, pyruvate enters fermentation where it is converted into lactic acid (cell A red, Figure 1).[27] When oxygen is present, pyruvate is converted into acetyl-CoA in the mitochondrion to enter the TCA cycle (cell A light yellow, Figure 1). The TCA cycle, also known as the Krebs or citric acid cycle, consists of a series of enzymatic reactions allowing energy to be released from acetyl-CoA oxidation.[27] Through the TCA cycle, 1 glucose molecule results in the generation of 6 CO2, 8 reduced NADH, 2 reduced flavin adenine dinucleotide (FADH2), and 2 ATPs. OXPHOS contains the electron transport chain (ETC) and chemiosmosis, which is an efficient ATP generation pathway later[28] (cell A blue, Figure 1). The ETC consists of protein complexes at the inner mitochondrial membrane, complex I, II, III, and IV.[29] When oxidized, NADH and FADH2, produced by the TCA cycle, release high energy electrons and the transmembrane complexes use this energy to create a proton gradient. Chemiosmosis occurs as the protons diffuse back into the matrix via the complex V, which is an ATP synthase, producing around 34 ATPs with water as a byproduct[30] (cell A blue, Figure 1).
Pentose phosphate pathway (PPP)
PPP is a branch of the glycolysis pathway, converting glucose-6-phosphate into ribulose-5-phosphate with NADPH produced (cell A Figure 1).[31,32] NADPH is used in FA, cholesterol synthesis, and the reduction of glutathione. Ribulose-5-phosphate is converted into ribose-5-phosphate used for DNA and RNA synthesis or fructose-6-phosphate that enters the glycolysis cascade (cell A Figure 1).[31,33]
Beta-oxidation
Glycerol heads and free FAs, generated by lipolysis, are in the blood. After entering a cell, the glycerol heads enter the glycolysis, and FAs enter β-oxidation for energy production (cell A purple lines, Figure 1). β-oxidation is a 4-step process that occurs in the mitochondrion and converts FAs into acetyl-CoA to feed the TCA cycle. Each β-oxidation cycle followed by the TCA cycle leads to generation of ~12–17 ATPs. FAs are either originated from dietary fats or by de novo lipogenesis from acetyl-CoA that is converted from pyruvate (cell A purple lines, Figure 1), and they are predominantly synthesized in the liver and adipose tissue. Cholesterol can be broken down to FAs for β-oxidation as well.[34]
Amino acid and 1 carbon metabolism
While amino acids are usually recycled to make proteins, some can be used for ATP production. For example, glutaminolysis is the process by which glutamine is converted to glutamate by glutaminase, which is then converted into α-ketoglutarate (α-KG) to enter the TCA cycle[35] (cell A pink lines, Figure 1). When glucose concentration is low, cells can shift from glycolysis to glutaminolysis. Serine can be synthesized by de novo from an intermediate of glycolysis or imported from the extracellular space (cell A green lines, Figure 1). Serine participates in the folate metabolism (one carbon metabolism) for the synthesis of 5,10-methylene tetrahydrofolate (5,10-methylene THF) required for DNA, RNA, and methionine synthesis (cell A green lines, Figure 1).[36] S-adenosyl methionine is a methyl donor in methylation occurred on DNA, RNA, or histones.[34]
Common metabolic alterations in cancer
The Warburg effect
The Warburg effect was first proposed by a German scientist Dr Otto Warburg in the 1920s when he observed that, even in the presence of sufficient oxygen, cancer cells used more glucose and produced more lactate than their surrounding normal cells, implying upregulation of fermentation in cancer cells[6–8] (cell A red, Figure 1). Although many studies have shown that tumorigenesis still requires the ETC and OXPHOS, an increase of aerobic glycolysis has been observed across various cancerous tissues, and the Warburg effect has remained the prevailing theory in academia for tumor metabolism.[37,38]
The Warburg effect can be explained by the following mechanisms (cell A red lines, Figure 1): (1) mitochondrial defects induced by DNA mutations. It is believed that the mitochondrial DNA in cancer cells has high mutation rates due to its weak repair capacity, the lack of the introns and protective histones, as well as the closeness to mitochondria-derived reactive oxygen spelvtcies (ROS).[39–41] (2) Hypoxia inhibits OXPHOS and stabilizes hypoxia-inducible factor 1 alpha (HIF-1α) which, in turn, upregulates glucose transporters 1 and 3 (Glut1 and Glut3), as well as glycolytic enzymes transcriptionally.[42] (3) Oncogenic signals such as those induced by RAS, Bcr-Abl, or PI3K/AKT make cancer cells reliant on glycolysis.[43–45] Tumor suppressor gene p53 is mutated or deleted in 50% of all human cancers, and its key metabolic function is to suppress gene transcription of Glut1 and Glut4. Therefore, its loss of function enhances glucose uptake by cancer cells.[46,47] (4) The increase in expression of hexokinase II (HK2) for glycolysis and transketolase-like 1 for the PPP, or the loss of fumarate hydratase and succinate dehydrogenase (SDH) in the TCA cycle, may lead to the Warburg effect in cancer.[48–52]
PPP
Enhanced PPP provides abundant pentose phosphate and NADPH, which are required for nucleic acid and FA synthesis.[53] The upregulation of TP53-induced glycolysis and apoptosis regulator directs glycolytic metabolites to enter the PPP in cooperation with HK2.[46] Glucose-6-phosphate dehydrogenase (G6PDH) in the PPP is post-translationally upregulated by an oncogenic protein, such as ATM, PI3K/AKT, RAS, or SRC; G6PDH gene transcription is elevated by mammalian target of rapamycin complex 1 (mTORC1)-mediated signaling; other key enzymes in the PPP such as 6-phosphogluconate dehydrogenase, transketolase, and transaldolase, are upregulated by K-RAS, B-RAF, MYC, or the hyperactivation of the PI3K/AKT signaling in cancer cells.[31]
Mitochondrial OXPHOS
Although the Warburg effect has been widely detected and accepted as a common feature of cancer, increased mitochondrial activity has been found in subgroups of human cancers.[54] CSCs are known to rely on mitochondrial metabolism so cancer cells that survived a targeted therapy against a cancer driver mutation, such as KRAS(G12D) or BRAF(V600E), depended on OXPHOS rather than glycolysis.[55,56] Similarly, a prolonged exposure of HCC cells to chemotherapeutic agents led to elevated mitochondrial respiration, and the drug resistance developed in those cells was abrogated by targeting mitochondrial respiration.[57]
Glutaminolysis and pyruvate carboxylation
Glutaminolysis and pyruvate carboxylation are activated in cancer cells so that the TCA cycle is refilled by intermediary metabolites.[2] For example, glutaminolysis produces α-KG that enters the TCA cycle and OXPHOS, and ultimately, generates more ATPs and biosynthetic precursors to support cancer growth. Pyruvate carboxylase adds bicarbonate to pyruvate and converts it to oxaloacetate, which is another TCA intermediate. Glutaminolysis enables reduction of NADP+ to NADPH required for lipid and nucleotide metabolism and cellular redox maintenance.[58] The mTOR signaling or c-MYC-mediate signaling regulates glutamine uptake and catabolism, making certain cancer addicted to glutamine.[59–62]
Metabolic symbiosis in cancer
CAFs are the most abundant cancer stromal cells, and TGFβ is a potent cytokine leading to myofibroblast activation.[63,64] When human fibroblasts were manipulated to have the activation of TGFβ signaling, their mitochondrial density and the level of OXPHOS complexes were reduced. In contrast, autophagy markers were increased, suggesting mitochondrial damage in the TGFβ-stimulated fibroblasts.[65] Consequently, glycolysis and lactate production were induced in those cells[65] (cell A an orange line, Figure 1). ROS, such as H2O2, induces glycolytic switch by activating NFҡB and HIF-1α in CAFs,[66] and downregulation of caveolin-1 (Cav1) is another mechanism for the Warburg effect in CAFs[65,66] (cell A orange lines, Figure 1).
The “Reverse Warburg Effect” describes that in a 2-part model: CAFs undergo glycolysis and their glycolytic metabolites, such as lactate, pyruvate, and ketone body, are transferred to cancer cells to engage in mitochondrial metabolism[11] (cell B Figure 1). This lactate shuttle occurs in metabolically heterogeneous cancer cells as well. While a hypoxic cancer cell engages in glycolysis and the release of the metabolites (cell A Figure 1), a neighboring well-oxygenated cells or CSC uptakes the metabolites for OXPHOS (cell B Figure 1). The monocarboxylate transporters (MCTs) are a family of proton-linked membrane transporters responsible for the metabolite transfer. MCT4 expressed in CAFs or cancer cells is used for the release of the metabolites, whereas MCT1 in other cancer cell subsets is used for uptake of lactate[11,67] (cell A and cell B Figure 1).
Metabolic reprogramming in primary liver cancers and associated mechanisms
HCC and CCA are 2 different cancers with high intertumoral heterogeneity
HCC and CCA are 2 types of primary liver cancer derived from different cell lineages (hepatocellular and biliary differentiation). Although HBV and HCV account for ~80% of HCC cases worldwide,[68] the link of metabolic syndrome and/or the presence of NAFLD to HCC and CCA deserves great attention due to the growing global obesity epidemic. NASH is an aggressive form of NAFLD and currently the most common cause of liver cirrhosis in the Western world. Figure 2 shows a 71-year-old female presented with liver mass, and her liver needle core biopsy confirmed mixed steatohepatitic HCC and mucin-producing CCA on the background of NASH with cirrhosis. HCC tumors derived from NASH often contain cancer cells with various differentiation (Figure 3).
FIGURE 2.
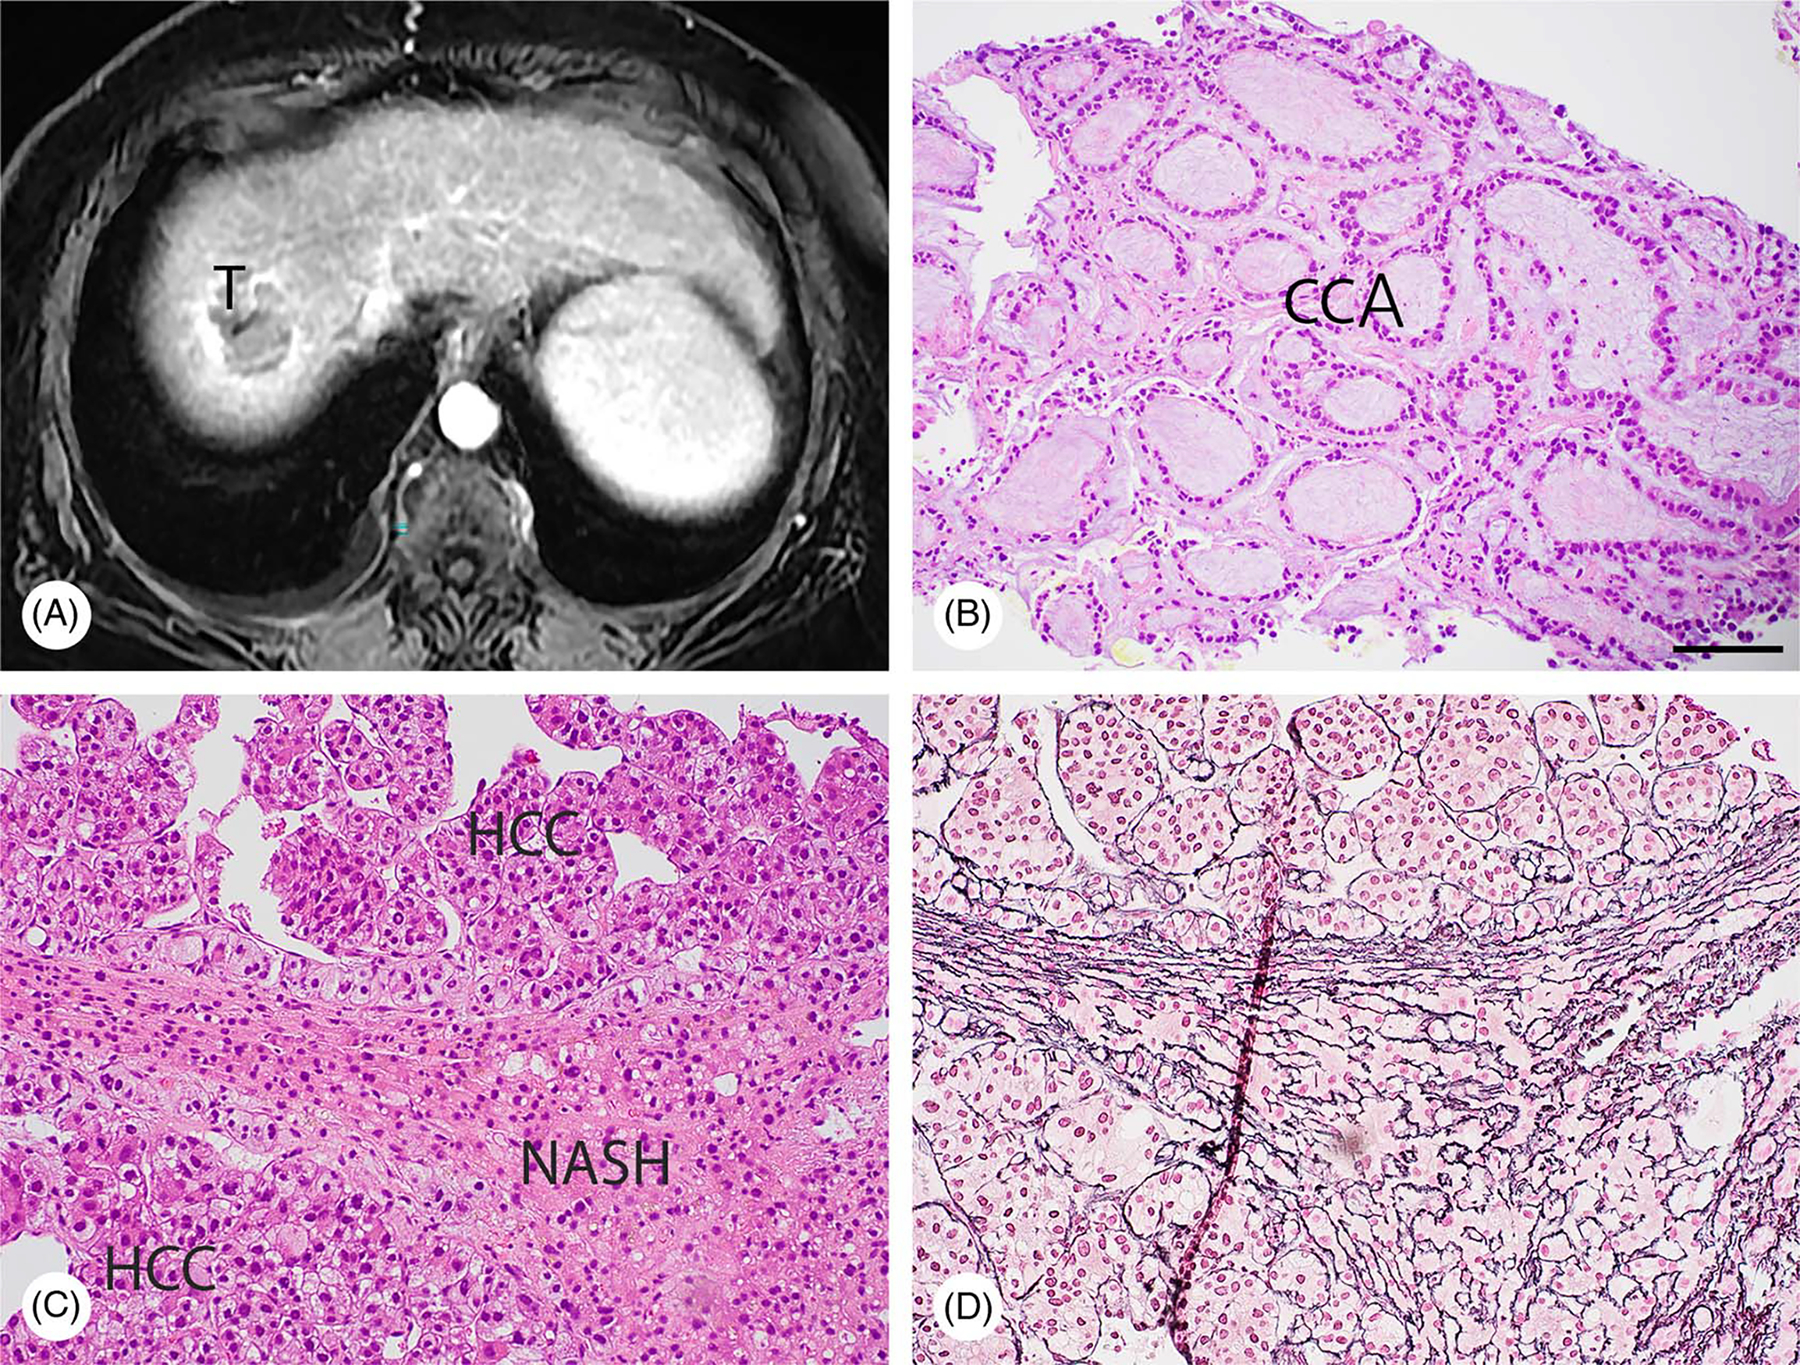
NASH leads to both HCC and CCA in a 71-year-old female patient. (A) MRI (axial, water Ph4/GAD) revealing a 4.7 cm liver segment VIII mass (T) not specific for HCC. (B and C) Needle core biopsies were subjected to H&E staining, demonstrating that mucin-producing CCA (B) and HCC (C) co-existed on the background of NASH. (D) The result of reticulin staining with an adjacent section is shown. Bar, 50 μm.
FIGURE 3.
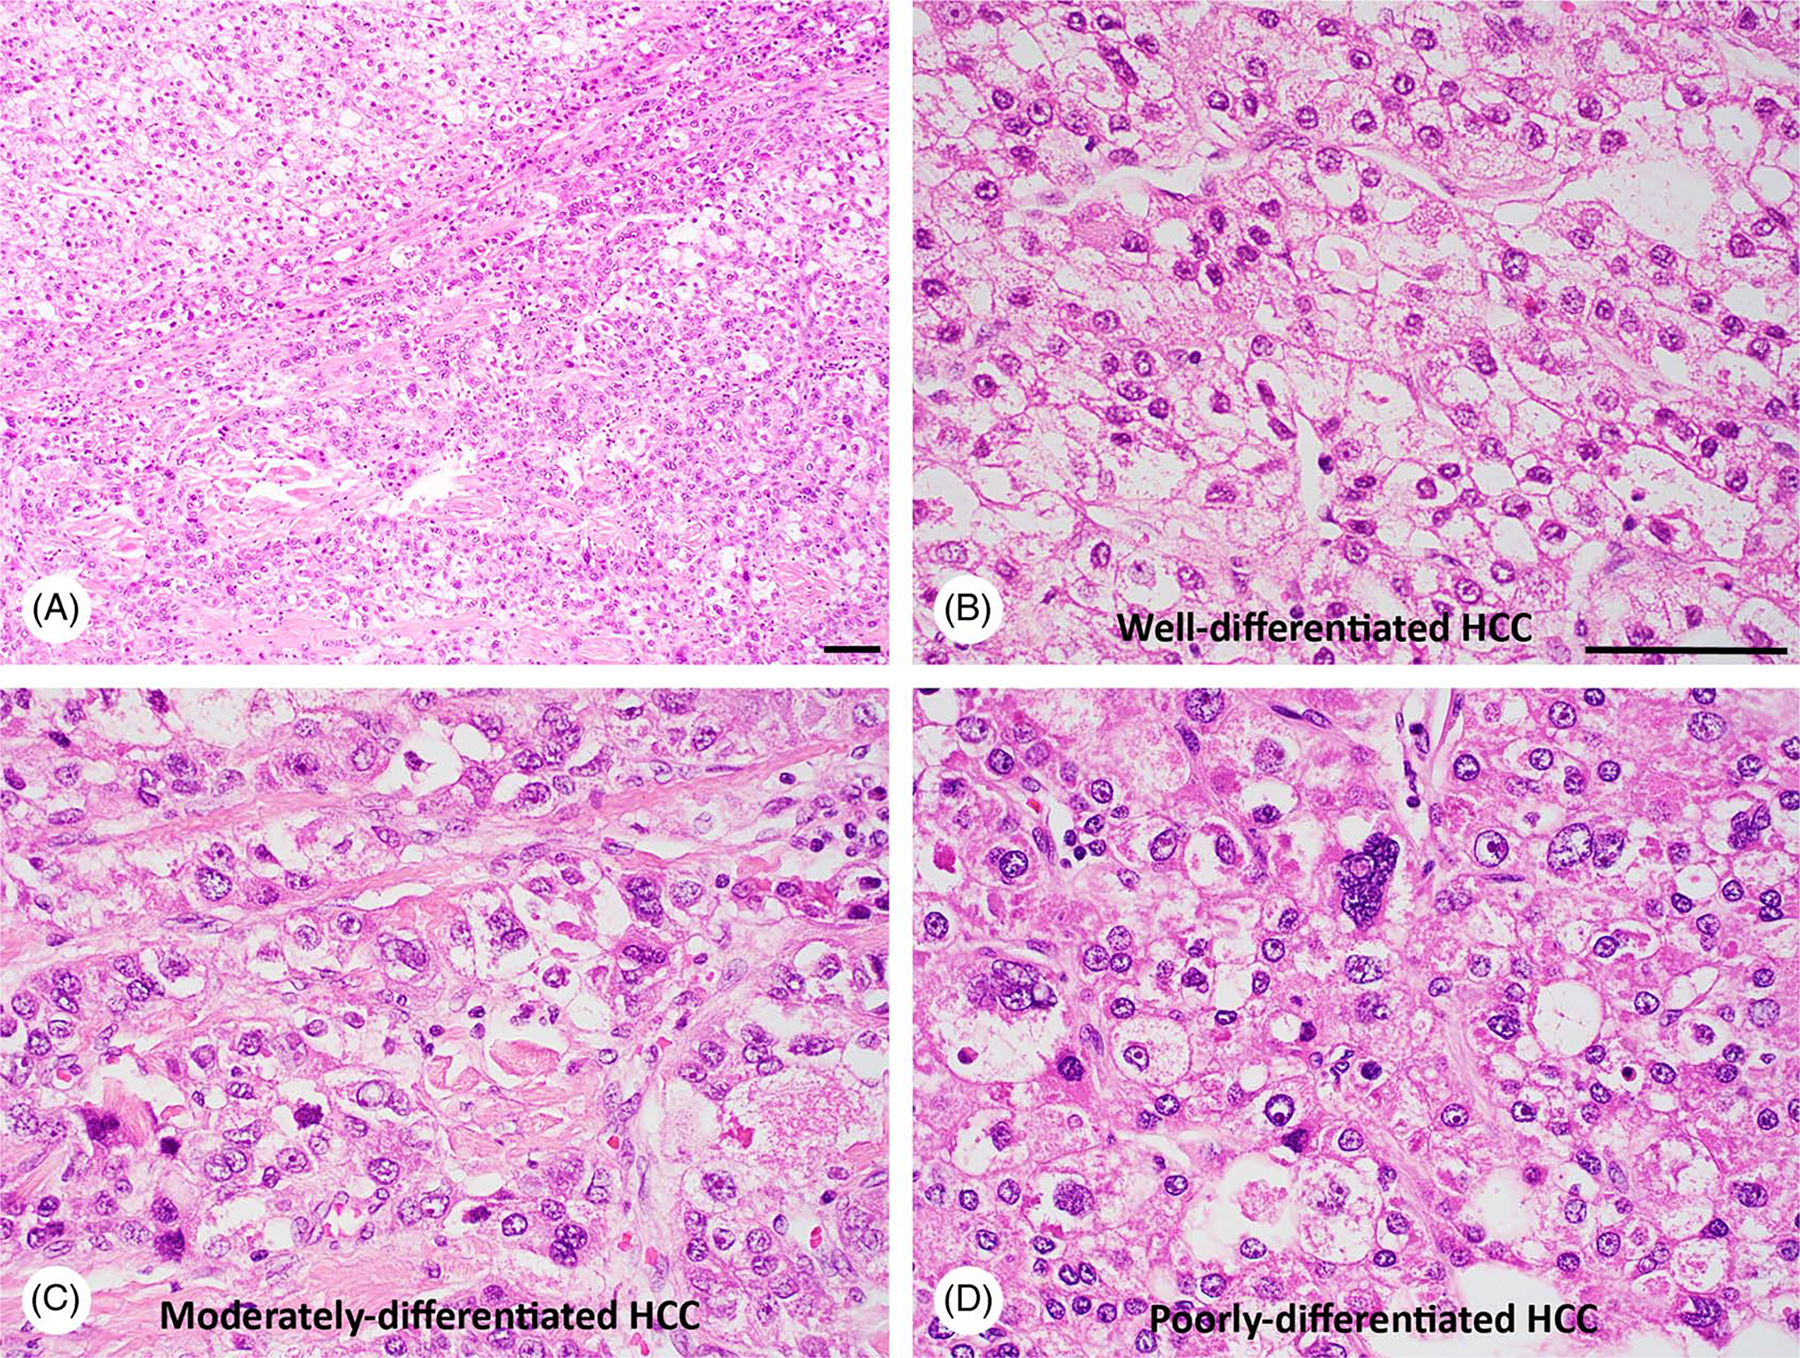
Intratumoral heterogeneity in HCC of a 68-year-old male NASH patient. The liver tumor mass was subjected to H&E staining, revealing well-differentiated HCC (A and B), moderately-differentiated HCC (A and C), as well as poorly-differentiated HCC (A and D). Bar, 50 μm.
A total of 161 putative driver genes in a HCC cohort were identified by exome sequencing, which potentially affect 11 pathways, such as the activation of telomerase expression (60%), WNT/β-catenin (54%), PI3K/AKT/mTOR (51%), TP53/cell cycle (49%), MAP kinase (43%), hepatic differentiation (34%), epigenetic regulation (32%), chromatin remodeling (28%), oxidative stress (12%), Il6/JAK/STAT (9%), and TGFβ (5%).[69] Alterations in CTNNB1, TERT, CDKN2A, SMARCA2, and HGF were linked to alcohol-related HCC, whereas TP53 mutations were detected in HBV-related HCC.[69] By a similar approach, 32 driver genes in a cohort of 260 CCA patients were identified with highest mutation frequency for TP53, KRAS, SMAD4, BAP1 and YEATS4, affecting oncogenic modules, such as kinase-RAS module (51.9%), TGFβ-SWI/SNF-MYC module (40.2%), P53 module (33.9%), cell cycle module (11.7%), cyclin E mutation (9%), and epigenetic module caused, in part, by IDH1/2 mutations (29.3%).[70] This study also revealed that FGFR1/2 and IDH1/2 mutations occurred exclusively in intrahepatic CCA, whereas mutations in EGFR family genes (EGFR, ERBB2, and ERBB3), as well as alterations in p53 and cell cycle modules occurred more frequently in gallbladder cancer.
The combined activation of oncogenes, including AKT, CTNNB1, and NRASG12V in a different inflammatory liver microenvironment such as one induced by carbon tetrachloride or 3,5-diethoxycarbonyl-1,4-dihydrocollidine, led to different liver cancer in mice, HCC, CCA, or mixed HCC-CCA.[71] Moreover, liver tumors induced by same oncogenes exhibited different transcriptomes, supporting that the hepatic microenvironment and inflammation contribute to liver cancer heterogeneity as well.[71] In a patient study, intratumoral heterogeneity was indeed detected in 87% of HCC cases.[72] In agreement, metabolic reprogramming in HCC or CCA tumors is remarkably heterogeneous. Below, we discuss common metabolic alterations in HCC or CCA tumors as well as metabolic features unique for HCC subsets or CCA subsets.
The Warburg effect, PPP, and hexosamine biosynthetic pathway (HBP) in HCC
A meta-analysis involving 521 human HCC and 2761 metabolic genes led to the identification of 284 metabolic genes upregulated and 350 genes downregulated in the HCC cohort.[73] While the downregulated genes were mostly involved in xenobiotic, FA, and amino acid metabolism, the upregulated genes were involved in glycolysis, PPP, nucleotide biosynthesis, TCA, OXPHOS, proton transport, membrane lipid, and glycan metabolism.[73] Nontargeted metabolic profiling was performed with another cohort of 50 patient HCC, which revealed the principal metabolic alterations included the upregulation of glycolysis, gluconeogenesis, and β-oxidation and downregulation of the TCA cycle and Δ−12 desaturase.[74] These 2 studies supported the Warburg effect as one of the top metabolic alterations in certain HCC tumors.
TP53 >mutations and the activation of the PI3K/AKT/mTOR pathway occur frequently in HCC,[69] and they are known to promote the Warburg effect by upregulating Glut1 and Glut4 and other glycolytic enzymes.[47,75,76] Indeed, elevated Glut1 was detected in HCC tumors with its high expression correlated with poor prognosis of HCC patients[77–79] (Figure 4). HK2 converts glucose to glucose-6-phosphate (G6P) during the first step of glycolysis. Elevated HK2 expression was detected in HCC of patients,[80–82] and its high expression was associated with poor overall survival of patients as well.[82] Consistent with HK2 data, increase of G6P in patient HCC was revealed by metabolomics[74] (Figure 4).
FIGURE 4.
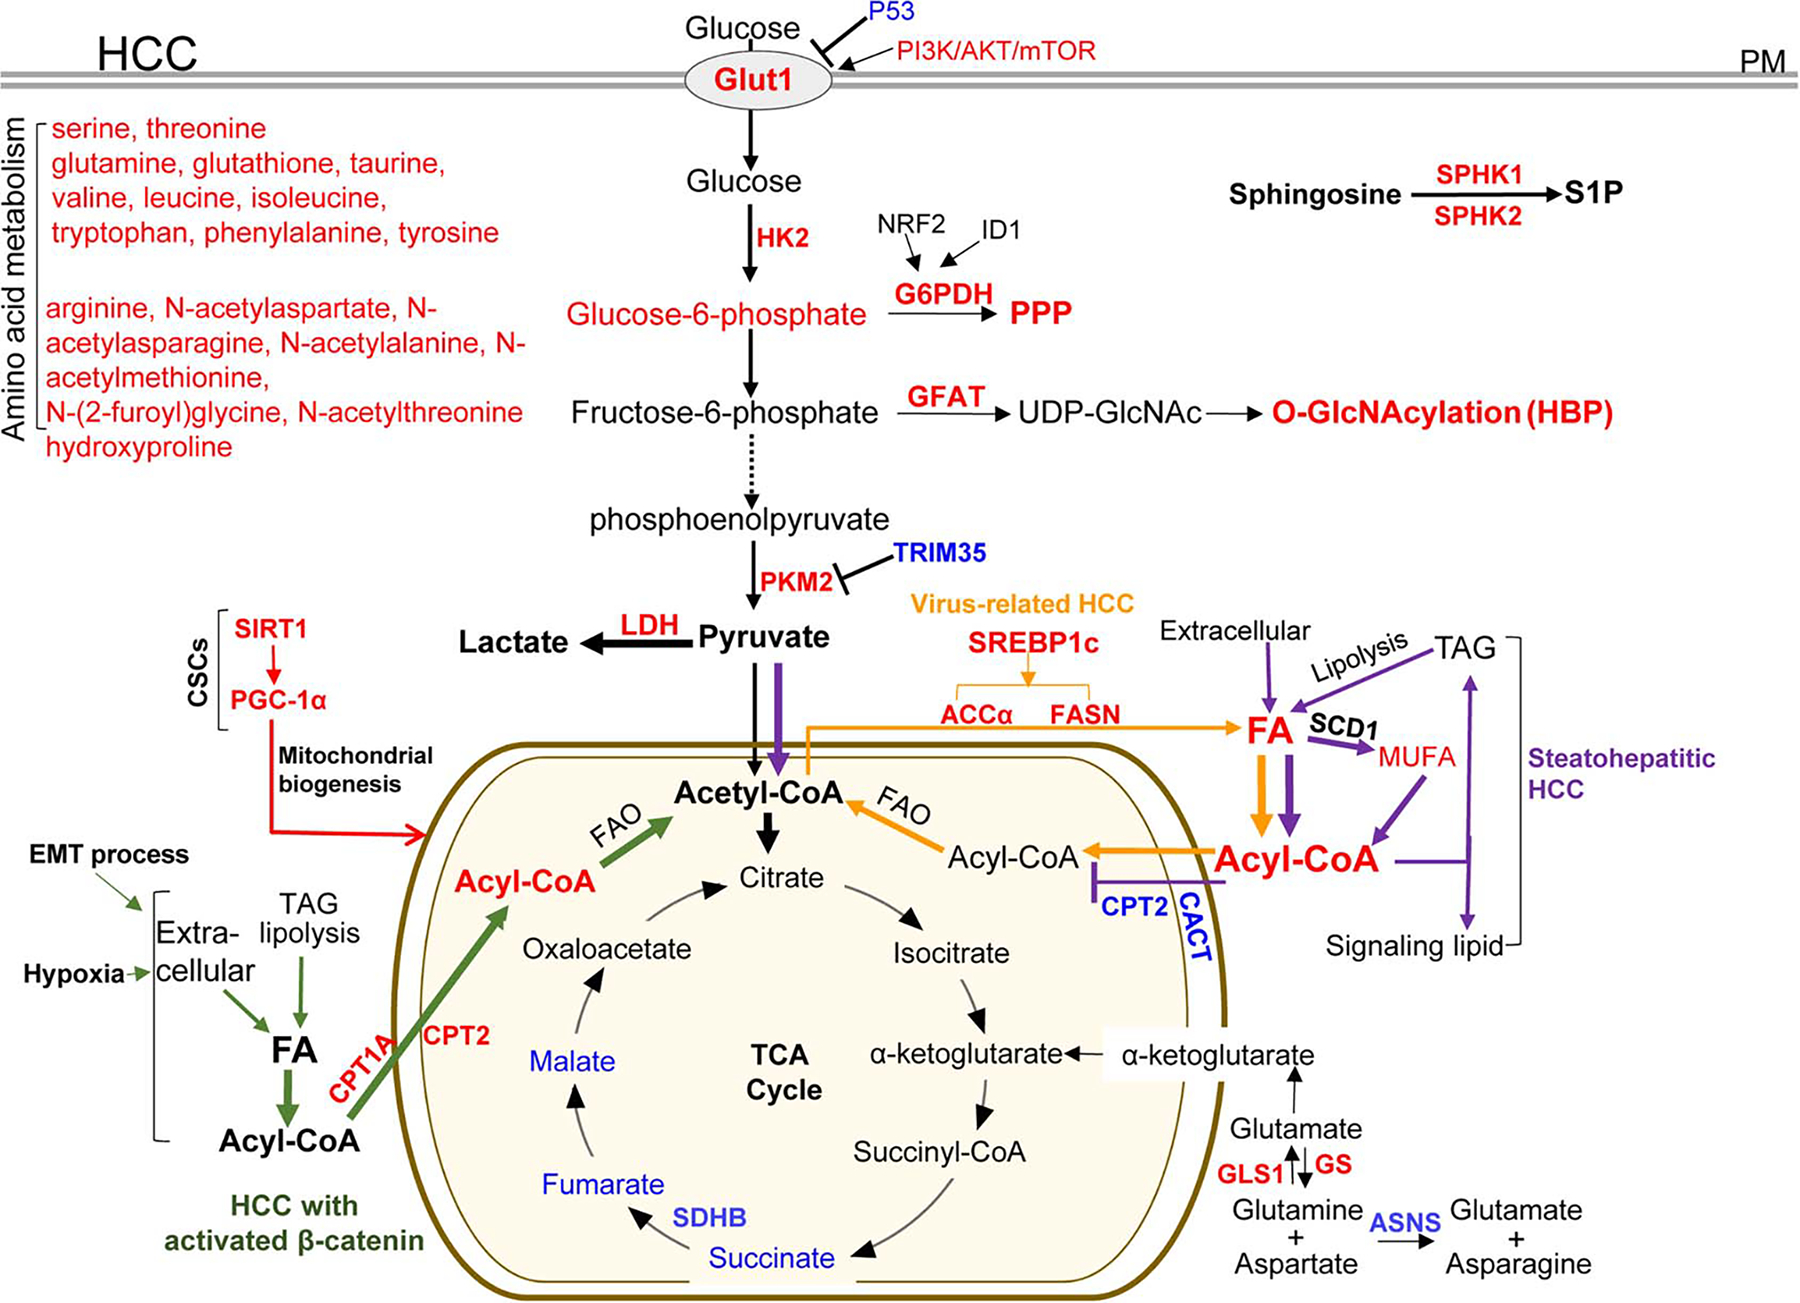
Metabolic enzymes and pathways deregulated in HCC tumors or HCC subsets. Red: the expression level of the enzymes or metabolites is upregulated in HCC tumors compared with nontumoral tissues; blue: the expression level is downregulated. Green lines: a HCC subset with activated β-catenin exclusively uses FA catabolism; purple lines: a steatohepatitic HCC subset shuts down FA catabolism and pyruvate is re-routed into the TCA cycle; orange lines: enhanced lipogenesis in virus-related HCC; and red lines: metabolic changes in CSC cell subset. Acetyl-CoA indicates acetyl coenzyme A; ACCα, acetyl-CoA carboxylase alpha; ASNS, asparagine synthetase; CACT, carnitine acylcarnitine translocase; CPT1A, carnitine palmitoyltransferase 1A; CPT2, carnitine palmitoyltransferase 2; CSC: cancer stem-cell like; EMT, epithelial-to-mesenchymal transition; FAO, fatty acid oxidation; FASN, fatty acid synthase; HK2, hexokinase II; Glut1, glucose transporter 1; GLS1, glutaminase kidney isoform, mitochondrial; GS, glutamine synthetase; G6PDH, glucose-6-phosphate dehydrogenase; GFAT, glutamine:fructose-6-phosphate amidotransferase; HBP, hexosamine biosynthetic pathway; ID1, inhibitor of differentiation 1; LDH, lactic dehydrogenase; MUFA, monounsaturated fatty acids; mTOR, the mammalian target of rapamycin; NRF2, nuclear factor erythroid 2-related factor; O-GlcNAcylation, O-linked β-N-acetylglucosamine; PGC-1α, peroxisome proliferator-activated receptor-gamma coactivator-1alpha; PKM2, pyruvate kinase M; PM, plasma membrane; PPP, the pentose phosphate pathway; SCD1: stearoyl-CoA-desaturase 1; SDHB, succinate dehydrogenase subunit B; SREBP1c, sterol regulatory element-binding protein 1c; SPHK1/2: sphingosine kinase 1 and 2; S1P, sphingosine-1-phosphate;SIRT1, Sirtuin 1; TAG, triglyceride; TRIM35, tripartite motif-containing 35.
In 688 HCC tumors resected from 2000 and 2013, PKM2 overexpression was correlated with a high TNM stage and high level of vascular invasion[83] (Figure 4). Tripartite motif-containing 35 (TRIM35) blocks PKM2 phosphorylation, thereby, inhibiting the Warburg effect and the tumorigenesis of HCC.[84] Patients with HCC positive for PKM2 and negative for TRIM35 expression had shorter survival and recurrence time compared with patients negative for PKM2 and positive for TRIM35.[83] However, PKM2 loss in mice led to spontaneous HCC development, suggesting a complex role of PKM for HCC development.[85] Lactic dehydrogenase (LDH) converts pyruvate to lactate (Figure 4). In 200 HCC patients who received curative resection, a high preoperative LDH level in serum correlated with early HCC recurrence in patients.[86] In addition, a high serum LDH level was associated with poor survival of HCC patients after sorafenib treatment.[87]
G6PDH is the first rate-limiting enzyme in the PPP. qRT-PCR revealed that G6PD mRNA was increased in 30 patient HCC tumors compared with adjacent nontumorous liver tissues and that its level was higher in metastatic HCC than in nonmetastatic HCC[88] (Figure 4). In addition, its high level correlated with short survival in 127 HCC patients.[88] In a resistant-hepatocyte (RH) hepatocarcinogenesis rat model, the preneoplastic nodules displayed increased aerobic glycolytic activity, PPP activation, and decreased OXPHOS.[89] NRF2 silencing reduced G6PDH expression in RH tumorigenic cells and the amount of glucose diverted into the PPP.[89] Expression of inhibitor of differentiation 1 promoted G6PDH expression and PPP in HCC cells by a WNT/β-catenin/MYC pathway.[90]
HBP is another branch in the glycolysis cascade where fructose 6-phosphate is used for synthesis of uridine diphosphate N-acetylglucosamine (UDP-GlcNAc) by glutamine:fructose-6-phosphate amidotransferase (GFAT) (Figure 4). UDP-GlcNAc is a sugar donor for O-linked β-N-acetylglucosamine (O-GlcNAcylation), a post-translational modification on serine and threonine residues of nucleocytoplasmic proteins catalyzed by O-GlcNAc transferase (OGT). The global O-GlcNAcylation level was elevated in HCC, which associated with HCC recurrence in patients following liver transplantation[91] (Figure 4). In vitro, elevated glycolysis, GFAT expression, and protein O-GlcNAcylation promoted migration and metastatic potential of HCC cells.[91,92]
Because of the Warburg effect, positron emission tomography (PET) with [18F] 2-fluoro-2-deoxy-D-glucose (FDG) has been used to detect tumors in the liver of patients. The detection rate of FDG-PET for HCC, however, is only 50%–55% compare with 98% for colorectal (CRC) liver metastasis.[93] The difference is possibly caused by differential expression of proteins in glycolysis.[93] Izuishi et al.,[93] found that the mRNA levels of Glut1, HK1, and HK2 were higher in CRC liver metastases than in HCC tumors, and that of glucose-6-phosphatase (G6Pase), converting G6P back to glucose to be released from cells, was lower in CRC liver metastasis than in HCC. Immunostaining confirmed that Glut1 protein level was higher in CRC liver metastasis and poorly differentiated HCC than in moderated differentiated HCC.[93] When FDG PET and CT were applied for restaging 33 HCC lesions in 24 patients following radiofrequency ablation, the detection rate of FDG PET for HCC recurrence was 92%, higher than that of CT (75%).[94] Thus, FDG PET is a powerful imaging modality for HCC recurrence for patients after radiofrequency ablation.
The Warburg effect, PPP, and HBP in CCA
Due to the Warburg effect, FDG-PET has been used in clinics for CCA diagnosis, staging, detecting tumor recurrence, making a treatment plan, and for patient prognosis.[95,96] FDG uptake by CCA correlated with Glut1 expression and high Glut1 expression level correlated with histological grading, HIF-1α expression, larger tumor size, poor differentiation, lymphatic invasion and metastasis of CCA,[97,98] as well as poor survival of CCA patients[99] (Figure 5). In 82 CCA induced by liver fluke, elevated HK2 expression was detected in hyperplasia (80%), dysplasia (80%), and CCA (82%) although it had no correlation with any clinical feature and survival of the patients (Figure 5). Elevated HK2 expression was also detected in 40% of hamster CCA induced by N-nitrosodimethylamine + liver fluke.[100] Regarding PKM2, its expression was higher in the plasma and bile of CCA patients, with an association with CCA cell proliferation, migration, angiogenesis, and poor survival of the patients[101,102] (Figure 5). In a study involving 114 advanced CCA received first-line treatment (gemcitabine and cisplatin), a high serum LDH was associated with poor survival of the CCA patients.[103] Moreover, 38 patients with LDH level decreased as the result of treatment had improved survival, supporting serum LDH as a prognostic marker for CCA patients received first-line chemotherapy.[103]
FIGURE 5.
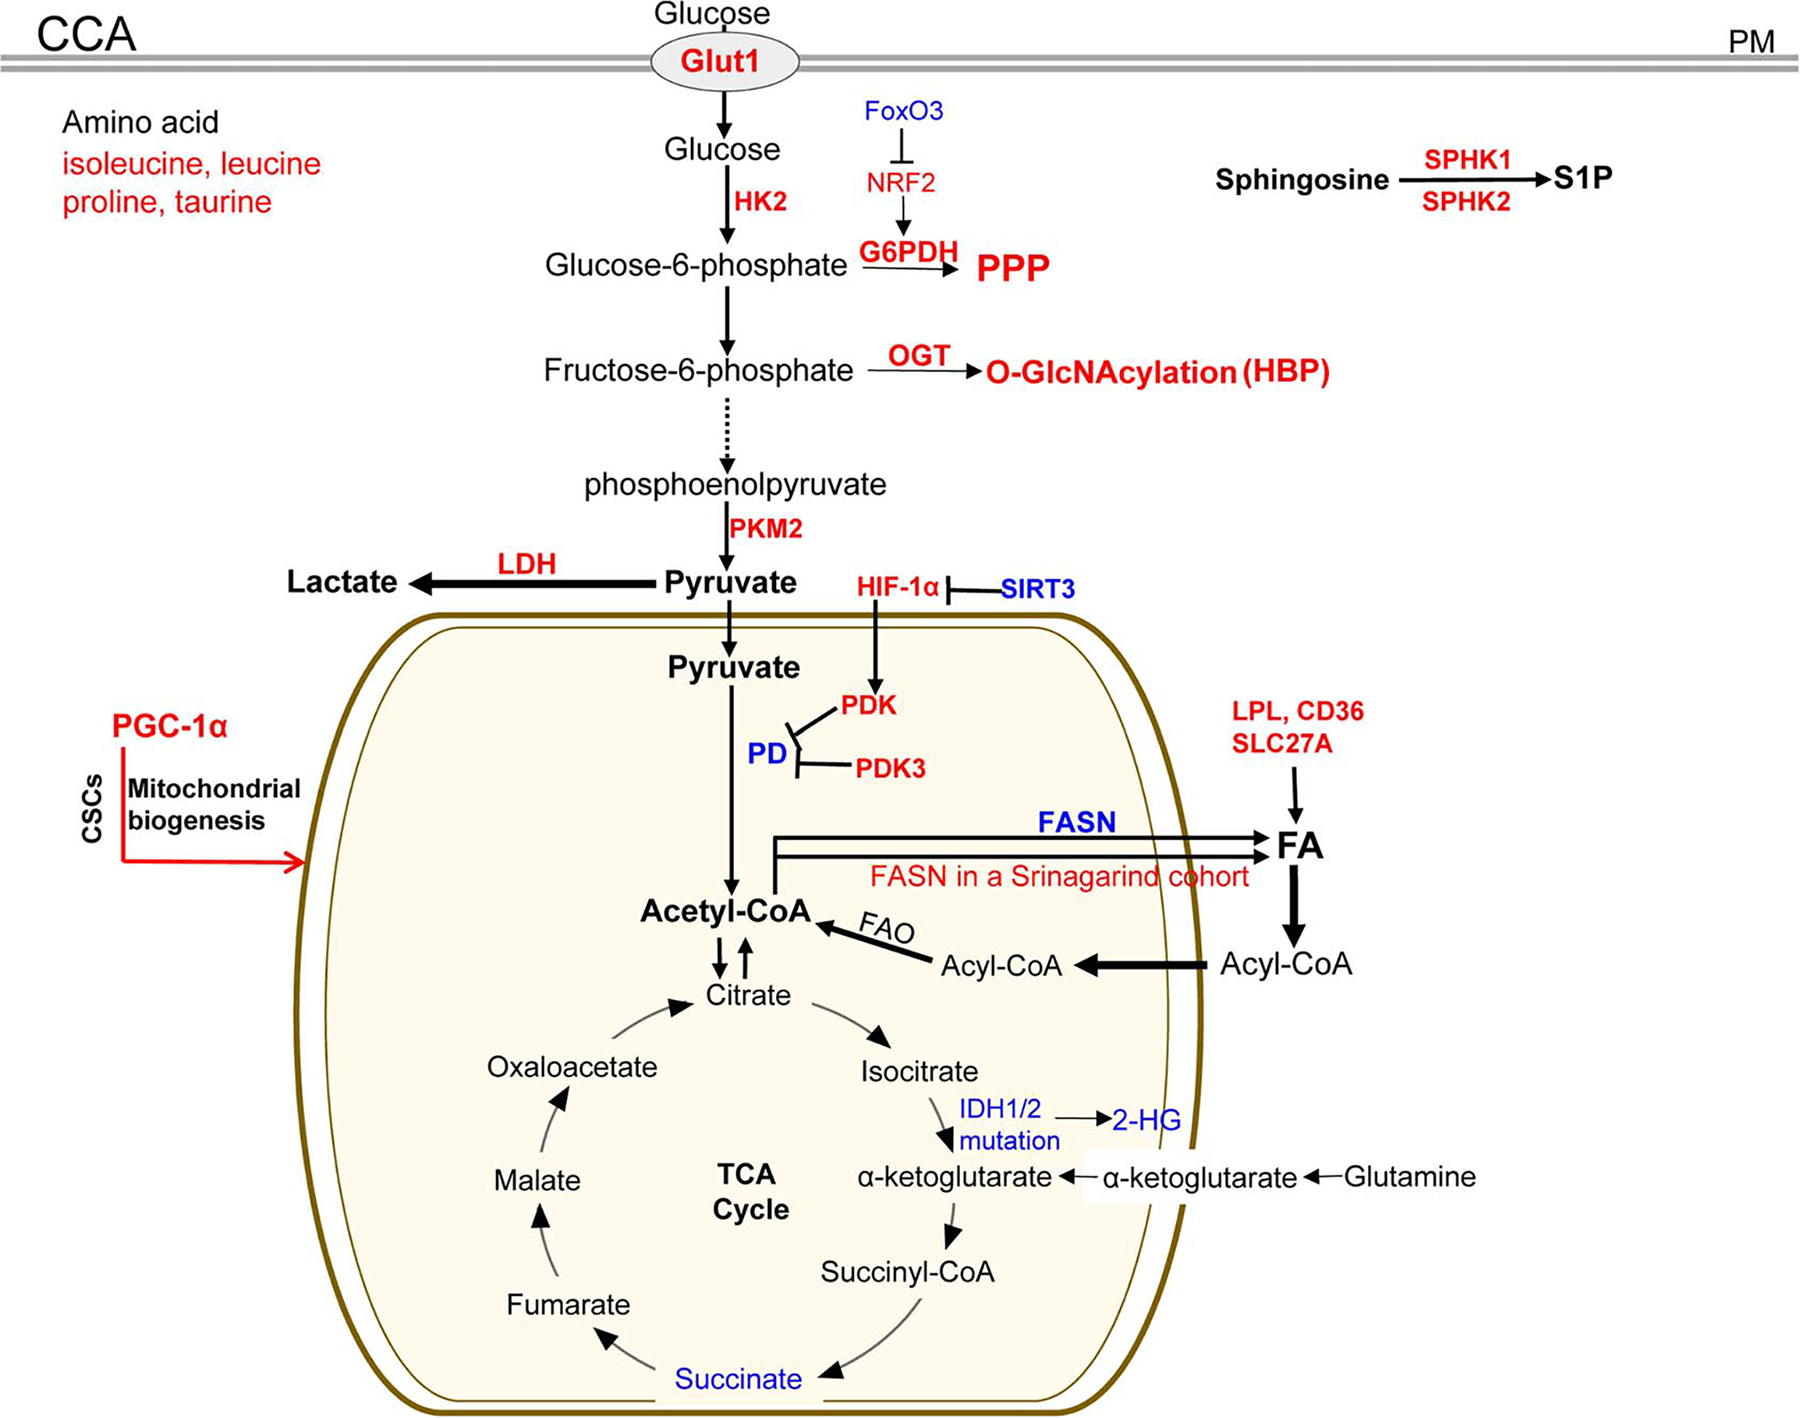
Metabolic enzymes and pathways deregulated in CCA tumors or CCA subsets. Red: the expression level of the enzymes or metabolites is upregulated in CCA tumors compared with nontumoral tissues; blue: the expression level is downregulated. CCA indicates cholangiocarcinoma; CD36, platelet glycoprotein 4; CSC, cancer stem-cell like; FAO, fatty acid oxidation; FoxO3, forkhead box protein O3; Glut1, glucose transporter 1; G6PDH, glucose-6-phosphate dehydrogenase; HIF-1α, hypoxia-induced factor 1 alpha; HK2, hexokinase II; HBP, hexosamine biosynthetic pathway; IDH, isocitrate dehydrogenase; NRF2, nuclear factor erythroid 2-related factor; LDH: lactic dehydrogenase; LPL, lipoprotein lipase; OGT, UDP-N-acetylglucosamine peptide N-acetylglucosaminyltransferase; O-GlcNAcylation, O-linked β-N-acetylglucosamine; PD, pyruvate dehydrogenase; PDK, pyruvate dehydrogenase kinase; PKM2, pyruvate kinase M; PM, plasma membrane; PPP, the pentose phosphate pathway; SIRT3, Sirtuin 3; PGC-1α: peroxisome proliferator-activated receptor-gamma coactivator-1alpha; SPHK1/2, sphingosine kinase 1 and 2; S1P, sphingosine-1-phosphate; SLC27A1, solute carrier family 27 member 1; 2-HG: D-2-hydroxyglutarate.
As mentioned above, NRF2 promotes G6PDH transcription to activate PPP. Elevated NRF2 and reduced FoxO3 mRNA were detected in 28 patient CCA tumors. FoxO3 deficiency potentiated CCA formation in nude mice and rendered CCA cisplatin resistance by activating NRF2[104] (Figure 5). QBC939 CCA cells are resistant to cisplatin. After cisplatin treatment, glucose uptake, lactate production, G6PDH activity, and the NADPH/NADP ratio were all higher in QBC939 cells than in HepG2 cells, indicating that a more efficient PPP in QBC939 cells conferred cisplatin resistance.[105] Activation of the HBP pathway was also detected in CCA tumors. Immunohistochemistry revealed that the level of O-GlcNAc modified proteins and OGT were higher in CCA than in normal bile ducts, and a high O-GlcNAcylation level was associated with non-papillary type CCA and poor survival of patient[106] (Figure 5). In vitro, an increase of glucose concentration in culture medium promoted global O-GlcNAcylation in CCA cells as well as O-GlcNAcylation of vimentin that, in turn, enhanced migration and metastasis of CCA cells.[92]
Changes in the TCA cycle of HCC
In 30 HCC tumors of patients, fumarate and malate were reduced and they were among 253 metabolites that significantly discriminated HCC tissues from paired non-tumor tissues[107] (Figure 4). Downregulation of fumarate, malate, and succinate also occurred in another cohort of HCC patients.[74] Fumarate hydratase and SDH that converts succinate to fumarate, are tumor suppressors,[108] and their function loss results in abnormal levels of succinate or fumarate that, in turn, stabilize HIF-1α for the Warburg effect and angiogenesis. Downregulation of SDH subunit B (SDHB) was detected in a cohort of HCC tumors, which correlated with an advanced tumor stage and poor survival rate of patient[109] (Figure 4). In vitro, silencing of SDHB led to glycolysis and enhanced proliferation and motility of HCC cells.[109]
Changes in the TCA cycle of CCA
Succinate and glycerol 3-phosphate were reduced in 10 patient CCA tumors compared with nontumor tissues, suggesting the Warburg effect and upregulation of FA catabolism in certain CCA tumors[110] (Figure 5). In the mitochondria, pyruvate dehydrogenase (PD) converts pyruvate to acetyl-CoA that enters the TCA cycle. So the TCA cycle can be blocked and aerobic glycolysis is promoted once PD is inactivated by pyruvate dehydrogenase kinase (PDK) (Figure 5). In a cohort of CCA tumors, PDK3 expression level was 27 folds higher in CCA than in benign tissues, and the high serum PDK3 level correlated with a shorter survival of the patients.[111] HIF-1α is stabilized by acetylation and degraded by Sirtuin-3 deacetylase (SIRT3)-mediated deacetylation. Reduced SIRT3 and elevated HIF-1α expression were detected in a cohort of CCA[112] (Figure 5). Mechanistically, HIF-1α upregulated PDK expression transcriptionally so a HIF-1α/PDK signaling pathway suppressed the TCA cycle and promoted the Warburg effect in CCA cells[112] (Figure 5).
About 10%–20% of CCA tumors carry mutations on isocitrate dehydrogenase genes (IDH1 and IDH2) (Figure 5).[15,70,113–116] Wildtype IDH1 and IDH2 catalyze the formation of α-KG and the mutants generate (R)-2-hydroxyglutarate (2-HG), which is an oncometabolite. Due to the structural similarity, 2-HG acted as a competitive inhibitor for α-KG-dependent histone demethylases so hypermethylation for more than 2,000 genes was detected in CCA subsets with IDH1 or IDH2 mutations. IDH mutations are therapeutic targets for the CCA subsets.[117,118]
Two contrasting FA catabolism in HCC subsets
About 50% of HCC cases are affected by the Wnt/β-catenin signaling in a patient cohort.[69] In the HCC subset with activated β-catenin, elevated FA oxidation (FAO) was detected in 20 of 26 tumors (GSE62232), and this FAO elevation was validated in anther HCC cohort.[119] Using Apc knockout mice, Senni and colleagues found that hepatocytes or HCC with β-catenin activation used FAO as an energy provider instead of the Warburg effect (Figure 4, green lines). In contrast, a steatohepatitic HCC subset characterized by large lipid droplets and tumor cell ballooning avoided FAO (Figure 4, purple lines). As revealed by Fujiwara and colleagues, the expression of carnitine-acylcarnitine translocase and carnitine palmitoyltransferase 2 (CPT2) directing acyl-carnitine to enter the mitochondria were all reduced in high-fat diet induced HCC,[120] similar to those in PIK3CA transgenic mice and high-fat diet fed MUP-uPA mice[99,120] (Figure 4, purple lines). In agreement, reduced CPT2 and elevated acylcarnitine levels were detected in the serum of HCC patients.[99] In this HCC subset, downregulation of FAO protected HCC cells from lipotoxicity and led to accumulation of oncometabolite acylcarnitine for tumorigenesis and cisplatin chemoresistance.[121] As the result, pyruvate was re-routed to OXPHO to compensate for the suppressed FAO.
Lipid and mitochondrial metabolism fuel CSCs responsible for metastasis and drug resistance of HCC or CCA
CSCs refer to a subset of cancer cells capable of self-renewing and responsible for tumor relapse, metastasis, and chemoresistance. Although it is still controversial for CSC existence in HCC, LO Re et al.[122] found that loss of macroH2A1 (an epigenetic regulator of stem cell function) led to CSC-like features with metabolic changes in HCC, such as enhanced lipogenesis and acetyl-CoA production, as well as PPP activation. In 72 HCC of patients, SIRT1 overexpression was detected in 56% of cases, which correlated with microvascular invasion, advanced TNM stage, and short patient survival[123] (Figure 4, red lines). SIRT1 depletion attenuated mitochondrial biogenesis, ATP production, cell migration and invasion of HCC, which was rescued by overexpression of peroxisome proliferator-activated receptor gamma coactivator-1 (PGC-1α), a master regulator of mitochondrial biogenesis. Thus, SIRT1/PGC-1α-induced mitochondrial biogenesis facilitates HCC invasion and metastasis[123] (Figure 4, red lines). Moreover, when Hep3B cells underwent a full epithelial-to-mesenchymal transition in response to TGFβ stimulation, lipolysis and free FA uptake in the cells increased, while glycolysis and lipogenesis reduced[124] (Figure 4, green lines). Thus, lipid and mitochondrial metabolism fuel a cell subset responsible for HCC invasion and metastasis.
Overexpression of PGC-1α promoted OXPHOS in CCA, which in turn facilitated CCA metastasis but not the growth of CCA cells.[125] In addition, the CSC-like phenotypes in CCA were defined by PGC-1α overexpression and mitochondrial metabolism (Figure 5, red line), and elevated expression of PGC-1α or mitochondrial complex II was correlated with worse prognosis and early recurrence in CCA patients.[126] Thus, the CSC subset in CCA is fueled by oxidative mitochondrial metabolism.
It has been shown that hypoxia induced by an anti-angiogenic drug stimulated free FA uptake and subsequent FAO so as to promote HCC cancer cell proliferation[127] (Figure 4 green lines). In addition, hypoxia promoted PGC-1α expression and mitochondrial biogenesis, allowing HCC cells to survive a harsh hypoxic condition by a high mobility group box 1 (HMGB1)-dependent mechanism.[128] However, others revealed that PGC-1α was a tumor suppressor and that its expression was downregulated in 25% of HCC cases in a patient cohort.[129] Moreover, hypoxia suppressed FAO in a HCC subset by a PGC-1β-dependent mechanism.[130,131] Thus, the lipid metabolic reprogramming is remarkably heterogeneous in HCC.
De novo lipogenesis in HCC and CCA
Acetyl-CoA carboxylase (ACC) converts acetyl-CoA to malonyl-CoA during de novo lipogenesis. Wang et al.[132] reported that ACCα-mediated FA synthesis was required for HCC survival by providing both FA and enzymes in FAO under metabolic stress and that ACCα upregulation was associated with poor patient survival and HCC recurrence in 267 patients after curative surgery (Figure 4). Fatty acid synthase (FASN) is another rate-limiting enzyme for lipid synthesis. FASN protein and mRNA levels were progressively increased from normal liver tissues to HCC and in a HCC subgroup with poorer survival, it was further upregulated post-transcriptionally[133] (Figure 4). Metabolic and gene expression data revealed that elevated lipid metabolites of stearoyl-CoA-desaturase 1 (SCD1) were associated with aberrant palmitate signaling and more aggressive HCC phenotypes in patients[107] (Figure 4). Palmitoleate (C16:1) and Oleate (C18:1) are 2 biological end products of SCD1 with HCC-promoting effects.[127] SCD1 is also a target of β-catenin and monounsaturated fatty acids that amplifies the Wnt pathway by enhancing Wnt receptor LRP5/6 expression to promote CSC-like HCC cells.[134] Importantly, the expression of lipogenic enzymes, such as ACC, FASN, and SCD1, is controlled by sterol regulatory element-binding protein 1c (SREBP1c) in hepatocytes and HCC (also known as sterol regulatory element-binding transcription factor 1, SREBF1c) (Figure 4). Large-scale gene expression profiling showed that SREBP1c-mediated lipogenic pathway was significantly activated in HBV-related and HCV-related HCC, and high SREBP1c expression was associated with poor prognosis of HCC patients.[135]
In contrast to HCC, reduced FASN expression was detected in human CCA and murine CCA (Figure 5). Hydrodynamic injection of AKT/Ras led to HCC and CCA lesions in wild type mice, but only CCA lesions in FASN knockout mice.[136] In addition, FASN gene ablation failed to influence CCA development induced by AKT/Notch intracellular domain 1. In the absence of FASN, CCA cells upregulated expression of lipoprotein lipase, CD36, and SLC27A to maintain the level of FAs (Figure 5). De Gauna et al.[137] found that highly proliferative human CCA cells relied on lipid and lipoprotein uptake to fuel FAO in vitro,[104] and a high serum CD36 level was associated with worse survival of CCA patients.[138] In contrast, in a cohort of 155 CCA collected at the Srinagarind Hospital, Khon Kaen University, high FASN expression was associated with advanced CCA stage and poor survival of the patients. In addition, FASN knockdown inhibited growth, migration, and invasion of KKU055 and KKU213 CCA cells in vitro[139] (Figure 5).
FAs also give rise to prostaglandins, which are bioactive lipids contributing to tumorigenesis.[140] Sphingosine-1-phosphate (S1P) is one of the prominent bioactive lipids influencing cell survival and proliferation, and it is formed by sphingosine kinases 1 and 2 (SPHK1/2). SPHK1 was found to be overexpressed in HCC and CCA compared with normal liver tissues, which correlated with reduced patient survival[141,142] (Figures 4 and 5). High expression of SPHK1 or SPHK2 also contributed to HCC drug resistance to oxaliplatin or regorafenib.[141,143]
Amino acid metabolism in HCC and CCA
Serine and threonine, which can be transformed into glucose for energy production, were increased in 50 HBV or HCV-related HCC of patients compared to non-tumoral tissues[74] (Figure 4). Glutamine, glutathione, taurine, branched-chain amino acids, including valine, leucine, isoleucine, as well as the aromatic amino acids, such as tryptophan, phenylalanine, and tyrosine, were also increased.[74] In another cohort of HCC, taurine, arginine, N-acetylaspartate, N-acetylasparagine, N-acetylalanine, N-acetylmethionine, N-(2-furoyl)glycine, and N-acetylthreonine were increased[107] (Figure 4). Hydroxyproline was elevated in another cohort of HCC with its high expression correlated to poor prognosis of the patients[144] (Figure 4).
Glutamine addiction was found in a subset of HCC harboring β-catenin mutations or overexpressing glutamine synthetase (GS), an enzyme converting glutamate to glutamine.[145] In a HCC cohort, 69.81% of HCC biopsies expressed GS, whereas only 13.64% of non-malignant liver tissues expressed GS[146] (Figure 4). Some CTNNB1-mutated HCC tumors were more sensitive to sorafenib than wildtype HCC, which was caused by GS-induced autophagy.[147] High expression of glutaminase (GLS1), an enzyme for glutaminolysis, is associated with HCC differentiation, lymphatic metastasis, TNM stage, and patients’ poor outcome in another HCC cohort[148] (Figure 4). GLS1 overexpression correlated with the activation of an AKT/GSK3β/cyclinD1 pathway that enhanced HCC proliferation.[148] The asparagine synthetase (ASNS) catalyzes the biosynthesis of asparagine from aspartate, which relies on glutamine as the nitrogen source. It is likely that ASNS knockdown promoted HCC by the accumulation of aspartate and glutamine that enhanced nucleotide biosynthesis and glutaminolysis[149] (Figure 4). Although HCC with low ASNS expression had poor prognosis, it may be more sensitive to L-asparaginase, which is a drug used for the treatment of acute lymphoblastic lymphoma.[149]
Multi-omics data also revealed that isoleucine, leucine, proline, and taurine were increased in 10 patient CCA tumors compared with nontumoral tissues[110] (Figure 5). Since certain human CCA cell lines were highly dependent on glutamine in vitro, derivative cell lines independent of external glutamine were established by a means of gradual reduction of external glutamine.[150] Comparing to the control cell lines, hypoxia-induced chemoresistance to cisplatin or gemcitabine was abolished in those CCA derivative lines, supporting the role of glutamine metabolism in the development of drug resistance in CCA.[150]
Metabolism in NAFLD/NASH and its association with liver cancer risk
Obesity is defined as body mass index of 30 or above and severe obesity as body mass index of > 40. According to Centers for Disease Control and Prevention (CDC), the incidence of adulthood obesity has increased by 300% and severe obesity by 1000% over the past 50 years (https://www.cdc.gov/nchs/data/hestat/obesity-adult-17-18/obesity-adult.htm#, Table 1). In a large cohort study involving 2162 liver cancer cases in the United States, a 75% increase of liver cancer was detected for obese individuals. Obese men were more susceptible for liver cancer than obese women.[172] The fat under the skin in humans is s.c. fat tissue, while visceral fat surrounds organs deeper in the abdomen such as the liver and pancreas.[173,174] When visceral obesity presents, the metabolites of the visceral fat are drained into the liver by portal vein, leading to fatty liver, altered lipid and glucose homeostasis, as well as insulin resistance.[175] Allen and colleagues analyzed the incidence of malignancies in a historical cohort of adults diagnosed with NAFLD in the Olmsted County Minnesota between 1997 and 2016 in relation to matched adults without NAFLD. The 21 years of longitudinal study revealed that NAFLD was associated with nearly a 2-fold risk of developing cancers, predominantly liver cancer followed by gastrointestinal tract and uterus cancer.[176] NAFLD even exhibited a stronger association with cancer risk than obesity alone.[176] A similar association was detected in a Korean population as well.[177]
TABLE 1.
Metabolic targets and inhibitors under investigation for the treatment of liver cancer
| Metabolic Pathway | Metabolic Target | Inhibitor (Cancer Type) | Clinical Trial or Approved Drug | References |
|---|---|---|---|---|
| Glycolysis (the Warburg effect) | Glut1 | BAY-876 (HCC) | [151] | |
| Aspirin (HCC) | FDA approved drug | [152–154] | ||
| HK2 | 2-DG (HCC) | [155,156] | ||
| Resveratrol (potentiates efficacy of sorafenib on HCC) | Dietary supplement | [157] | ||
| MCT1 | AZD-3965 | NCT01791595 (advanced cancer) | ||
| mTOR (Glut1 and glycolytic enzymes) | Everolimus (CCA) | FDA approved cancer drug | [158] | |
| PDK | Dichloroacetate (inhibit glycolysis & promote OXPHOS) | [159] | ||
| TCA Cycle | Mitochondrial complex I | Metformin |
NCT03184493 (HCC) NCT04033107 (HCC) NCT04114136 (HCC) |
|
| IDH1/2 | Metformin + chloroquine | NCT02496741 (CCA) | ||
| Ivosidenib | Approved for CCA subsets with IDH1 mutations | |||
| De novo lipogenesis (FA synthesis) | SREBP-1c | Fatostatin, FGH10019 (compound 24) (HCC) | [160–163] | |
| FASN | TVB2640 | NCT03938246 (NASH) | ||
| TVB 3664 (HCC induced by PTEN loss/c-MET or AKT/NRAS) | [164] | |||
| ACC | ND-654 (HCC) | [165] | ||
| SCD1 | A939572, CAY10566, MF-438, BZ36 | [166] | ||
| FAO and cholesterol | CPT | Etomoxir (HCC with activated β-catenin) | [119] | |
| HMG-CoA reductase | Simvastatin, Atorvastatin (CCA) | [167] | ||
| Pravastatin(potentiates chemoembolization on HCC) | NCT01075555 (Pravastatin + sorafenib for HCC) | [168,169] | ||
| SPHK2 | ABC294640 |
NCT01488513 (advanced solid tumor) NCT02939807 (HCC) NCT03377179 (ABC294640 alone or in combination with hydroxychloroquine for advanced CCA) |
||
| Amino acid metabolism | Glutaminase (GLS1) | CB-839 (HCC) | [170] | |
| Glutamine transporter | V-9302 (HCC, CCA) | |||
| Glutamine | Crisantaspase | FDA approved cancer drug | [171] | |
| GS | Methionine-L-sulfoximine | |||
| Autophagy | Hydroxychloroquine | NCT03037437 (Hydroxychloroquine +sorafenib for HCC) | ||
| NCT04566133 (Hydroxychloroquine +trametinib for CCA) |
ACC indicates acetyl-CoA carboxylase; CCA, cholangiocarcinoma; HK2, hexokinase II; FASN, fatty acid synthase; GLS1, glutaminase kidney isoform, mitochondrial; Glut1, glucose transporter 1; GS, glutamine synthetase; OXPHOS, oxidative phosphorylation; PDK, pyruvate dehydrogenase kinase; SCD1, stearoyl-CoA-desaturase 1.
NASH is an aggressive form of NAFLD, characterized by inflammation, steatosis, and hepatocellular damage, as well as ballooning in the presence or absence of fibrosis. NAFLD is characterized by simple steatosis due to fat accumulation. In NASH patient cohorts with cirrhosis, the cumulative HCC incidence ranged from 2.4% over 7 years to 12.8% over 3 years, whereas, in the cohorts with noncirrhotic stage of NAFLD, the cumulative HCC mortality was 0%–3% for study periods up to 20 years.[178] Among NASH-drive HCC cases, ~1% of them developed both HCC and CCA as shown in Figure 2. NAFLD/NASH has been predicted as a leading etiology of liver cancer in the coming years due to the rising global obesity rate.
Saturated FAs and ceramides accumulated in the liver are toxic to liver cells in NASH patients. Catabolizing long-chain FAs in peroxisomes for oxidation particularly increases the level of ROS and toxic lipid species, which damage the mitochondrial respiratory chain resulting in cytochrome c release and apoptotic cell death.[179,180] ROS and oxidative stress also disrupt endoplasmic reticulum, further potentiating hepatic cell injury and death by activating caspases 9 and 3.[179,180] On the other hand, insulin resistance and hyperglycemia drive upregulation of insulin and insulin-like growth factor-1 to enhance liver cell proliferation and inhibit apoptosis via activating the PI3K and MAPK pathways.[181] TNFα, IL6, and/or androgen-mediated signaling also participate in enhancing cell turnover in the liver.[181] ROS, oxidative stress, and inflammation cause DNA mutagenesis, and the genetic instability is about 10–20 folds higher in NASH than in NAFLD patients. Indeed, mutations in genes such as PNPLA3, TM6SF2, MBOAT7, GCKR, HSD17β13, and MARC1 were detected in NASH patients.[181,182] Further data supported that NASH driven hepatocarcinogenesis is a multi-factorial process involving aberrant lipid metabolism, mitochondrial dysfunction, oxidative stress, inflammatory response, and even the gut microbiome.[181,182]
Metabolism as a target for the prevention and treatment of liver cancer
Caloric restriction and fasting in liver cancer prevention
Since obesity and NAFLD are associated with liver cancer risk, proper caloric restriction, weight loss, and diabetes management are important strategies for liver cancer prevention. Short-term fasting (24–72 hours) or intermittent fasting has been proposed and tested for HCC prevention or treatment. A theory behind this is that, in response to short-term fasting, cancer cells continue uncontrolled growth due to genetic mutations leading to enhanced DNA damage and oxidative stress. Contrastingly, healthy cells shut down their growth, re-invest their energy in cellular maintenance and repair to protect them from chemotherapy-induced or radiotherapy-induced damages.[183] In various cancer models, short-term fasting indeed reduced the toxicity associated with chemotherapy, enhanced the efficacy of chemotherapy and radiotherapy, and improved the survival of animals.[183]
A 52-week-long experiment was conducted to evaluate whether fasting protected rats from diethylnitrosamine (DEN)-induced liver cancer, which revealed that intermittent fasting following DEN injection reduced the number and size of premalignant liver nodules.[184] Another study showed that short-term fasting led to a transient reduction of liver weight and loss of preneoplastic lesions in the liver of rats by (1) decreasing hepatocyte volume and proliferation and (2) inducing cell apoptosis.[185] However, it later promoted hepatocarcinogenesis in response to refeeding possibly due to enhanced cell proliferation compensatory to the fasting.[185] Consistently, 3 cycles of 3 days fasting added to a liver tumor promotion protocol led to 2 folds higher HCC incidence compared with the control rats.[186] Fasting-refeeding also potentiated hepatocarcinogenesis induced by a sub necrogenic dose of DEN (20 mg/kg).[187] Thus, fasting-refeeding appeared to promote hepatic cell turnover and HCC incidence different from what happened in other organs.
Since metabolic reprogramming represents a target for anti-cancer therapy, numerous drugs targeting metabolites or metabolic pathways have been developed and approved by FDA for cancer treatment. For example, methotrexate, a folate antagonist, is able to cure 90% of acute lymphoblastic lymphoma when combined with L-asparaginase targeting arginine.[188] 5-fluorouracil, gemcitabine, fludarabine, and hydroxyurea that are used to treat various cancers target nucleic acid synthesis, as well as ivosidenib and enasidenib target 2-HG synthesis.[188,189] In order to identify metabolic targets for liver cancer treatment, in vitro, preclinical, and clinical studies have been conducted and the potential metabolic targets under investigation are summarized as below (Table 1).
Targets in the Warburg effect
Targeting Glut1 has been investigated for HCC and CCA treatment (Table 1). For example, downregulating Glut1 expression by long non-coding RNA (lncRNA) SLC2A1-AS1 suppressed the proliferation and metastasis of HCC,[190] and targeting Glut1 by siRNA suppressed CCA cell migration and invasion.[97] BAY-876 is a Glut1 antagonist, and single injection of microcrystalline BAY-876 into HCC tumor tissues led to inhibition of glucose uptake, proliferation, and epithelial-to-mesenchymal transition of HCC in mice.[191] Liu et al.[152] reported that aspirin reduced glucose uptake and hepatoma proliferation in vitro and in mice by downregulating Glut1. Everolimus is a mTOR inhibitor, and it suppresses glucose uptake and tumor angiogenesis by reducing HIF-1α expression (Table 1). For HK2, HK2 silencing led to death of HCC cells and depleting hepatic HK2 reduced HCC incidence and sensitized HCC to sorafenib and metformin chemotherapy in mice.[80] 2-Deoxy-D-glucose (2-DG), a glucose analog targeting HK2 activity, reduced HCC migration and proliferation in vitro and sensitized HCC to sorafenib in mice[155,156] (Table 1). Resveratrol was able to potentiate sorafenib chemotherapy for HCC as well by downregulating HK2 expression.[157] Similarly, LDH-A knockdown resulted in HCC apoptosis and a significant reduction in metastatic potential in a xenograft HCC mouse model.[192]
Although the bi-phasic metabolic coupling has not been investigated for liver cancer, elevated MCT4 expression in HCC correlated with larger tumor size in patients, and MCT4 was an independent prognostic factor for HCC patients received trans-arterial chemoembolization.[193] MCT4 knockdown in vitro suppressed HCC cell proliferation, migration, and invasion.[193] In addition, AZD-3965, a small molecule targeting MCT1, is currently being tested in a clinical trial for the treatment of advanced cancers[188] (Table 1).
Targets in the TCA cycle
As mentioned above, PD controls the amount of pyruvate entering the TCA cycle with its activity inhibited by PDK. Shen et al.[159] tested the hypothesis that targeting PDK may direct more pyruvate into the TCA cycle so as to inhibit the Warburg effect and overcome HCC drug resistance. This hypothesis was tested by a PDK inhibitor dichloroacetate (DCA), and the results showed that DCA indeed activated OXPHOS and sensitized HCC to sorafenib treatment in vitro and in mice[159] (Table 1). Metformin, widely used in diabetic patients for blood glucose control, activates AMP-activated protein kinase and inhibits OXPHOS by binding to the mitochondrial complex I in the ETC.[2] Type 2 diabetic patients received metformin exhibited a decreased HCC incidence.[20] Metformin inhibited the proliferation, migration, invasion of HCC in vitro, and suppressed HCC xenografts in mice.[194,195] Metformin is now in 3 clinical trials for HCC treatment (NCT03184493, NCT04033107, NCT04114136) (Table 1).
Metformin is also a promising strategy for CCA prevention and treatment.[196] It suppressed CCA expressing markers related to CSC phenotypes and reduced CCA growth in mice.[126] IDH1/2-mutated cancer cells produce the oncometabolite 2-HG, and they are metabolically vulnerable to the treatment with metformin and an oral antimalarial drug chloroquine.[197] A phase IB/II clinical trial is currently ongoing to assess the effect of metformin/chloroquine combination for CCA (NCT02496741) (Table 1). Approximately 20% of CCA carry mutations in IDH1 and IDH2. Ivosidenib, targeting IDH1 mutations in the TCA cycle, has already been approved for CCA subsets with IDH1 mutations.
Targets in lipid metabolism
In a study, suppression of SREBP-1c induced cell cycle arrest and apoptosis of HCC, whereas overexpression of SREBP-1c enhanced HCC proliferation, suggesting that SREBP-1c may be a therapeutic target for HCC subsets, depending on de novo lipogenesis.[127] Fatostatin, a small molecule targeting the activation of SREBPs, blocked the increases of body weight, blood glucose, hepatic fat accumulation in obese ob/ob mice,[160] and inhibited prostate cancer growth and metastasis in a mouse model.[161] A series of fatostatin derivatives have been developed, and FGH10019 or compound 24 is the most potent one with high aqueous solubility and membrane permeability (Table 1). FGH10019 may serve as a seed molecule for further development of anti-SREBP drugs.[162] FASN inhibitor TVB2640 reduced liver fat content, inflammation, and fibrosis in NASH patients (NCT03938246). TVB3664 was able to ameliorate the fatty liver disease phenotype of mice.[164] When TVB3664 was administered into mice at the early tumor stage, it prevented HCC development induced by PTEN inactivation/c-MET or AKT/NRAS, and improved the efficacy of sorafenib or cabozantinib on c-MYC driven HCC in combination therapies[164] (Table 1). However, neither TVB3664 nor FASN gene deletion influenced HCC induced by β-cateninΔ90/c-MET.[164,198] Thus, FASN inhibitors may be used to treat the HCC subsets with FASN dependence.
ACC is another limiting enzyme in de novo lipogenesis. Targeting ACC by ND-654 suppressed lipogenesis, inflammation, and HCC development in rats[165] (Table 1). However, liver-specific ACC knockout enhanced HCC development in mice in response to DEN due to a marked increase in antioxidants, including NADPH, and reduced glutathione.[199] Targeting SCD1 by siRNA reduced HCC cell migration, colony formation, and HCC tumorigenicity in mice.[107] Targeting myofibroblast SCD1 by a genetic approach also inhibited liver tumor development and growth in mice.[134] SCD1 inhibitors A939572, CAY10566, MF-438, and BZ36 have been developed (Table 1) and their effect had been tested in other cancers, such as lung, prostate, ovarian, and colorectal cancer.[166,200–203]
A HCC subset with activated β-catenin is addicted to FAO, so PPARα gene deletion or a CPT inhibitor etomoxir was able to inhibit FAO and the HCC tumors in mice[119] (Table 1). Statins, known as HMG-CoA reductase inhibitors, are lipid-lowering drugs approved for patients with high LDL cholesterol who has high risk for cardiovascular diseases. Simvastatin or atorvastatin reduced the proliferation and migration of cultured CCA cells and induced CCA apoptosis by activating p21 and caspase 3[167] (Table 1). Pravastatin prolonged survival of HCC patients who received transcatheter arterial embolization and 5-fluorouracil treatment[168] and HCC patients who received chemoembolization.[204] However, the sorafenib/pravastatin combination failed to improve overall survival of HCC patients in a randomized-controlled trial (NCT01075555).[169]
Conserved lipid kinases SPHK1 and SPHK2 lead to S1P production that, in turn, enhances survival and proliferation of cancer cells. A SPHK2 inhibitor, ABC294640 (3-(4-chlorophenyl)-adamantane-1-carboxylic acid (pyridin-4-ylmethyl)amide, reduced intra-tumoral S1P level, and induced tumor cell apoptosis in mice.[205] In a phase I clinical trial for advanced solid tumors, a partial response to ABC294640 treatment was a patient with advanced CCA[206] (Table 1). A phase I/IIA study is ongoing with ABC294640 alone as well as in combination with hydroxychloroquine to treat CCA patients (NCT03377179). In addition, ABC294640 had been tested as the second-line monotherapy for advanced HCC in a phase II clinical trial (NCT02939807) (Table 1).
Targets in amino acid metabolism
Anti-leukemic drug crisantaspase depletes glutamine, and methionine-L-sulfoximine inhibits the activity of GS. The combination of crisantaspase and methionine-L-sulfoximine reduced glutamine supply so as to suppress xenografts of the CTNNB1-mutated HCC in mice[171] (Table 1). GLS1 converts glutamine to glutamate to feed the TCA cycle. Although the GLS1 inhibitor CB-839 had limited effect on HCC, it induced apoptosis of HCC and inhibited HCC xenografts in mice when combined with V-9302, a novel inhibitor for glutamine transporter.[170] Downregulation of glutamine transporter suppressed CCA cell migration and invasion as well.[207] Autophagy provides amino acids including glutamine to fuel the TCA cycle, contributing to the drug resistance of cancer. Hydroxychloroquine, approved for rheumatoid arthritis treatment, inhibits cell autophagy. In a phase II trial, sorafenib/hydroxychloroquine combination led to a much better response rate (25%) than that of sorafenib alone (2%) in patients with advanced HCC (NCT03037437) (Table 1). Trametinib (a MEK inhibitor)/hydroxychloroquine combination is currently in a clinical trial for the treatment of KRAS mutated refractory CCA (NCT04566133) (Table 1).
Identifying metabolic targets using systems biological approaches
GEMs, constructed by integrating genomics, transcriptomics, proteomics, and metabolomics data are valuable tools allowing us to study liver diseases at the systems biology level. HepatoNet1 was reconstructed based on more than 1500 original scientific research publications in 2010. It provides a comprehensive metabolic network of human hepatocytes and a structural platform for computational studies on liver function.[208] iHepatocytes2322 was reconstructed based on Human Metabolic Reaction 2.0 database and proteomics data in Human Protein Atlas in 2013, and it can be utilized to identify potential biomarkers and therapeutic targets for NAFLD.[209] iHCC2578 was constructed based on the gene expression profiles of 361 HCC tissues, 49 noncancerous samples, and proteome data of HCC, leading to the prediction that mitochondrial acetate is an emerging substrate for FA synthesis catalyzed by the mitochondrial acetyl-CoA synthetase.[131] An association between acetyl-CoA synthetase 1 expression and HCC growth was indeed confirmed by data of patients.[131] Personalized GEMs for HCC patients were constructed and used for screening potential anti-cancer metabolites and genes, as well as in silico assessing the toxicity of targeted therapy.[210,211] Despite the high heterogeneity of HCC, GEMs stratified HCC patients into different subtypes with distinct features in metabolism, signaling pathways, and clinical survival.[212] GEMs can also be used to study the metabolic characteristics of CSCs and search for potential cures for drug resistance associated with liver cancer therapy.[213]
CONCLUSION AND FUTURE PERSPECTIVE
Since liver is a main metabolic organ, it is not surprising that liver cancers are driven by metabolic alterations and can be targeted by compounds that block specific metabolic changes of liver cancer. However, metabolic reprogramming in HCC and CCA is remarkably heterogeneous due to heterogeneous driver gene mutations and oncogenic signals in liver cancer subsets. For example, steatohepatitic HCC subset and another one with activated β-catenin exhibited contrasting FAO. The aberrant oncogenic signals make certain HCC subsets addicted to glutamine. In addition, CSCs in HCC or CCA rely on mitochondrial metabolism to maintain their phenotypes, and metastasis and drug resistance of HCC or CCA are largely mediated by FAO in the mitochondria.
There are numerous challenges associated with targeting metabolism for cancer treatment. Ability for dynamic metabolic changes is a surviving mechanism for cancer cells and they can utilize alternative pathways or energy resources when one metabolic pathway is blocked or eliminated. Since metabolic pathways are needed to fuel CD8+ T cells, natural killer cells, or type 1 macrophages and allow these cells to exhibit tumor-killing activities, agents designed to block metabolism supporting pathways may impair proliferation, activation, and cytotoxicity of the immune cells. They may also target the healthy proliferating cells in human body, such as bone marrow stem cells and normal intestinal epithelial cells, leading to intolerable side-effects. A solution to these challenges may be achieved by performing studies on animals with intact immune system such as allografting tumor cells obtained from mice with same genetic strain than the host, utilizing genetically engineered tumor mouse models or performing patient-derived xenografts to mice with humanized immune system. This allows proper assessment of the impact of the targeted therapy on both cancer and immune cells. Targeting multiple metabolic pathways by a single chemoagent or a combination therapy that targets metabolism and cancer driving mutations or immune checkpoints may be considered to enhance therapeutic efficacy and overcome the drug resistance. In this regard, GEMs may be particularly useful for in silico assessment of the treatment effect and the toxicity of a targeted therapy using computational and systems biological approaches. GEMs have potential to transform cancer research and patient care for the novel and unique approach in identifying anti-cancer targets and treatment strategies personalized for liver cancer patients.
Abbreviations:
- 2-HG
(R)-2-hydroxyglutarate
- 5,10-methylene THF
5,10-methylene tetrahydrofolate
- ACC
acetyl-CoA carboxylase
- Acetyl-CoA
acetyl coenzyme A
- AKT
protein kinase B (PKB)
- ASNS
asparagine synthetase
- ATM
ATM serine/threonine kinase
- BAP1
BRCA1 associated protein-1 gene
- Bcr-Abl
Bcr and Abl gene fusion mutation
- BRAF
proto-oncogene B-Raf
- CAF
cancer-associated fibroblast
- Cav1
caveolin-1
- CCA
cholangiocarcinoma
- CD36
platelet glycoprotein 4
- CDKN2A
cyclin-dependent kinase inhibitor 2A gene
- CPT1B
carnitine palmitoyltransferase 1B
- CPT2
carnitine palmitoyltransferase 2
- CSC
cancer stem-like cell
- CTNNB1
catenin beta-1 gene
- EGFR
epidermal growth factor receptor
- ETC complex I
NADH-coenzyme Q reductase
- ETC complex II
succinate coenzyme Q reductase
- ETC complex III
coenzyme Q cytochrome c reductase
- ETC complex IV
cytochrome c oxidase
- ETC complex V
ATP synthase
- ETC
electron transport chain
- FA
fatty acid
- FAD
flavin adenine dinucleotide
- FADH2
reduced flavin adenine dinucleotide
- FAO
fatty acid oxidation
- FASN
fatty acid synthase
- FGFR
fibroblast growth factor receptors gene
- FoxO3
forkhead box protein O3
- G6P
glucose-6-phosphate
- G6PDH
glucose-6-phosphate dehydrogenase
- GCKR
glucokinase (hexokinase 4) regulator gene
- GEMs
genome-wide metabolic models
- GFAT
glutamine:fructose-6-phosphate amindotransferase
- GLS1
glutaminase kidney isoform, mitochondrial
- Glut1
glucose transporter 1
- GS
glutamine synthetase
- HBP
hexosamine biosynthetic pathway
- HIF-1α
hypoxia-inducible factor 1-alpha
- HK2
hexokinase II
- HMG-CoA
β-hydroxy β-methylglutaryl-CoA
- HSD17β13
17β-hydroxysteroid dehydrogenase type 13 gene
- IDH
isocitrate dehydrogenase
- JAK
janus kinases
- KRAS
GTPase KRas gene
- LDH
lactic dehydrogenase
- MAPK
mitogen-activated protein kinase
- MARC1
mitochondrial amidoxime-reducing component 1 gene
- MBOAT7
lysophospholipid acyltransferase 7 gene
- MCT1
monocarboxylate transporter 1
- MCT4
monocarboxylate transporter 4
- miR
microRNA
- mTOR
the mammalian target of rapamycin
- mTORC1
mammalian target of rapamycin complex 1
- MYC
MYC proto-oncogene
- NRASG12V
neuroblastoma RAS viral oncogene homolog (G12V)
- NRF2
nuclear factor erythroid 2-related factor
- O-GlcNAcylation
O-linked β-N-acetylglucosamine
- OGT
UDP-N-acetylglucosamine peptide N-acetylglucosaminyltransferase
- OXPHOS
oxidative phosphorylation
- PD
pyruvate dehydrogenase
- PDK3
pyruvate dehydrogenase kinase
- PGC1α
the peroxisome proliferator-activated receptor γ coactivator-1α
- PI3K
phosphoinositide 3-kinase
- PI3K
Phosphoinositide 3-kinases
- PKM
pyruvate kinase M
- PM
plasma membrane
- PNPLA3
Patatin-like phospholipase domain-containing protein 3 gene
- PPP
pentose phosphate pathway
- RAS
Ras protein superfamily of small GTPases
- ROS
reactive oxygen species
- S1P
sphingosine-1-phosphate
- SCD1
stearoyl-CoA-desaturase 1
- SDH
succinate dehydrogenase
- SDHB
succinate dehydrogenase subunit B
- SHMT
serine hydroxymethyltransferase
- SIRT3
Sirtuin-3 deacetylase
- SLC27A1
solute carrier family 27 member 1
- SLC2A1-AS1
solute carrier family 2 member 1-antisense 1
- SMAD4
mothers against decapentaplegic homolog 4 gene
- SMARCA2
probable global transcription activator SNF2L2 gene
- SPHK1 and SPHK2
sphingosine kinase 1 and 2
- SREBPs
sterol regulatory element-binding proteins
- STAT
signal transducer and activator of transcription
- SWI/SNF
SWItch/Sucrose Non-Fermentable
- TAG
triglyceride
- TCA
tricarboxylic acid
- TERT
telomerase reverse transcriptase gene
- THF
tetrahydrofolate
- TM6SF2
transmembrane 6 superfamily 2 gene
- TRIM35
tripartite motif-containing 35
- UDP-GlcNAc
uridine diphosphate N-acetylglucosamine
- WNT
Wingless/Integrated
- YEATS4
YEATS domain containing 4
- α-KG
α-ketoglutarate
Footnotes
CONFLICT OF INTEREST
Nothing to report.
FINANCIAL DISCLOSURES
The authors thank the Cancer and Health Disparities Summer Internship Program to F. Yang, NIH R21C A256428 grant to L. Hilakivi-Clarke, R01CA160069 to N. Kang, the Windfelts Research Pilot Award, as well as the Mayo Clinic Hepatobiliary SPORE (P50 CA210964) DRP Award to N. Kang.
REFERENCES
- 1.Kim J, DeBerardinis RJ. Mechanisms and implications of metabolic heterogeneity in cancer. Cell Metab. 2019;30:434–46. [DOI] [PMC free article] [PubMed] [Google Scholar]
- 2.DeBerardinis RJ, Chandel NS. Fundamentals of cancer metabolism. Sci Adv. 2016;2:e1600200. [DOI] [PMC free article] [PubMed] [Google Scholar]
- 3.Martinez-Reyes I, Chandel NS. Cancer metabolism: looking forward. Nat Rev Cancer. 2021;21:669–80. [DOI] [PubMed] [Google Scholar]
- 4.Hanahan D, Weinberg RA. Hallmarks of cancer: the next generation. Cell. 2011;144:646–74. [DOI] [PubMed] [Google Scholar]
- 5.Pavlova NN, Thompson CB. The emerging hallmarks of cancer metabolism. Cell Metab. 2016;23:27–47. [DOI] [PMC free article] [PubMed] [Google Scholar]
- 6.Liberti MV, Locasale JW. The warburg effect: how does it benefit cancer cells? Trends Biochem Sci. 2016;41:211–8. [DOI] [PMC free article] [PubMed] [Google Scholar]
- 7.Potter M, Newport E, Morten KJ. The Warburg effect: 80 years on. Biochem Soc Trans. 2016;44:1499–505. [DOI] [PMC free article] [PubMed] [Google Scholar]
- 8.Vander Heiden MG, Cantley LC, Thompson CB. Understanding the Warburg effect: the metabolic requirements of cell proliferation. Science. 2009;324:1029–33. [DOI] [PMC free article] [PubMed] [Google Scholar]
- 9.Yoshida GJ. Metabolic reprogramming: the emerging concept and associated therapeutic strategies. J Exp Clin Cancer Res. 2015;34:111. [DOI] [PMC free article] [PubMed] [Google Scholar]
- 10.Xing Y, Zhao S, Zhou BP, Mi J. Metabolic reprogramming of the tumour microenvironment. FEBS J. 2015;282:3892–8. [DOI] [PubMed] [Google Scholar]
- 11.Avagliano A, Granato G, Ruocco MR, Romano V, Belviso I, Carfora A, et al. Metabolic reprogramming of cancer associated fibroblasts: the slavery of stromal fibroblasts. Biomed Res Int. 2018;2018:6075403. [DOI] [PMC free article] [PubMed] [Google Scholar]
- 12.Certo M, Tsai C-H, Pucino V, Ho P-C, Mauro C. Lactate modulation of immune responses in inflammatory versus tumour microenvironments. Nat Rev Immunol. 2021;21:151–61. [DOI] [PubMed] [Google Scholar]
- 13.Morrot A, Fonseca LMd, Salustiano EJ, Gentile LB, Conde L, Filardy AA, et al. Metabolic symbiosis and immunomodulation: how tumor cell-derived lactate may disturb innate and adaptive immune responses. Front Oncol. 2018;8:81. [DOI] [PMC free article] [PubMed] [Google Scholar]
- 14.Wang ZH, Peng WB, Zhang P, Yang XP, Zhou Q. Lactate in the tumour microenvironment: from immune modulation to therapy. EBioMedicine. 2021;73:103627. [DOI] [PMC free article] [PubMed] [Google Scholar]
- 15.Satriano L, Lewinska M, Rodrigues PM, Banales JM, Andersen JB. Metabolic rearrangements in primary liver cancers: cause and consequences. Nat Rev Gastroenterol Hepatol. 2019;16:748–66. [DOI] [PubMed] [Google Scholar]
- 16.Gingold JA, Zhu D, Lee DF, Kaseb A, Chen J. Genomic profiling and metabolic homeostasis in primary liver cancers. Trends Mol Med. 2018;24:395–411. [DOI] [PubMed] [Google Scholar]
- 17.Brunt E, Aishima S, Clavien PA, Fowler K, Goodman Z, Gores G, et al. cHCC-CCA: Consensus terminology for primary liver carcinomas with both hepatocytic and cholangiocytic differentation. Hepatology. 2018;68:113–26. [DOI] [PMC free article] [PubMed] [Google Scholar]
- 18.Banales JM, Marin JJG, Lamarca A, Rodrigues PM, Khan SA, Roberts LR, et al. Cholangiocarcinoma 2020: the next horizon in mechanisms and management. Nat Rev Gastroenterol Hepatol. 2020;17:557–88. [DOI] [PMC free article] [PubMed] [Google Scholar]
- 19.Rizvi S, Borad MJ, Patel T, Gores GJ. Cholangiocarcinoma: molecular pathways and therapeutic opportunities. Semin Liver Dis. 2014;34:456–64. [DOI] [PMC free article] [PubMed] [Google Scholar]
- 20.Shang RZ, Qu SB, Wang DS. Reprogramming of glucose metabolism in hepatocellular carcinoma: progress and prospects. World J Gastroenterol. 2016;22:9933–43. [DOI] [PMC free article] [PubMed] [Google Scholar]
- 21.Pant K, Richard S, Peixoto E, Gradilone SA. Role of glucose metabolism reprogramming in the pathogenesis of cholangiocarcinoma. Front Med (Lausanne). 2020;7:113. [DOI] [PMC free article] [PubMed] [Google Scholar]
- 22.Alves AP, Mamede AC, Alves MG, Oliveira PF, Rocha SM, Botelho MF, et al. Glycolysis inhibition as a strategy for hepatocellular carcinoma treatment? Curr Cancer Drug Targets. 2019;19:26–40. [DOI] [PubMed] [Google Scholar]
- 23.Wu S, Kuang H, Ke J, Pi M, Yang D-H. Metabolic reprogramming induces immune cell dysfunction in the tumor microenvironment of multiple myeloma. Front Oncol. 2021;10:591342. [DOI] [PMC free article] [PubMed] [Google Scholar]
- 24.Allison KE, Coomber BL, Bridle BW. Metabolic reprogramming in the tumour microenvironment: a hallmark shared by cancer cells and T lymphocytes. Immunology. 2017;152:175–84. [DOI] [PMC free article] [PubMed] [Google Scholar]
- 25.Kim J Regulation of immune cell functions by metabolic reprogramming. J Immunol Res. 2018;2018:8605471. [DOI] [PMC free article] [PubMed] [Google Scholar]
- 26.Biswas SK. Metabolic reprogramming of immune cells in cancer progression. Immunity. 2015;43:435–49. [DOI] [PubMed] [Google Scholar]
- 27.Taillefer M, Sparling R. Glycolysis as the central core of fermentation. Adv Biochem Eng Biotechnol. 2016;156:55–77. [DOI] [PubMed] [Google Scholar]
- 28.Anderson NM, Mucka P, Kern JG, Feng H. The emerging role and targetability of the TCA cycle in cancer metabolism. Protein Cell. 2018;9:216–37. [DOI] [PMC free article] [PubMed] [Google Scholar]
- 29.Papa S, Martino PL, Capitanio G, Gaballo A, De Rasmo D, Signorile A, et al. The oxidative phosphorylation system in mammalian mitochondria. Adv Exp Med Biol. 2012;942:3–37. [DOI] [PubMed] [Google Scholar]
- 30.Tang JX, Thompson K, Taylor RW, Olahova M. Mitochondrial OXPHOS biogenesis: co-regulation of protein synthesis, import, and assembly pathways. Int J Mol Sci. 2020;21:3820. [DOI] [PMC free article] [PubMed] [Google Scholar]
- 31.Patra KC, Hay N. The pentose phosphate pathway and cancer. Trends Biochem Sci. 2014;39:347–54. [DOI] [PMC free article] [PubMed] [Google Scholar]
- 32.Jiang P, Du W, Wu M. Regulation of the pentose phosphate pathway in cancer. Protein Cell. 2014;5:592–602. [DOI] [PMC free article] [PubMed] [Google Scholar]
- 33.Alfarouk KO, Ahmed SBM, Elliott RL, Benoit A, Alqahtani SS, Ibrahim ME, et al. The pentose phosphate pathway dynamics in cancer and its dependency on intracellular pH. Metabolites. 2020;10:285. [DOI] [PMC free article] [PubMed] [Google Scholar]
- 34.Vazquez A, Kamphorst JJ, Markert EK, Schug ZT, Tardito S, Gottlieb E. Cancer metabolism at a glance. J Cell Sci. 2016;129:3367–73. [DOI] [PMC free article] [PubMed] [Google Scholar]
- 35.Li Z, Zhang H. Reprogramming of glucose, fatty acid and amino acid metabolism for cancer progression. Cell Mol Life Sci. 2016;73:377–92. [DOI] [PMC free article] [PubMed] [Google Scholar]
- 36.Amelio I, Cutruzzola F, Antonov A, Agostini M, Melino G. Serine and glycine metabolism in cancer. Trends Biochem Sci. 2014;39:191–8. [DOI] [PMC free article] [PubMed] [Google Scholar]
- 37.Tan AS, Baty JW, Dong LF, Bezawork-Geleta A, Endaya B, Goodwin J, et al. Mitochondrial genome acquisition restores respiratory function and tumorigenic potential of cancer cells without mitochondrial DNA. Cell Metab. 2015;21:81–94. [DOI] [PubMed] [Google Scholar]
- 38.Weinberg F, Hamanaka R, Wheaton WW, Weinberg S, Joseph J, Lopez M, et al. Mitochondrial metabolism and ROS generation are essential for Kras-mediated tumorigenicity. Proc Natl Acad Sci U S A. 2010;107:8788–93. [DOI] [PMC free article] [PubMed] [Google Scholar]
- 39.Carew JS, Huang P. Mitochondrial defects in cancer. Mol Cancer. 2002;1:9. [DOI] [PMC free article] [PubMed] [Google Scholar]
- 40.Singh KK. Mitochondrial dysfunction is a common phenotype in aging and cancer. Ann N Y Acad Sci. 2004;1019:260–4. [DOI] [PubMed] [Google Scholar]
- 41.Taylor RW, Turnbull DM. Mitochondrial DNA mutations in human disease. Nat Rev Genet. 2005;6:389–402. [DOI] [PMC free article] [PubMed] [Google Scholar]
- 42.Gatenby RA, Gillies RJ. Why do cancers have high aerobic glycolysis? Nat Rev Cancer. 2004;4:891–9. [DOI] [PubMed] [Google Scholar]
- 43.Blum R, Jacob-Hirsch J, Amariglio N, Rechavi G, Kloog Y. Ras inhibition in glioblastoma down-regulates hypoxia-inducible factor-1alpha, causing glycolysis shutdown and cell death. Cancer Res. 2005;65:999–1006. [PubMed] [Google Scholar]
- 44.Gottschalk S, Anderson N, Hainz C, Eckhardt SG, Serkova NJ. Imatinib (STI571)-mediated changes in glucose metabolism in human leukemia BCR-ABL-positive cells. Clin Cancer Res. 2004;10:6661–8. [DOI] [PubMed] [Google Scholar]
- 45.Hoxhaj G, Manning BD. The PI3K-AKT network at the interface of oncogenic signalling and cancer metabolism. Nat Rev Cancer. 2020;20:74–88. [DOI] [PMC free article] [PubMed] [Google Scholar]
- 46.Kruiswijk F, Labuschagne CF, Vousden KH. p53 in survival, death and metabolic health: a lifeguard with a licence to kill. Nat Rev Mol Cell Biol. 2015;16:393–405. [DOI] [PubMed] [Google Scholar]
- 47.Schwartzenberg-Bar-Yoseph F, Armoni M, Karnieli E. The tumor suppressor p53 down-regulates glucose transporters GLUT1 and GLUT4 gene expression. Cancer Res. 2004;64:2627–33. [DOI] [PubMed] [Google Scholar]
- 48.Coy JF, Dressler D, Wilde J, Schubert P. Mutations in the transketolase-like gene TKTL1: clinical implications for neurodegenerative diseases, diabetes and cancer. Clin Lab. 2005;51:257–73. [PubMed] [Google Scholar]
- 49.Astuti D, Latif F, Dallol A, Dahia PL, Douglas F, George E, et al. Gene mutations in the succinate dehydrogenase subunit SDHB cause susceptibility to familial pheochromocytoma and to familial paraganglioma. Am J Hum Genet. 2001;69:49–54. [DOI] [PMC free article] [PubMed] [Google Scholar]
- 50.Pollard PJ, Brière JJ, Alam NA, Barwell J, Barclay E, Wortham NC, et al. Accumulation of Krebs cycle intermediates and overexpression of HIF1α in tumours which result from germline FH and SDH mutations. Hum Mol Genet. 2005;14:2231–9. [DOI] [PubMed] [Google Scholar]
- 51.Neumann HP, Pawlu C, Peczkowska M, Bausch B, McWhinney SR, Muresan M, et al. Distinct clinical features of paraganglioma syndromes associated with SDHB and SDHD gene mutations. JAMA. 2004;292:943–51. [DOI] [PubMed] [Google Scholar]
- 52.Bayley JP, Launonen V, Tomlinson IP. The FH mutation database: an online database of fumarate hydratase mutations involved in the MCUL (HLRCC) tumor syndrome and congenital fumarase deficiency. BMC Med Genet. 2008;9:20. [DOI] [PMC free article] [PubMed] [Google Scholar]
- 53.Jin L, Zhou Y. Crucial role of the pentose phosphate pathway in malignant tumors. Oncol Lett. 2019;17:4213–21. [DOI] [PMC free article] [PubMed] [Google Scholar]
- 54.Wilde L, Roche M, Domingo-Vidal M, Tanson K, Philp N, Curry J, et al. Metabolic coupling and the Reverse Warburg Effect in cancer: implications for novel biomarker and anticancer agent development. Semin Oncol. 2017;44:198–203. [DOI] [PMC free article] [PubMed] [Google Scholar]
- 55.Viale A, Pettazzoni P, Lyssiotis CA, Ying H, Sanchez N, Marchesini M, et al. Oncogene ablation-resistant pancreatic cancer cells depend on mitochondrial function. Nature. 2014;514:628–32. [DOI] [PMC free article] [PubMed] [Google Scholar]
- 56.Haq R, Shoag J, Andreu-Perez P, Yokoyama S, Edelman H, Rowe GC, et al. Oncogenic BRAF regulates oxidative metabolism via PGC1alpha and MITF. Cancer Cell. 2013;23:302–15. [DOI] [PMC free article] [PubMed] [Google Scholar]
- 57.Sun Y, Xu H, Chen X, Li X, Luo B. Inhibition of mitochondrial respiration overcomes hepatocellular carcinoma chemoresistance. Biochem Biophys Res Commun. 2019;508:626–32. [DOI] [PubMed] [Google Scholar]
- 58.DeBerardinis RJ, Cheng T. Q’s next: the diverse functions of glutamine in metabolism, cell biology and cancer. Oncogene. 2010;29:313–24. [DOI] [PMC free article] [PubMed] [Google Scholar]
- 59.Csibi A, Fendt SM, Li C, Poulogiannis G, Choo AY, Chapski DJ, et al. The mTORC1 pathway stimulates glutamine metabolism and cell proliferation by repressing SIRT4. Cell. 2013;153:840–54. [DOI] [PMC free article] [PubMed] [Google Scholar]
- 60.Dang CV, Le A, Gao P. MYC-induced cancer cell energy metabolism and therapeutic opportunities. Clin Cancer Res. 2009;15:6479–83. [DOI] [PMC free article] [PubMed] [Google Scholar]
- 61.Weinstein IB, Joe A. Oncogene addiction. Cancer Res. 2008;68:3077–80; discussion 3080. [DOI] [PubMed] [Google Scholar]
- 62.Yan W, Zhang W, Jiang T. Oncogene addiction in gliomas: implications for molecular targeted therapy. J Exp Clin Cancer Res. 2011;30:58. [DOI] [PMC free article] [PubMed] [Google Scholar]
- 63.Sahai E, Astsaturov I, Cukierman E, DeNardo DG, Egeblad M, Evans RM, et al. A framework for advancing our understanding of cancer-associated fibroblasts. Nat Rev Cancer. 2020;20:174–86. [DOI] [PMC free article] [PubMed] [Google Scholar]
- 64.Kang N, Shah VH, Urrutia R. Membrane-to-nucleus signals and epigenetic mechanisms for myofibroblastic activation and desmoplastic stroma: potential therapeutic targets for liver metastasis? Mol Cancer Res. 2015;13:604–12. [DOI] [PMC free article] [PubMed] [Google Scholar]
- 65.Guido C, Whitaker-Menezes D, Capparelli C, Balliet R, Lin Z, Pestell RG, et al. Metabolic reprogramming of cancer-associated fibroblasts by TGF-beta drives tumor growth: connecting TGF-beta signaling with “Warburg-like” cancer metabolism and L-lactate production. Cell Cycle. 2012;11:3019–35. [DOI] [PMC free article] [PubMed] [Google Scholar]
- 66.Martinez-Outschoorn UE, Lin Z, Trimmer C, Flomenberg N, Wang C, Pavlides S, et al. Cancer cells metabolically “fertilize” the tumor microenvironment with hydrogen peroxide, driving the Warburg effect: implications for PET imaging of human tumors. Cell Cycle. 2011;10:2504–20. [DOI] [PMC free article] [PubMed] [Google Scholar]
- 67.Fiaschi T, Marini A, Giannoni E, Taddei ML, Gandellini P, De Donatis A, et al. Reciprocal metabolic reprogramming through lactate shuttle coordinately influences tumor-stroma interplay. Cancer Res. 2012;72:5130–40. [DOI] [PubMed] [Google Scholar]
- 68.Jindal A, Thadi A, Shailubhai K. Hepatocellular carcinoma: etiology and current and future drugs. J Clin Exp Hepatol. 2019;9:221–32. [DOI] [PMC free article] [PubMed] [Google Scholar]
- 69.Schulze K, Imbeaud S, Letouze E, Alexandrov LB, Calderaro J, Rebouissou S, et al. Exome sequencing of hepatocellular carcinomas identifies new mutational signatures and potential therapeutic targets. Nat Genet. 2015;47:505–11. [DOI] [PMC free article] [PubMed] [Google Scholar]
- 70.Nakamura H, Arai Y, Totoki Y, Shirota T, Elzawahry A, Kato M, et al. Genomic spectra of biliary tract cancer. Nat Genet. 2015;47:1003–10. [DOI] [PubMed] [Google Scholar]
- 71.Matter MS, Marquardt JU, Andersen JB, Quintavalle C, Korokhov N, Stauffer JK, et al. Oncogenic driver genes and the inflammatory microenvironment dictate liver tumor phenotype. Hepatology. 2016;63:1888–99. [DOI] [PMC free article] [PubMed] [Google Scholar]
- 72.Friemel J, Rechsteiner M, Frick L, Bohm F, Struckmann K, Egger M, et al. Intratumor heterogeneity in hepatocellular carcinoma. Clin Cancer Res. 2015;21:1951–61. [DOI] [PubMed] [Google Scholar]
- 73.Nwosu ZC, Megger DA, Hammad S, Sitek B, Roessler S, Ebert MP, et al. Identification of the consistently altered metabolic targets in human hepatocellular carcinoma. Cell Mol Gastroenterol Hepatol. 2017;4:303–323 e301. [DOI] [PMC free article] [PubMed] [Google Scholar]
- 74.Huang Q, Tan Y, Yin P, Ye G, Gao P, Lu X, et al. Metabolic characterization of hepatocellular carcinoma using nontargeted tissue metabolomics. Cancer Res. 2013;73:4992–5002. [DOI] [PubMed] [Google Scholar]
- 75.Mossmann D, Park S, Hall MN. mTOR signalling and cellular metabolism are mutual determinants in cancer. Nat Rev Cancer. 2018;18:744–57. [DOI] [PubMed] [Google Scholar]
- 76.Fan H, Wu Y, Yu S, Li X, Wang A, Wang S, et al. Critical role of mTOR in regulating aerobic glycolysis in carcinogenesis (Review). Int J Oncol. 2021;58:9–19. [DOI] [PubMed] [Google Scholar]
- 77.Amann T, Maegdefrau U, Hartmann A, Agaimy A, Marienhagen J, Weiss TS, et al. GLUT1 expression is increased in hepatocellular carcinoma and promotes tumorigenesis. Am J Pathol. 2009;174:1544–52. [DOI] [PMC free article] [PubMed] [Google Scholar]
- 78.Sun HW, Yu XJ, Wu WC, Chen J, Shi M, Zheng L, et al. GLUT1 and ASCT2 as predictors for prognosis of hepatocellular carcinoma. PLoS One. 2016;11:e0168907. [DOI] [PMC free article] [PubMed] [Google Scholar]
- 79.Paudyal B, Paudyal P, Oriuchi N, Tsushima Y, Nakajima T, Endo K. Clinical implication of glucose transport and metabolism evaluated by 18F-FDG PET in hepatocellular carcinoma. Int J Oncol. 2008;33:1047–54. [PubMed] [Google Scholar]
- 80.DeWaal D, Nogueira V, Terry AR, Patra KC, Jeon SM, Guzman G, et al. Hexokinase-2 depletion inhibits glycolysis and induces oxidative phosphorylation in hepatocellular carcinoma and sensitizes to metformin. Nat Commun. 2018;9:446. [DOI] [PMC free article] [PubMed] [Google Scholar]
- 81.Guzman G, Chennuri R, Chan A, Rea B, Quintana A, Patel R, et al. Evidence for heightened hexokinase II immunoexpression in hepatocyte dysplasia and hepatocellular carcinoma. Dig Dis Sci. 2015;60:420–6. [DOI] [PMC free article] [PubMed] [Google Scholar]
- 82.Chai F, Li Y, Liu K, Li Q, Sun H. Caveolin enhances hepatocellular carcinoma cell metabolism, migration, and invasion in vitro via a hexokinase 2-dependent mechanism. J Cell Physiol. 2019;234:1937–46. [DOI] [PubMed] [Google Scholar]
- 83.Chen Z, Lu X, Wang Z, Jin G, Wang Q, Chen D, et al. Co-expression of PKM2 and TRIM35 predicts survival and recurrence in hepatocellular carcinoma. Oncotarget. 2015;6:2538–48. [DOI] [PMC free article] [PubMed] [Google Scholar]
- 84.Chen Z, Wang Z, Guo W, Zhang Z, Zhao F, Zhao Y, et al. TRIM35 Interacts with pyruvate kinase isoform M2 to suppress the Warburg effect and tumorigenicity in hepatocellular carcinoma. Oncogene. 2015;34:3946–56. [DOI] [PubMed] [Google Scholar]
- 85.Dayton TL, Gocheva V, Miller KM, Israelsen WJ, Bhutkar A, Clish CB, et al. Germline loss of PKM2 promotes metabolic distress and hepatocellular carcinoma. Genes Dev. 2016;30:1020–33. [DOI] [PMC free article] [PubMed] [Google Scholar]
- 86.Wang ZX, Jiang CP, Cao Y, Zhang G, Chen WB, Ding YT. Preoperative serum liver enzyme markers for predicting early recurrence after curative resection of hepatocellular carcinoma. Hepatobiliary Pancreat Dis Int. 2015;14:178–85. [DOI] [PubMed] [Google Scholar]
- 87.Faloppi L, Scartozzi M, Bianconi M, Svegliati Baroni G, Toniutto P, Giampieri R, et al. The role of LDH serum levels in predicting global outcome in HCC patients treated with sorafenib: implications for clinical management. BMC Cancer. 2014;14:110. [DOI] [PMC free article] [PubMed] [Google Scholar]
- 88.Lu M, Lu L, Dong Q, Yu G, Chen J, Qin L, et al. Elevated G6PD expression contributes to migration and invasion of hepatocellular carcinoma cells by inducing epithelial-mesenchymal transition. Acta Biochim Biophys Sin (Shanghai). 2018;50:370–80. [DOI] [PubMed] [Google Scholar]
- 89.Kowalik MA, Guzzo G, Morandi A, Perra A, Menegon S, Masgras I, et al. Metabolic reprogramming identifies the most aggressive lesions at early phases of hepatic carcinogenesis. Oncotarget. 2016;7:32375–93. [DOI] [PMC free article] [PubMed] [Google Scholar]
- 90.Yin X, Tang B, Li JH, Wang Y, Zhang L, Xie XY, et al. ID1 promotes hepatocellular carcinoma proliferation and confers chemoresistance to oxaliplatin by activating pentose phosphate pathway. J Exp Clin Cancer Res. 2017;36:166. [DOI] [PMC free article] [PubMed] [Google Scholar]
- 91.Zhu Q, Zhou L, Yang Z, Lai M, Xie H, Wu L, et al. O-GlcNAcylation plays a role in tumor recurrence of hepatocellular carcinoma following liver transplantation. Med Oncol. 2012;29:985–93. [DOI] [PubMed] [Google Scholar]
- 92.Phoomak C, Vaeteewoottacharn K, Silsirivanit A, Saengboonmee C, Seubwai W, Sawanyawisuth K, et al. High glucose levels boost the aggressiveness of highly metastatic cholangiocarcinoma cells via O-GlcNAcylation. Sci Rep. 2017;7:43842. [DOI] [PMC free article] [PubMed] [Google Scholar]
- 93.Izuishi K, Yamamoto Y, Mori H, Kameyama R, Fujihara S, Masaki T, et al. Molecular mechanisms of [18F]fluorodeoxyglucose accumulation in liver cancer. Oncol Rep. 2014;31:701–6. [DOI] [PubMed] [Google Scholar]
- 94.Paudyal B, Oriuchi N, Paudyal P, Tsushima Y, Iida Y, Higuchi T, et al. Early diagnosis of recurrent hepatocellular carcinoma with 18F-FDG PET after radiofrequency ablation therapy. Oncol Rep. 2007;18:1469–73. [PubMed] [Google Scholar]
- 95.Kiefer LS, Sekler J, Guckel B, Kraus MS, la Fougere C, Nikolaou K, et al. Impact of (18)F-FDG-PET/CT on clinical management in patients with cholangiocellular carcinoma. BJR Open. 2021;3:20210008. [DOI] [PMC free article] [PubMed] [Google Scholar]
- 96.Hwang JP, Moon JH, Kim HK, Lee MH, Lim CH, Park SB, et al. Prognostic value of metabolic parameters measured by pretreatment dual-time-point 18F-fluorodeoxyglucose positron emission tomography/computed tomography in patients with intrahepatic or perihilar cholangiocarcinoma: a STROBE study. Medicine (Baltimore). 2021;100:e26015. [DOI] [PMC free article] [PubMed] [Google Scholar]
- 97.Kubo Y, Aishima S, Tanaka Y, Shindo K, Mizuuchi Y, Abe K, et al. Different expression of glucose transporters in the progression of intrahepatic cholangiocarcinoma. Hum Pathol. 2014;45:1610–7. [DOI] [PubMed] [Google Scholar]
- 98.Suzuki H, Komuta M, Bolog A, Yokobori T, Wada S, Araki K, et al. Relationship between 18-F-fluoro-deoxy-D-glucose uptake and expression of glucose transporter 1 and pyruvate kinase M2 in intrahepatic cholangiocarcinoma. Dig Liver Dis. 2015;47:590–6. [DOI] [PubMed] [Google Scholar]
- 99.Kudo Y, Tanaka Y, Tateishi K, Yamamoto K, Yamamoto S, Mohri D, et al. Altered composition of fatty acids exacerbates hepatotumorigenesis during activation of the phosphatidylinositol 3-kinase pathway. J Hepatol. 2011;55:1400–8. [DOI] [PubMed] [Google Scholar]
- 100.Thamrongwaranggoon U, Seubwai W, Phoomak C, Sangkhamanon S, Cha’on U, Boonmars T, et al. Targeting hexokinase II as a possible therapy for cholangiocarcinoma. Biochem Biophys Res Commun. 2017;484:409–15. [DOI] [PubMed] [Google Scholar]
- 101.Dhar DK, Olde Damink SW, Brindley JH, Godfrey A, Chapman MH, Sandanayake NS, et al. Pyruvate kinase M2 is a novel diagnostic marker and predicts tumor progression in human biliary tract cancer. Cancer. 2013;119:575–85. [DOI] [PMC free article] [PubMed] [Google Scholar]
- 102.Yu G, Yu W, Jin G, Xu D, Chen Y, Xia T, et al. PKM2 regulates neural invasion of and predicts poor prognosis for human hilar cholangiocarcinoma. Mol Cancer. 2015;14:193. [DOI] [PMC free article] [PubMed] [Google Scholar]
- 103.Faloppi L, Del Prete M, Casadei Gardini A, Santini D, Silvestris N, Bianconi M, et al. The correlation between LDH serum levels and clinical outcome in advanced biliary tract cancer patients treated with first line chemotherapy. Sci Rep. 2016;6:24136. [DOI] [PMC free article] [PubMed] [Google Scholar]
- 104.Guan L, Zhang L, Gong Z, Hou X, Xu Y, Feng X, et al. FoxO3 inactivation promotes human cholangiocarcinoma tumorigenesis and chemoresistance through Keap1-Nrf2 signaling. Hepatology. 2016;63:1914–27. [DOI] [PubMed] [Google Scholar]
- 105.Qu X, Sheng J, Shen L, Su J, Xu Y, Xie Q, et al. Autophagy inhibitor chloroquine increases sensitivity to cisplatin in QBC939 cholangiocarcinoma cells by mitochondrial ROS. PLoS One. 2017;12:e0173712. [DOI] [PMC free article] [PubMed] [Google Scholar]
- 106.Phoomak C, Silsirivanit A, Wongkham C, Sripa B, Puapairoj A, Wongkham S. Overexpression of O-GlcNAc-transferase associates with aggressiveness of mass-forming cholangiocarcinoma. Asian Pac J Cancer Prev. 2012;13(suppl):101–5. [PubMed] [Google Scholar]
- 107.Budhu A, Roessler S, Zhao X, Yu Z, Forgues M, Ji J, et al. Integrated metabolite and gene expression profiles identify lipid biomarkers associated with progression of hepatocellular carcinoma and patient outcomes. Gastroenterology. 2013;144:1066–75 e1061. [DOI] [PMC free article] [PubMed] [Google Scholar]
- 108.Pollard PJ, Wortham NC, Tomlinson IP. The TCA cycle and tumorigenesis: the examples of fumarate hydratase and succinate dehydrogenase. Ann Med. 2003;35:632–9. [DOI] [PubMed] [Google Scholar]
- 109.Tseng PL, Wu WH, Hu TH, Chen CW, Cheng HC, Li CF, et al. Decreased succinate dehydrogenase B in human hepatocellular carcinoma accelerates tumor malignancy by inducing the Warburg effect. Sci Rep. 2018;8:3081. [DOI] [PMC free article] [PubMed] [Google Scholar]
- 110.Murakami Y, Kubo S, Tamori A, Itami S, Kawamura E, Iwaisako K, et al. Comprehensive analysis of transcriptome and metabolome analysis in intrahepatic cholangiocarcinoma and hepatocellular carcinoma. Sci Rep. 2015;5:16294. [DOI] [PMC free article] [PubMed] [Google Scholar]
- 111.Sanmai S, Proungvitaya T, Limpaiboon T, Chua-On D, Seubwai W, Roytrakul S, et al. Serum pyruvate dehydrogenase kinase as a prognostic marker for cholangiocarcinoma. Oncol Lett. 2019;17:5275–82. [DOI] [PMC free article] [PubMed] [Google Scholar]
- 112.Xu L, Li Y, Zhou L, Dorfman RG, Liu L, Cai R, et al. SIRT3 elicited an anti-Warburg effect through HIF1alpha/PDK1/PDHA1 to inhibit cholangiocarcinoma tumorigenesis. Cancer Med. 2019;8:2380–91. [DOI] [PMC free article] [PubMed] [Google Scholar]
- 113.Nepal C, O’Rourke CJ, Oliveira D, Taranta A, Shema S, Gautam P, et al. Genomic perturbations reveal distinct regulatory networks in intrahepatic cholangiocarcinoma. Hepatology. 2018;68:949–63. [DOI] [PMC free article] [PubMed] [Google Scholar]
- 114.Farshidfar F, Zheng S, Gingras MC, Newton Y, Shih J, Robertson AG, et al. Integrative genomic analysis of cholangiocarcinoma identifies distinct idh-mutant molecular profiles. Cell Rep. 2017;19:2878–80. [DOI] [PMC free article] [PubMed] [Google Scholar]
- 115.Wang P, Dong Q, Zhang C, Kuan PF, Liu Y, Jeck WR, et al. Mutations in isocitrate dehydrogenase 1 and 2 occur frequently in intrahepatic cholangiocarcinomas and share hypermethylation targets with glioblastomas. Oncogene. 2013;32:3091–100. [DOI] [PMC free article] [PubMed] [Google Scholar]
- 116.Jusakul A, Cutcutache I, Yong CH, Lim JQ, Huang MN, Padmanabhan N, et al. Whole-genome and epigenomic landscapes of etiologically distinct subtypes of cholangiocarcinoma. Cancer Discov. 2017;7:1116–35. [DOI] [PMC free article] [PubMed] [Google Scholar]
- 117.Goyal L, Govindan A, Sheth RA, Nardi V, Blaszkowsky LS, Faris JE, et al. Prognosis and clinicopathologic features of patients with advanced stage isocitrate dehydrogenase (IDH) mutant and IDH wild-type intrahepatic cholangiocarcinoma. Oncologist. 2015;20:1019–27. [DOI] [PMC free article] [PubMed] [Google Scholar]
- 118.Zhu AX, Borger DR, Kim Y, Cosgrove D, Ejaz A, Alexandrescu S, et al. Genomic profiling of intrahepatic cholangiocarcinoma: refining prognosis and identifying therapeutic targets. Ann Surg Oncol. 2014;21:3827–34. [DOI] [PMC free article] [PubMed] [Google Scholar]
- 119.Senni N, Savall M, Cabrerizo Granados D, Alves-Guerra MC, Sartor C, Lagoutte I, et al. Beta-catenin-activated hepatocellular carcinomas are addicted to fatty acids. Gut. 2019;68:322–34. [DOI] [PubMed] [Google Scholar]
- 120.Fujiwara N, Nakagawa H, Enooku K, Kudo Y, Hayata Y, Nakatsuka T, et al. CPT2 downregulation adapts HCC to lipid-rich environment and promotes carcinogenesis via acylcarnitine accumulation in obesity. Gut. 2018;67:1493–504. [DOI] [PMC free article] [PubMed] [Google Scholar]
- 121.Lin M, Lv D, Zheng Y, Wu M, Xu C, Zhang Q, et al. Downregulation of CPT2 promotes tumorigenesis and chemoresistance to cisplatin in hepatocellular carcinoma. Onco Targets Ther. 2018;11:3101–10. [DOI] [PMC free article] [PubMed] [Google Scholar]
- 122.Lo Re O, Douet J, Buschbeck M, Fusilli C, Pazienza V, Panebianco C, et al. Histone variant macroH2A1 rewires carbohydrate and lipid metabolism of hepatocellular carcinoma cells towards cancer stem cells. Epigenetics. 2018;13:829–45. [DOI] [PMC free article] [PubMed] [Google Scholar]
- 123.Li Y, Xu S, Li J, Zheng L, Feng M, Wang X, et al. SIRT1 facilitates hepatocellular carcinoma metastasis by promoting PGC-1alpha-mediated mitochondrial biogenesis. Oncotarget. 2016;7:29255–74. [DOI] [PMC free article] [PubMed] [Google Scholar]
- 124.Soukupova J, Malfettone A, Bertran E, Hernandez-Alvarez MI, Penuelas-Haro I, Dituri F, et al. Epithelial-mesenchymal transition (EMT) Induced by TGF-beta in hepatocellular carcinoma cells reprograms lipid metabolism. Int J Mol Sci. 2021;22:5543. [DOI] [PMC free article] [PubMed] [Google Scholar]
- 125.Dan L, Wang C, Ma P, Yu Q, Gu M, Dong L, et al. PGC1alpha promotes cholangiocarcinoma metastasis by upregulating PDHA1 and MPC1 expression to reverse the Warburg effect. Cell Death Dis. 2018;9:466. [DOI] [PMC free article] [PubMed] [Google Scholar]
- 126.Raggi C, Taddei ML, Sacco E, Navari N, Correnti M, Piombanti B, et al. Mitochondrial oxidative metabolism contributes to a cancer stem cell phenotype in cholangiocarcinoma. J Hepatol. 2021;74:1373–85. [DOI] [PubMed] [Google Scholar]
- 127.Nakagawa H, Hayata Y, Kawamura S, Yamada T, Fujiwara N, Koike K. Lipid metabolic reprogramming in hepatocellular carcinoma. Cancers (Basel). 2018;10:447. [DOI] [PMC free article] [PubMed] [Google Scholar]
- 128.Tohme S, Yazdani HO, Liu Y, Loughran P, van der Windt DJ, Huang H, et al. Hypoxia mediates mitochondrial biogenesis in hepatocellular carcinoma to promote tumor growth through HMGB1 and TLR9 interaction. Hepatology. 2017;66:182–97. [DOI] [PMC free article] [PubMed] [Google Scholar]
- 129.Liu R, Zhang H, Zhang Y, Li S, Wang X, Wang X, et al. Peroxisome proliferator-activated receptor gamma coactivator-1 alpha acts as a tumor suppressor in hepatocellular carcinoma. Tumour Biol. 2017;39:1010428317695031. [DOI] [PubMed] [Google Scholar]
- 130.Huang Li T, Li X, Zhang L, Sun L, He X, Zhong X, et al. HIF-1-mediated suppression of acyl-CoA dehydrogenases and fatty acid oxidation is critical for cancer progression. Cell Rep. 2014;8:1930–42. [DOI] [PubMed] [Google Scholar]
- 131.Bjornson E, Mukhopadhyay B, Asplund A, Pristovsek N, Cinar R, Romeo S, et al. Stratification of hepatocellular carcinoma patients based on acetate utilization. Cell Rep. 2015;13:2014–26. [DOI] [PubMed] [Google Scholar]
- 132.Wang MD, Wu H, Fu GB, Zhang HL, Zhou X, Tang L, et al. Acetyl-coenzyme A carboxylase alpha promotion of glucose-mediated fatty acid synthesis enhances survival of hepatocellular carcinoma in mice and patients. Hepatology. 2016;63:1272–86. [DOI] [PubMed] [Google Scholar]
- 133.Calvisi DF, Wang C, Ho C, Ladu S, Lee SA, Mattu S, et al. Increased lipogenesis, induced by AKT-mTORC1-RPS6 signaling, promotes development of human hepatocellular carcinoma. Gastroenterology. 2011;140:1071–83. [DOI] [PMC free article] [PubMed] [Google Scholar]
- 134.Lai KKY, Kweon SM, Chi F, Hwang E, Kabe Y, Higashiyama R, et al. Stearoyl-CoA desaturase promotes liver fibrosis and tumor development in mice via a Wnt positive-signaling loop by stabilization of low-density lipoprotein-receptor-related proteins 5 and 6. Gastroenterology. 2017;152:1477–91. [DOI] [PMC free article] [PubMed] [Google Scholar]
- 135.Yamashita T, Honda M, Takatori H, Nishino R, Minato H, Takamura H, et al. Activation of lipogenic pathway correlates with cell proliferation and poor prognosis in hepatocellular carcinoma. J Hepatol. 2009;50:100–10. [DOI] [PubMed] [Google Scholar]
- 136.Li L, Che L, Tharp KM, Park HM, Pilo MG, Cao D, et al. Differential requirement for de novo lipogenesis in cholangiocarcinoma and hepatocellular carcinoma of mice and humans. Hepatology. 2016;63:1900–13. [DOI] [PMC free article] [PubMed] [Google Scholar]
- 137.Ruiz de Gauna M, Biancaniello F, González-Romero F, Rodrigues PM, Lapitz A, Gómez-Santos B, et al. Cholangiocarcinoma progression depends on the uptake and metabolization of extracellular lipids. Hepatology. 2022;76:1617–33. [DOI] [PMC free article] [PubMed] [Google Scholar]
- 138.Padthaisong S, Phetcharaburanin J, Klanrit P, Li JV, Namwat N, Khuntikeo N, et al. Integration of global metabolomics and lipidomics approaches reveals the molecular mechanisms and the potential biomarkers for postoperative recurrence in early-stage cholangiocarcinoma. Cancer Metab. 2021;9:30. [DOI] [PMC free article] [PubMed] [Google Scholar]
- 139.Tomacha J, Dokduang H, Padthaisong S, Namwat N, Klanrit P, Phetcharaburanin J, et al. Targeting fatty acid synthase modulates metabolic pathways and inhibits cholangiocarcinoma cell progression. Front Pharmacol. 2021;12:696961. [DOI] [PMC free article] [PubMed] [Google Scholar]
- 140.Raggi C, Taddei ML, Rae C, Braconi C, Marra F. Metabolic reprogramming in cholangiocarcinoma. J Hepatol. 2022;77:849–64. [DOI] [PubMed] [Google Scholar]
- 141.Wang F, Wu Z. Sphingosine kinase 1 overexpression is associated with poor prognosis and oxaliplatin resistance in hepatocellular carcinoma. Exp Ther Med. 2018;15:5371–6. [DOI] [PMC free article] [PubMed] [Google Scholar]
- 142.Chen MH, Yen CC, Cheng CT, Wu RC, Huang SC, Yu CS, et al. Identification of SPHK1 as a therapeutic target and marker of poor prognosis in cholangiocarcinoma. Oncotarget. 2015;6:23594–608. [DOI] [PMC free article] [PubMed] [Google Scholar]
- 143.Shi W, Zhang S, Ma D, Yan D, Zhang G, Cao Y, et al. Targeting SphK2 reverses acquired resistance of regorafenib in hepatocellular carcinoma. Front Oncol. 2020;10:694. [DOI] [PMC free article] [PubMed] [Google Scholar]
- 144.Tang L, Zeng J, Geng P, Fang C, Wang Y, Sun M, et al. Global metabolic profiling identifies a pivotal role of proline and hydroxyproline metabolism in supporting hypoxic response in hepatocellular carcinoma. Clin Cancer Res. 2018;24:474–85. [DOI] [PubMed] [Google Scholar]
- 145.Tardito S, Chiu M, Uggeri J, Zerbini A, Da Ros F, Dall’Asta V, et al. L-Asparaginase and inhibitors of glutamine synthetase disclose glutamine addiction of beta-catenin-mutated human hepatocellular carcinoma cells. Curr Cancer Drug Targets. 2011;11:929–43. [DOI] [PubMed] [Google Scholar]
- 146.Di Tommaso L, Franchi G, Park YN, Fiamengo B, Destro A, Morenghi E, et al. Diagnostic value of HSP70, glypican 3, and glutamine synthetase in hepatocellular nodules in cirrhosis. Hepatology. 2007;45:725–34. [DOI] [PubMed] [Google Scholar]
- 147.Sohn BH, Park IY, Shin JH, Yim SY, Lee JS. Glutamine synthetase mediates sorafenib sensitivity in beta-catenin-active hepatocellular carcinoma cells. Exp Mol Med. 2018;50:e421. [DOI] [PMC free article] [PubMed] [Google Scholar]
- 148.Xi J, Sun Y, Zhang M, Fa Z, Wan Y, Min Z, et al. GLS1 promotes proliferation in hepatocellular carcinoma cells via AKT/ GSK3beta/CyclinD1 pathway. Exp Cell Res. 2019;381:1–9. [DOI] [PubMed] [Google Scholar]
- 149.Zhang B, Dong LW, Tan YX, Zhang J, Pan YF, Yang C, et al. Asparagine synthetase is an independent predictor of surgical survival and a potential therapeutic target in hepatocellular carcinoma. Br J Cancer. 2013;109:14–23. [DOI] [PMC free article] [PubMed] [Google Scholar]
- 150.Wappler J, Arts M, Roth A, Heeren RMA, Peter Neumann U, Olde Damink SW, et al. Glutamine deprivation counteracts hypoxia-induced chemoresistance. Neoplasia. 2020;22:22–32. [DOI] [PMC free article] [PubMed] [Google Scholar]
- 151.Yang H, Zhang MZ, Sun HW, Chai YT, Li X, Jiang Q, et al. A novel microcrystalline BAY-876 formulation achieves long-acting antitumor activity against aerobic glycolysis and proliferation of hepatocellular carcinoma. Front Oncol. 2021;11:783194. [DOI] [PMC free article] [PubMed] [Google Scholar]
- 152.Liu YX, Feng JY, Sun MM, Liu BW, Yang G, Bu YN, et al. Aspirin inhibits the proliferation of hepatoma cells through controlling GLUT1-mediated glucose metabolism. Acta Pharmacol Sin. 2019;40:122–32. [DOI] [PMC free article] [PubMed] [Google Scholar]
- 153.Ricciotti E, Wangensteen KJ, FitzGerald GA. Aspirin in hepatocellular carcinoma. Cancer Res. 2021;81:3751–61. [DOI] [PMC free article] [PubMed] [Google Scholar]
- 154.Petrick JL, Sahasrabuddhe VV, Chan AT, Alavanja MC, Beane-Freeman LE, Buring JE, et al. NSAID use and risk of hepatocellular carcinoma and intrahepatic cholangiocarcinoma: The Liver Cancer Pooling Project. Cancer Prev Res (Phila). 2015;8:1156–62. [DOI] [PMC free article] [PubMed] [Google Scholar]
- 155.Tomizawa M, Shinozaki F, Motoyoshi Y, Sugiyama T, Yamamoto S, Ishige N. 2-Deoxyglucose and sorafenib synergistically suppress the proliferation and motility of hepatocellular carcinoma cells. Oncol Lett. 2017;13:800–4. [DOI] [PMC free article] [PubMed] [Google Scholar]
- 156.Wang L, Yang Q, Peng S, Liu X. The combination of the glycolysis inhibitor 2-DG and sorafenib can be effective against sorafenib-tolerant persister cancer cells. Onco Targets Ther. 2019;12:5359–73. [DOI] [PMC free article] [PubMed] [Google Scholar]
- 157.Dai W, Wang F, Lu J, Xia Y, He L, Chen K, et al. By reducing hexokinase 2, resveratrol induces apoptosis in HCC cells addicted to aerobic glycolysis and inhibits tumor growth in mice. Oncotarget. 2015;6:13703–17. [DOI] [PMC free article] [PubMed] [Google Scholar]
- 158.Duvoux C, Toso C. mTOR inhibitor therapy: does it prevent HCC recurrence after liver transplantation? Transplant Rev (Orlando). 2015;29:168–74. [DOI] [PubMed] [Google Scholar]
- 159.Shen YC, Ou DL, Hsu C, Lin KL, Chang CY, Lin CY, et al. Activating oxidative phosphorylation by a pyruvate dehydrogenase kinase inhibitor overcomes sorafenib resistance of hepatocellular carcinoma. Br J Cancer. 2013;108:72–81. [DOI] [PMC free article] [PubMed] [Google Scholar]
- 160.Kamisuki S, Mao Q, Abu-Elheiga L, Gu Z, Kugimiya A, Kwon Y, et al. A small molecule that blocks fat synthesis by inhibiting the activation of SREBP. Chem Biol. 2009;16:882–92. [DOI] [PubMed] [Google Scholar]
- 161.Chen M, Zhang J, Sampieri K, Clohessy JG, Mendez L, Gonzalez-Billalabeitia E, et al. An aberrant SREBP-dependent lipogenic program promotes metastatic prostate cancer. Nat Genet. 2018;50:206–18. [DOI] [PMC free article] [PubMed] [Google Scholar]
- 162.Kamisuki S, Shirakawa T, Kugimiya A, Abu-Elheiga L, Choo HY, Yamada K, et al. Synthesis and evaluation of diarylthiazole derivatives that inhibit activation of sterol regulatory element-binding proteins. J Med Chem. 2011;54:4923–7. [DOI] [PMC free article] [PubMed] [Google Scholar]
- 163.Williams KJ, Argus JP, Zhu Y, Wilks MQ, Marbois BN, York AG, et al. An essential requirement for the SCAP/SREBP signaling axis to protect cancer cells from lipotoxicity. Cancer Res. 2013;73:2850–62. [DOI] [PMC free article] [PubMed] [Google Scholar]
- 164.Wang H, Zhou Y, Xu H, Wang X, Zhang Y, Shang R, et al. Therapeutic efficacy of FASN inhibition in preclinical models of HCC. Hepatology. 2022;76:951–66. [DOI] [PMC free article] [PubMed] [Google Scholar]
- 165.Lally JSV, Ghoshal S, DePeralta DK, Moaven O, Wei L, Masia R, et al. Inhibition of acetyl-CoA carboxylase by phosphorylation or the inhibitor ND-654 suppresses lipogenesis and hepatocellular carcinoma. Cell Metab. 2019;29:174–182 e175. [DOI] [PMC free article] [PubMed] [Google Scholar]
- 166.Fritz V, Benfodda Z, Rodier G, Henriquet C, Iborra F, Avances C, et al. Abrogation of de novo lipogenesis by stearoyl-CoA desaturase 1 inhibition interferes with oncogenic signaling and blocks prostate cancer progression in mice. Mol Cancer Ther. 2010;9:1740–54. [DOI] [PMC free article] [PubMed] [Google Scholar]
- 167.Buranrat B, Senggunprai L, Prawan A, Kukongviriyapan V. Simvastatin and atorvastatin as inhibitors of proliferation and inducers of apoptosis in human cholangiocarcinoma cells. Life Sci. 2016;153:41–9. [DOI] [PubMed] [Google Scholar]
- 168.Kawata S, Yamasaki E, Nagase T, Inui Y, Ito N, Matsuda Y, et al. Effect of pravastatin on survival in patients with advanced hepatocellular carcinoma. A randomized controlled trial. Br J Cancer. 2001;84:886–91. [DOI] [PMC free article] [PubMed] [Google Scholar]
- 169.Jouve JL, Lecomte T, Bouche O, Barbier E, Khemissa Akouz F, Riachi G, et al. Pravastatin combination with sorafenib does not improve survival in advanced hepatocellular carcinoma. J Hepatol. 2019;71:516–22. [DOI] [PubMed] [Google Scholar]
- 170.Jin H, Wang S, Zaal EA, Wang C, Wu H, Bosma A, et al. A powerful drug combination strategy targeting glutamine addiction for the treatment of human liver cancer. Elife. 2020;9:e56749. [DOI] [PMC free article] [PubMed] [Google Scholar]
- 171.Chiu M, Tardito S, Pillozzi S, Arcangeli A, Armento A, Uggeri J, et al. Glutamine depletion by crisantaspase hinders the growth of human hepatocellular carcinoma xenografts. Br J Cancer. 2014;111:1159–67. [DOI] [PMC free article] [PubMed] [Google Scholar]
- 172.Campbell PT, Newton CC, Freedman ND, Koshiol J, Alavanja MC, Beane Freeman LE, et al. Body mass index, waist circumference, diabetes, and risk of liver cancer for US adults. Cancer Res. 2016;76:6076–83. [DOI] [PMC free article] [PubMed] [Google Scholar]
- 173.Gupta A, Das A, Majumder K, Arora N, Mayo HG, Singh PP, et al. Obesity is independently associated with increased risk of hepatocellular cancer-related mortality: a systematic review and meta-analysis. Am J Clin Oncol. 2018;41:874–81. [DOI] [PMC free article] [PubMed] [Google Scholar]
- 174.Mittal B Subcutaneous adipose tissue & visceral adipose tissue. Indian J Med Res. 2019;149:571–3. [DOI] [PMC free article] [PubMed] [Google Scholar]
- 175.Marchesini G, Petroni ML, Cortez-Pinto H. Adipose tissue-associated cancer risk: is it the fat around the liver, or the fat inside the liver? J Hepatol. 2019;71:1073–5. [DOI] [PubMed] [Google Scholar]
- 176.Allen AM, Hicks SB, Mara KC, Larson JJ, Therneau TM. The risk of incident extrahepatic cancers is higher in non-alcoholic fatty liver disease than obesity—a longitudinal cohort study. J Hepatol. 2019;71:1229–36. [DOI] [PMC free article] [PubMed] [Google Scholar]
- 177.Kim GA, Lee HC, Choe J, Kim MJ, Lee MJ, Chang HS, et al. Association between non-alcoholic fatty liver disease and cancer incidence rate. J Hepatol. 2018;68:140–146. doi: 10.1016/j.jhep.2017.09.012 [DOI] [PubMed] [Google Scholar]
- 178.Zoller H, Tilg H. Nonalcoholic fatty liver disease and hepatocellular carcinoma. Metabolism. 2016;65:1151–60. [DOI] [PubMed] [Google Scholar]
- 179.Bozaykut P, Sahin A, Karademir B, Ozer NK. Endoplasmic reticulum stress related molecular mechanisms in nonalcoholic steatohepatitis. Mech Ageing Dev. 2016;157:17–29. [DOI] [PubMed] [Google Scholar]
- 180.Novo E, Parola M. Redox mechanisms in hepatic chronic wound healing and fibrogenesis. Fibrogenesis Tissue Repair. 2008;1:5. [DOI] [PMC free article] [PubMed] [Google Scholar]
- 181.Kutlu O, Kaleli HN, Ozer E. Molecular pathogenesis of nonalcoholic steatohepatitis-(NASH-) related hepatocellular carcinoma. Can J Gastroenterol Hepatol. 2018;2018:8543763. [DOI] [PMC free article] [PubMed] [Google Scholar]
- 182.Bence KK, Birnbaum MJ. Metabolic drivers of non-alcoholic fatty liver disease. Mol Metab. 2021;50:101143. [DOI] [PMC free article] [PubMed] [Google Scholar]
- 183.de Groot S, Pijl H, van der Hoeven JJM, Kroep JR. Effects of short-term fasting on cancer treatment. J Exp Clin Cancer Res. 2019;38:209. [DOI] [PMC free article] [PubMed] [Google Scholar]
- 184.Rocha NS, Barbisan LF, de Oliveira ML, de Camargo JL. Effects of fasting and intermittent fasting on rat hepatocarcinogenesis induced by diethylnitrosamine. Teratog Carcinog Mutagen. 2002;22:129–38. [DOI] [PubMed] [Google Scholar]
- 185.Hikita H, Vaughan J, Pitot HC. The effect of two periods of short-term fasting during the promotion stage of hepatocarcinogenesis in rats: the role of apoptosis and cell proliferation. Carcinogenesis. 1997;18:159–66. [DOI] [PubMed] [Google Scholar]
- 186.Tomasi C, Laconi E, Laconi S, Greco M, Sarma DS, Pani P. Effect of fasting/refeeding on the incidence of chemically induced hepatocellular carcinoma in the rat. Carcinogenesis. 1999;20:1979–83. [DOI] [PubMed] [Google Scholar]
- 187.Tessitore L Hepatocellular carcinoma is induced by a subnecrogenic dose of diethylnitrosamine in previously fastedrefed rats. Nutr Cancer. 1998;32:49–54. [DOI] [PubMed] [Google Scholar]
- 188.Stine ZE, Schug ZT, Salvino JM, Dang CV. Targeting cancer metabolism in the era of precision oncology. Nat Rev Drug Discov. 2022;21:141–62. [DOI] [PMC free article] [PubMed] [Google Scholar]
- 189.Vander Heiden MG. Targeting cancer metabolism: a therapeutic window opens. Nat Rev Drug Discov. 2011;10:671–84. [DOI] [PubMed] [Google Scholar]
- 190.Shang R, Wang M, Dai B, Du J, Wang J, Liu Z, et al. Long noncoding RNA SLC2A1-AS1 regulates aerobic glycolysis and progression in hepatocellular carcinoma via inhibiting the STAT3/FOXM1/GLUT1 pathway. Mol Oncol. 2020;14:1381–96. [DOI] [PMC free article] [PubMed] [Google Scholar]
- 191.Chen H, Wu Q, Peng L, Cao T, Deng M-L, Liu Y-W, et al. Mechanism, clinical significance, and treatment strategy of Warburg effect in hepatocellular carcinoma. J Nanomater. 2021;2021:5164100. [Google Scholar]
- 192.Sheng SL, Liu JJ, Dai YH, Sun XG, Xiong XP, Huang G. Knockdown of lactate dehydrogenase A suppresses tumor growth and metastasis of human hepatocellular carcinoma. FEBS J. 2012;279:3898–910. [DOI] [PubMed] [Google Scholar]
- 193.Gao HJ, Zhao MC, Zhang YJ, Zhou DS, Xu L, Li GB, et al. Monocarboxylate transporter 4 predicts poor prognosis in hepatocellular carcinoma and is associated with cell proliferation and migration. J Cancer Res Clin Oncol. 2015;141:1151–62. [DOI] [PubMed] [Google Scholar]
- 194.Cheng J, Huang T, Li Y, Guo Y, Zhu Y, Wang Q, et al. AMP-activated protein kinase suppresses the in vitro and in vivo proliferation of hepatocellular carcinoma. PLoS One. 2014;9:e93256. [DOI] [PMC free article] [PubMed] [Google Scholar]
- 195.Ferretti AC, Hidalgo F, Tonucci FM, Almada E, Pariani A, Larocca MC, et al. Metformin and glucose starvation decrease the migratory ability of hepatocellular carcinoma cells: targeting AMPK activation to control migration. Sci Rep. 2019;9:2815. [DOI] [PMC free article] [PubMed] [Google Scholar]
- 196.Kaewpitoon SJ, Loyd RA, Rujirakul R, Panpimanmas S, Matrakool L, Tongtawee T, et al. Benefits of metformin use for cholangiocarcinoma. Asian Pac J Cancer Prev. 2015;16:8079–83. [DOI] [PubMed] [Google Scholar]
- 197.Molenaar RJ, Coelen RJS, Khurshed M, Roos E, Caan MWA, van Linde ME, et al. Study protocol of a phase IB/II clinical trial of metformin and chloroquine in patients with IDH1-mutated or IDH2-mutated solid tumours. BMJ Open. 2017;7:e014961. [DOI] [PMC free article] [PubMed] [Google Scholar]
- 198.Che L, Pilo MG, Cigliano A, Latte G, Simile MM, Ribback S, et al. Oncogene dependent requirement of fatty acid synthase in hepatocellular carcinoma. Cell Cycle. 2017;16:499–507. [DOI] [PMC free article] [PubMed] [Google Scholar]
- 199.Nelson ME, Lahiri S, Chow JD, Byrne FL, Hargett SR, Breen DS, et al. Inhibition of hepatic lipogenesis enhances liver tumorigenesis by increasing antioxidant defence and promoting cell survival. Nat Commun. 2017;8:14689. [DOI] [PMC free article] [PubMed] [Google Scholar]
- 200.von Roemeling CA, Marlow LA, Wei JJ, Cooper SJ, Caulfield TR, Wu K, et al. Stearoyl-CoA desaturase 1 is a novel molecular therapeutic target for clear cell renal cell carcinoma. Clin Cancer Res. 2013;19:2368–80. [DOI] [PMC free article] [PubMed] [Google Scholar]
- 201.Leger S, Black WC, Deschenes D, Dolman S, Falgueyret JP, Gagnon M, et al. Synthesis and biological activity of a potent and orally bioavailable SCD inhibitor (MF-438). Bioorg Med Chem Lett. 2010;20:499–502. [DOI] [PubMed] [Google Scholar]
- 202.Noto A, De Vitis C, Pisanu ME, Roscilli G, Ricci G, Catizone A, et al. Stearoyl-CoA-desaturase 1 regulates lung cancer stemness via stabilization and nuclear localization of YAP/TAZ. Oncogene. 2017;36:4573–84. [DOI] [PubMed] [Google Scholar]
- 203.Li J, Condello S, Thomes-Pepin J, Ma X, Xia Y, Hurley TD, et al. Lipid desaturation is a metabolic marker and therapeutic target of ovarian cancer stem cells. Cell Stem Cell. 2017;20:303–314 e305. [DOI] [PMC free article] [PubMed] [Google Scholar]
- 204.Graf H, Jungst C, Straub G, Dogan S, Hoffmann RT, Jakobs T, et al. Chemoembolization combined with pravastatin improves survival in patients with hepatocellular carcinoma. Digestion. 2008;78:34–8. [DOI] [PubMed] [Google Scholar]
- 205.French KJ, Zhuang Y, Maines LW, Gao P, Wang W, Beljanski V, et al. Pharmacology and antitumor activity of ABC294640, a selective inhibitor of sphingosine kinase-2. J Pharmacol Exp Ther. 2010;333:129–39. [DOI] [PMC free article] [PubMed] [Google Scholar]
- 206.Britten CD, Garrett-Mayer E, Chin SH, Shirai K, Ogretmen B, Bentz TA, et al. A phase I study of ABC294640, a first-in-class sphingosine kinase-2 inhibitor, in patients with advanced solid tumors. Clin Cancer Res. 2017;23:4642–50. [DOI] [PMC free article] [PubMed] [Google Scholar]
- 207.Janpipatkul K, Suksen K, Borwornpinyo S, Jearawiriyapaisarn N, Hongeng S, Piyachaturawat P, et al. Downregulation of LAT1 expression suppresses cholangiocarcinoma cell invasion and migration. Cell Signal. 2014;26:1668–79. [DOI] [PubMed] [Google Scholar]
- 208.Gille C, Bolling C, Hoppe A, Bulik S, Hoffmann S, Hubner K, et al. HepatoNet1: a comprehensive metabolic reconstruction of the human hepatocyte for the analysis of liver physiology. Mol Syst Biol. 2010;6:411. [DOI] [PMC free article] [PubMed] [Google Scholar]
- 209.Mardinoglu A, Agren R, Kampf C, Asplund A, Uhlen M, Nielsen J. Genome-scale metabolic modelling of hepatocytes reveals serine deficiency in patients with non-alcoholic fatty liver disease. Nat Commun. 2014;5:3083. [DOI] [PubMed] [Google Scholar]
- 210.Agren R, Mardinoglu A, Asplund A, Kampf C, Uhlen M, Nielsen J. Identification of anticancer drugs for hepatocellular carcinoma through personalized genome-scale metabolic modeling. Mol Syst Biol. 2014;10:721. [DOI] [PMC free article] [PubMed] [Google Scholar]
- 211.Bidkhori G, Benfeitas R, Elmas E, Kararoudi MN, Arif M, Uhlen M, et al. Metabolic network-based identification and prioritization of anticancer targets based on expression data in hepatocellular carcinoma. Front Physiol. 2018;9:916. [DOI] [PMC free article] [PubMed] [Google Scholar]
- 212.Bidkhori G, Benfeitas R, Klevstig M, Zhang C, Nielsen J, Uhlen M, et al. Metabolic network-based stratification of hepatocellular carcinoma reveals three distinct tumor subtypes. Proc Natl Acad Sci U S A. 2018;115:E11874–83. [DOI] [PMC free article] [PubMed] [Google Scholar]
- 213.Hur W, Ryu JY, Kim HU, Hong SW, Lee EB, Lee SY, et al. Systems approach to characterize the metabolism of liver cancer stem cells expressing CD133. Sci Rep. 2017;7:45557. [DOI] [PMC free article] [PubMed] [Google Scholar]