Abstract
Background
Although several clinical breast cancer risk models are used to guide screening and prevention, they have only moderate discrimination.
Purpose
To compare selected existing mammography artificial intelligence (AI) algorithms and the Breast Cancer Surveillance Consortium (BCSC) risk model for prediction of 5-year risk.
Materials and Methods
This retrospective case-cohort study included data in women with a negative screening mammographic examination (no visible evidence of cancer) in 2016, who were followed until 2021 at Kaiser Permanente Northern California. Women with prior breast cancer or a highly penetrant gene mutation were excluded. Of the 324 009 eligible women, a random subcohort was selected, regardless of cancer status, to which all additional patients with breast cancer were added. The index screening mammographic examination was used as input for five AI algorithms to generate continuous scores that were compared with the BCSC clinical risk score. Risk estimates for incident breast cancer 0 to 5 years after the initial mammographic examination were calculated using a time-dependent area under the receiver operating characteristic curve (AUC).
Results
The subcohort included 13 628 patients, of whom 193 had incident cancer. Incident cancers in eligible patients (additional 4391 of 324 009) were also included. For incident cancers at 0 to 5 years, the time-dependent AUC for BCSC was 0.61 (95% CI: 0.60, 0.62). AI algorithms had higher time-dependent AUCs than did BCSC, ranging from 0.63 to 0.67 (Bonferroni-adjusted P < .0016). Time-dependent AUCs for combined BCSC and AI models were slightly higher than AI alone (AI with BCSC time-dependent AUC range, 0.66–0.68; Bonferroni-adjusted P < .0016).
Conclusion
When using a negative screening examination, AI algorithms performed better than the BCSC risk model for predicting breast cancer risk at 0 to 5 years. Combined AI and BCSC models further improved prediction.
© RSNA, 2023
Summary
Negative screening mammographic examinations were analyzed with five artificial intelligence (AI) algorithms; all predicted breast cancer risk to 5 years better than the Breast Cancer Surveillance Consortium (BCSC) clinical risk model, and combining AI and BCSC models further improved prediction.
Key Results
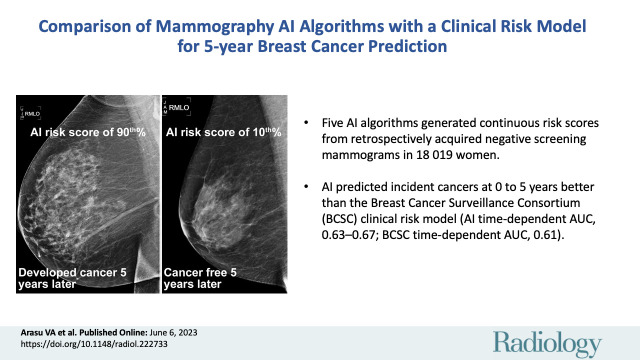
■ Five artificial intelligence (AI) algorithms were used to generate continuous risk scores from retrospectively acquired screening mammographic examinations negative for cancer in 18 019 women.
■ AI predicted incident cancers at 0 to 5 years better than the Breast Cancer Surveillance Consortium (BCSC) clinical risk model (AI time-dependent area under the receiver operating characteristic curve [AUC] range, 0.63–0.67; BCSC time-dependent AUC, 0.61; Bonferroni-adjusted P < .0016).
■ Combining AI algorithms with BCSC slightly improved the time-dependent AUC versus AI alone (AI with BCSC time-dependent AUC range, 0.66–0.68; Bonferroni-adjusted P < .0016).
Introduction
Breast cancer risk models are used to evaluate and guide clinical considerations such as hereditary risk, supplemental screening, and risk-reducing medications (1). Risk models are also undergoing active investigation for broader management in the population, such as risk-based personalized screening (2,3) or capacity management (4). Several models have been developed to assess the risk for breast cancer in the general population, including Breast Cancer Risk Assessment Tool (Gail Model; 5), Breast Cancer Surveillance Consortium (BCSC; 6,7), and International Breast Cancer Intervention Study (Tyrer-Cuzick Risk Model; 8). These models include age, clinical factors (eg, family history of breast cancer, race and/or ethnicity, and previous breast biopsy with benign results), genetic factors, and mammographic breast density but have only moderate discrimination for predicting 5- or 10-year risk of breast cancer (area under the receiver operating characteristic curve [AUC] range, 0.62–0.66) (5–8).
Computer vision–based artificial intelligence (AI) models can potentially improve risk prediction beyond clinical risk factors. These models quantitatively extract imaging biomarkers that represent underlying pathophysiologic mechanisms and phenotypes (9). Breast density is the imaging biomarker most commonly incorporated into clinical risk models, but recent advances in AI deep learning (10) provide the ability to extract hundreds to thousands of additional mammographic features. However, most mammography-based AI algorithms have only been trained to assist radiologists by flagging cancer visible at screening mammography (computer-aided diagnosis or computer-aided detection) and not to predict future risk several years after mammography with negative results (11). A few studies (12,13) have evaluated the ability of mammography-trained AI algorithms to predict future risk of breast cancer, which demonstrated substantial improvements in risk prediction versus clinical risk models alone. To our knowledge, it is unknown whether currently available computer-aided detection or diagnosis AI algorithms trained for shorter time horizons (ie, the time over which risk is assessed) and representing the majority of mammography AI algorithms can also predict longer-term risk. The ability for computer-aided detection or diagnosis to provide personalized future risk prediction would expand the applications into the realm of breast cancer risk models.
This study used screening mammography negative for breast cancer at final assessment from a large community-based cohort in the United States to compare five commercial and academic mammography AI algorithms with each other and with the BCSC clinical model. This study also assessed whether combining the AI and BCSC risk models improved risk prediction compared with either model type alone.
Materials and Methods
Study Cohort and Design
This is a retrospective case-cohort study of women who had a bilateral screening mammographic examination (two-dimensional digital mammography) in 2016 at Kaiser Permanente Northern California (ie, the index mammogram) that was negative at final imaging assessment. Specifically, screening mammographic examinations were selected if they were assessed with screening Breast Imaging Reporting and Data System (BI-RADS) (14) as category 1 or 2, or a screening BI-RADS 0 and diagnostic BI-RADS 1 or 2 in 90 days or less, or a screening BI-RADS 0 and diagnostic BI-RADS 4 or 5 and radiologic-pathologic concordant benign biopsy in 90 days or less. Patients were excluded if they had a history of breast cancer or a high-penetrance breast cancer susceptibility gene as defined by the National Comprehensive Cancer Network guidelines (15). A case-cohort study design was used, which is a hybrid of the cohort and case-control study designs and has the advantage of allowing direct unbiased estimate of cumulative incidence (or absolute risk) and analysis of multiple outcomes, similar to a cohort study (16). This study was approved by the Kaiser Permanente Northern California institutional review board for Health Insurance Portability and Accountability Act compliance and followed the Strengthening the Reporting of Observational Studies in Epidemiology guidelines (17,18).
Data Collection and Imaging Procedures
Screening mammographic examinations in 2016 were identified by Current Procedural Terminology examination code 77057. Incident breast cancer, detected either symptomatically or on a subsequent mammogram, was defined as pathology-confirmed invasive carcinoma or ductal carcinoma in situ. Cancers were confirmed by using the Kaiser Permanente Northern California Breast Cancer Tracking System (19) quality assurance program. This tracking system has a 99.8% concordance with the Kaiser Permanente Northern California tumor registry that reports to the National Cancer Institute Surveillance, Epidemiology, and End Results program, but identifies incident cancers more rapidly (within 1 month of diagnosis) while using manual verification. Women were followed from their index mammogram to date of breast cancer diagnosis, death, health plan disenrollment (allowing up to a 3-month gap in enrollment), or the end of the study (August 31, 2021), whichever occurred first.
The full-field digital mammograms were evaluated in their archived processed form.
Deriving AI Risk Score from Screening Mammograms
AI scores were generated from five deep-learning computer vision algorithms that use screening mammograms as their input and then produce patient-level predicted scores. Candidate algorithms were chosen from an ongoing institutional AI operational evaluation. Further details on the AI algorithms and the underlying architecture are available in Appendix S1. Briefly, this study evaluated two academic algorithms freely available for research, Mirai (13) and Globally-Aware Multiple Instance Classifier (20), and three commercially available algorithms, MammoScreen (21), ProFound AI (22), and Mia (23). Because computer-aided detection or diagnosis algorithms themselves are trained at various time horizons between 3 months and 2 years, each algorithm’s trained time horizon and their ability to predict future risk up to 5 years were displayed. When any algorithm failed to process an individual mammogram, the missing score was imputed using the algorithm’s specific overall median score (missing data by algorithm are in Table S1; evaluation by complete scored mammograms is in Table S2).
The ability of the models to predict 5-year breast cancer risk was divided into three periods after the index screening mammographic examination: interval cancer risk was defined as incident cancers diagnosed between 0 and 1 years, future cancer risk was defined as incident cancers diagnosed from at least 1 to 5 years, and all cancer risk was defined as incident cancers diagnosed between 0 and 5 years.
BCSC Clinical Risk Score Generation
The BCSC clinical 5-year risk model version 2 (6,24) was used as the comparator for the AI models. The BCSC model predicts risk for women without a history of breast cancer or BRCA1/2 mutation based on age, ethnicity, first-degree family history of breast cancer, prior benign breast biopsy, and mammographic breast density. For risk score generation, clinical data from at or before the first screening mammographic examination in 2016 were obtained from the Kaiser Permanente Northern California electronic health record, regardless of prior membership in the Kaiser Permanente Northern California health system. Breast density was based on the clinical interpretation of the index mammogram using the BI-RADS classification system. Whereas the Breast Cancer Tracking System database prospectively classifies atypia and lobular carcinoma in situ, it does not distinguish proliferative benign pathology from otherwise benign pathology, so these outcomes were conservatively classified as nonproliferative lesions.
Statistical Analysis
Statistical software (R version 4.0.2, R Program for Statistical Computing; 25) was used for all statistical analyses (C.L.). All statistical tests were two sided, with a threshold for statistical significance using a Bonferroni correction of the significance level for the 30 tests performed for a threshold α level of .05/30 = .0016. Therefore, estimated differences in AUCs with P < .0016 indicated statistical significance after accounting for multiple comparisons.
Kaplan-Meier was used to estimate the overall 5-year cumulative incidence of breast cancer within strata of each risk score (>90th percentile, middle 80 percentiles, and <10th percentile) as hypothetical thresholds for risk groups. Design weights were included for case-cohort sampling. Model performance was evaluated using the time-dependent AUC, for the dynamic definition of patients with or without breast cancer at any given time when handling time-to-event outcomes (26), and for censoring and sampling distribution using inverse probability of censoring weights and case-cohort sampling (27). Corresponding 95% CIs were obtained using bootstrapping with 1000 bootstrap samples (28). To compare time-dependent AUC estimates from two separate risk scores, the difference in estimates and corresponding bootstrapped 95% CI was calculated. CIs that did not include 0 indicated that the difference in time-dependent AUC estimates was statistically significant (α < .05) (29).
A Cox model was fitted to predict 5-year risk by using the combined AI-predicted score and the BCSC score. The Cox models accounted for the case-cohort sampling with design weights and included both the AI score and BCSC score flexibly by using restricted cubic splines with four knots (30,31). Fivefold cross-validation was used to estimate the time-dependent AUC estimator (27) and presented the average value across the five folds. Corresponding 95% CIs for the average cross-validation–time-dependent AUC were obtained through bootstrapping with 1000 bootstrap samples. Time-dependent AUC was the outcome for comparison. Based on the number of patients with and without cancer, the statistical power for the smallest detectable improvement with the AI model would be .02 compared with reference BCSC (AUC = .60), assuming 80% power, α level of .05, and two-sided tests.
Similar analyses were performed in post hoc subgroups: patients with invasive cancer or ductal carcinoma in situ, patients with complete scores available across all models, patients with BI-RADS 1 or 2 results on screening mammograms, patients with BI-RADS 0 results on screening mammograms, BI-RADS 1 or 2 results at diagnostic imaging or biopsy, and mammograms acquired on equipment manufactured by Hologic or GE Healthcare.
This study assessed the 5-year calibration (ie, the ratio of expected values to observed values) of Mirai and BCSC risk within prespecified strata of 5-year risk based on thresholds established by BCSC. The observed number of patients with cancer during the 5-year study period was compared with the expected number of patients with cancer by calculating the total of the cumulative hazard estimates over all individuals in the study (32). The ratio of observed to expected cases was reported with exact 95% CIs (33). The incidence rates (cases per 1000 person-years) and incident rate ratios with 95% CIs were calculated based on a Poisson distribution. All expected incidence estimates incorporated design weights that accounted for the case-cohort sampling.
Results
Characteristics of the Study Sample
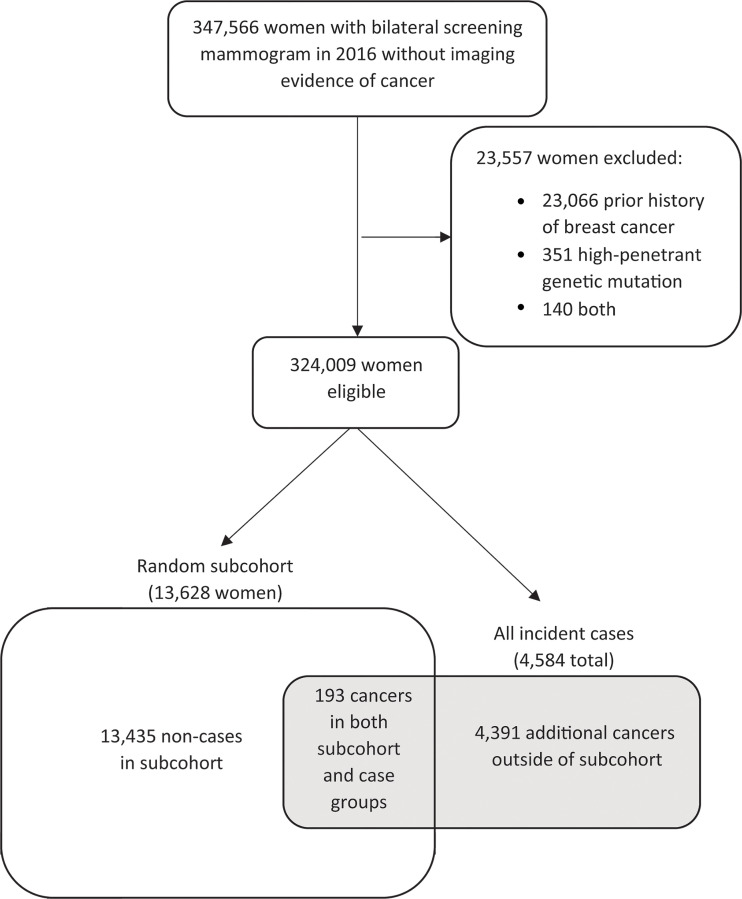
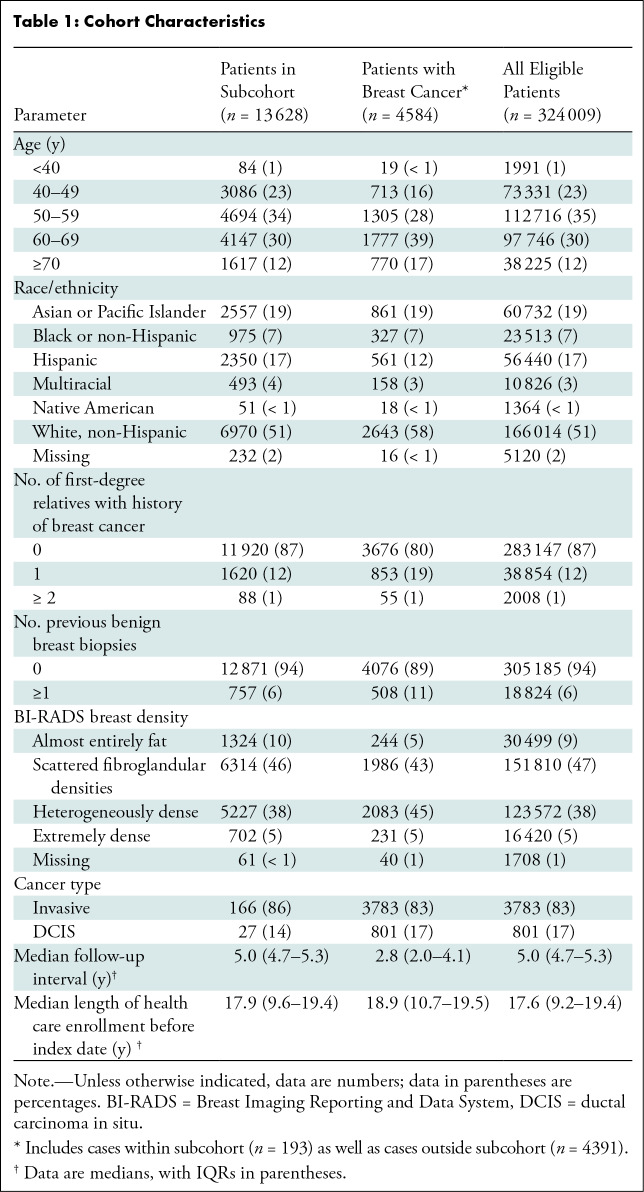
Figure 1 shows the patient selection process for the case-cohort design. Of 347 566 women with a negative screening mammographic examination in 2016, 23 557 were excluded. Of 324 009 women who met eligibility criteria, a simple random cohort of 13 628 women (4.2%) including 193 women with incident breast cancer was selected for analyses. An additional 4391 patients from the complete cohort who were diagnosed with cancer within 5 years of the index mammography in 2016 were also included (4584 total patients; 100%). This sample size was based on the maximum cohort size feasible for AI algorithm evaluation with the resources available. Women younger than 50 years made up 23.3% (3170 of 13 628) of this group, and 51.1% (6970 of 13 628) were non-Hispanic White women (Table 1). Median follow-up was 5.0 years (IQR, 4.7–5.3). Of the 13 435 women in the subcohort who did not develop cancer, 12 226 (91.9%) women were censored because of end of follow-up period, 940 (7.0%) because of disenrollment, and 269 (2.0%) because of death. Of the mammograms, 87.0% were acquired with Hologic units (11 856 of 13 628; Hologic) and 13.0% were acquired with GE units (1772 of 13 628; GE Healthcare).
Figure 1:
Patient selection flowchart. No imaging evidence of cancer: Screening examination Breast Imaging Reporting and Data System (BI-RADS) 1 or 2, or screening BI-RADS 0 and diagnostic BI-RADS 1 or 2 in 90 days or fewer, or screening BI-RADS 0 and diagnostic BI-RADS 4 or 5 and benign biopsy in 90 days or fewer.
Table 1:
Cohort Characteristics
Cumulative Incidence Rates of BCSC Clinical Risk Model and AI Algorithm Scores
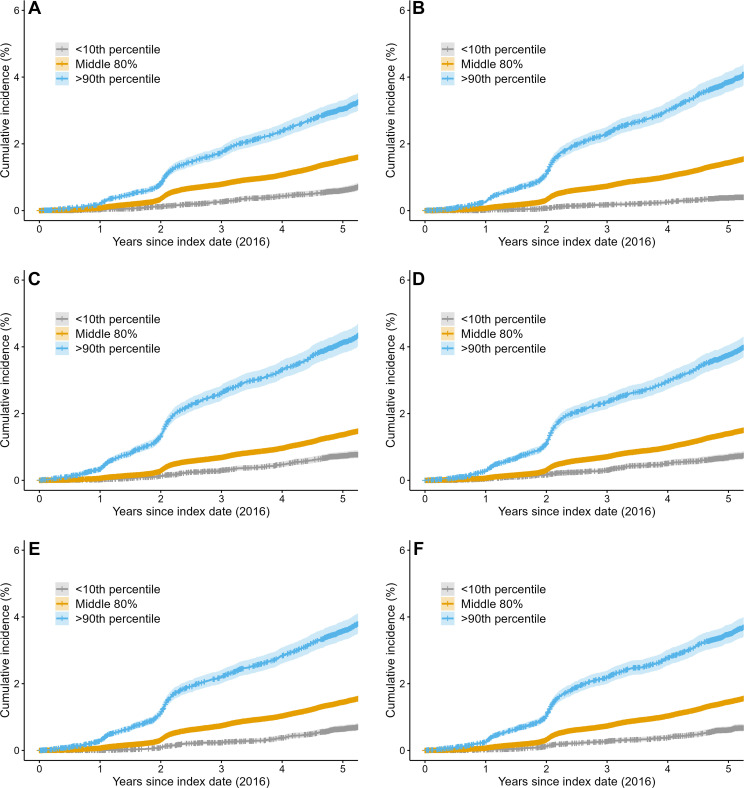
The average cumulative incidence rate at 5 years was 30.4 per 1000 person-years (95% CI: 28.1, 33.1) for women with a BCSC risk score greater than 90th percentile, 15.0 per 1000 person-years (95% CI: 14.4, 15.6) for women with a BCSC risk score in the middle 80 percentiles, and 6.1 per 1000 person-years (95% CI: 5.1, 7.2) for women with a BCSC score in the less than 10th percentile (Fig 2). The incidence rate ratio of greater than 90th percentile risk to less than 10th percentile risk was 5.5. Women with a BCSC risk greater than 90th percentile accounted for 20.0% (919 of 4584) of all cancers by 5 years, whereas women with less than 10th percentile risk accounted for 3.2% (149 of 4584) of all cancers.
Figure 2:
Cumulative risk of breast cancer by risk model type at 5 years. Kaplan-Meier curves for (A) the clinical Breast Cancer Surveillance Consortium (BCSC) risk model and for the mammography-trained artificial intelligence (AI) risk models (B) Mirai, (C) MammoScreen, (D) ProFound, (E) Mia, and (F) Globally-Aware Multiple Instance Classifier. Women with a BCSC risk greater than 90th percentile accounted for 21% of all cancers by 5 years, whereas women with less than 10th percentile risk accounted for 3% of all cancers. Women with AI risk greater than 90th percentile accounted for 24%–28% of all cancers by 5 years, whereas women with less than 10th percentile risk accounted for approximately 2%–5% of cancers across all AI algorithms. The blue line represents women with a risk score greater than 90th percentile, the orange line represents women with a risk score in the middle 80 percentile, and the gray line represents women with a risk score in the less than 10th percentile. Shading surrounding the line is the 95% CI.
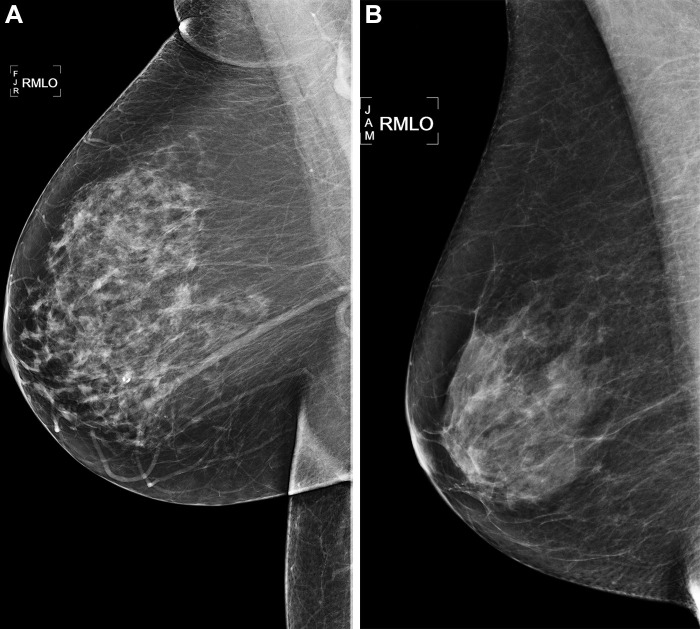
For AI algorithms, the average cumulative incidence rate at 5 years ranged from 34.9 to 41.3 per 1000 person-years for women with a risk score greater than 90th percentile, 13.7 to 14.5 per 1000 person-years for women with a risk score in the middle 80 percentiles, and 3.8 to 7.4 per 1000 person-years for women with a risk score less than 10th percentile. The incidence rate ratio of the risk greater than 90th percentile to risk less than 10th percentile ranged between 5.8 and 11.7. Women with risk greater than 90th percentile accounted for 24%–28% of all cancers at 5 years, whereas women with less than 10th percentile risk accounted for approximately 2%–5% of cancers across all AI algorithms. Examples of women who did and did not develop cancer within 5 years of follow-up are shown in Figure 3.
Figure 3:
Right medial lateral oblique (RMLO) screening mammograms show negative results from 2016 in (A) a 73-year-old woman with Mirai artificial intelligence (AI) risk score with more than 90th percentile risk who developed right breast cancer in 2021 at 5 years of follow-up and (B) a 73-year-old woman with Mirai AI risk score with less than 10th percentile risk who did not develop cancer at 5 years after 5 years of follow-up.
Discrimination and Calibration of BCSC Clinical Risk Model and AI Algorithm Scores
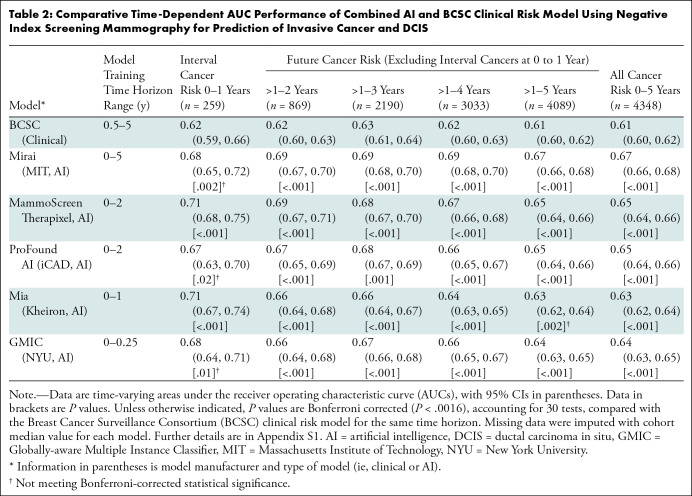
When evaluating discrimination for interval cancer risk (Table 2), BCSC demonstrated a time-dependent AUC of 0.62 (95% CI: 0.59, 0.66), whereas the AI algorithms’ time-dependent AUCs ranged from 0.67 to 0.71, with only Mammoscreen (time-dependent AUC, 0.71; 95% CI: 0.68, 0.75) and Mia (time-dependent AUC, 0.71; 95% CI: 0.67, 0.74) significantly higher than BCSC (Bonferroni-adjusted P < .0016). For the 5-year future cancer risk, BCSC demonstrated a time-dependent AUC of 0.61 (95% CI: 0.60, 0.62), whereas the AI algorithm time-dependent AUCs ranged from 0.63 to 0.67, with all algorithms but Mia significantly higher than BCSC (Bonferroni-adjusted P < .0016). For all cancer risk, BCSC demonstrated a time-dependent AUC of 0.61 (95% CI: 0.60, 0.62), whereas the AI algorithms’ time-dependent AUCs ranged from 0.63 to 0.67, all significantly higher than BCSC (Bonferroni-adjusted P < .0016).
Table 2:
Comparative Time-Dependent AUC Performance of Combined AI and BCSC Clinical Risk Model Using Negative Index Screening Mammography for Prediction of Invasive Cancer and DCIS
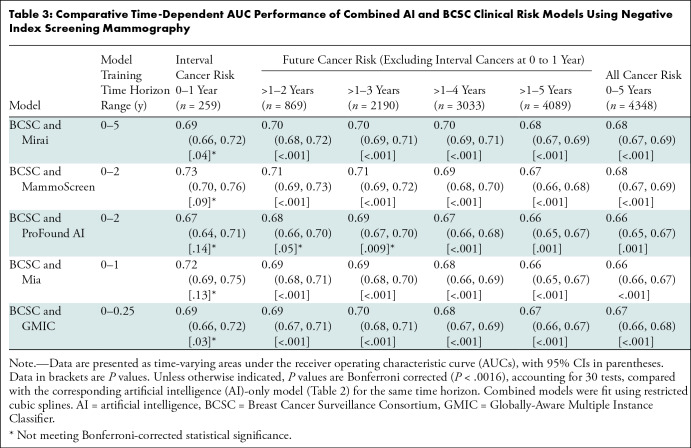
The combined AI and BCSC models’ time-dependent AUCs for interval cancer risk ranged from 0.67 to 0.73 (Table 3), although none were significantly higher than the corresponding AI algorithm alone when using Bonferroni-adjusted P values. The combined models’ time-dependent AUCs for 5-year future cancer risk ranged from 0.66 to 0.68 and were significantly higher than all individual AI algorithms. Similarly, the combined models’ time-dependent AUCs for 5-year all-cancer risk ranged from 0.66 to 0.68 and were higher than all individual AI algorithms.
Table 3:
Comparative Time-Dependent AUC Performance of Combined AI and BCSC Clinical Risk Models Using Negative Index Screening Mammography
Additional subgroup analyses (Tables S2–S8) demonstrated comparable performance to the primary results shown in Table 2 for complete scores available across all models (Table S2), in women with invasive breast cancer (Table S3), BI-RADS 1 or 2 only on screening mammograms (Table S5), and on mammograms acquired by using Hologic equipment (Table S7). Performance was mixed for some algorithms in women with ductal carcinoma in situ (Table S4), mammograms acquired on GE equipment only (Table S6), and in women with BI-RADS 0 on screening mammograms (Table S8), although interpretation was limited because of small sample size.
The 5-year calibration of the BCSC ranged from 1.02 to 1.08 depending on the prespecified BCSC risk threshold ranges, whereas that of the Mirai algorithm ranged from 0.49 to 0.76 (Table S9). Absolute differences in time-dependent AUC were also derived (Table S10 representing Table 2, and Table S11 representing Table 3).
Discussion
We tested several mammography artificial intelligence (AI) models, many of which have been trained for shorter time horizons (ie, time over which risk is assessed), to determine whether they can predict future risk better than the commonly used Breast Cancer Surveillance Consortium (BCSC) clinical risk model (6,7) when used either alone or in combination with the BCSC model. AI algorithms showed a significantly higher discrimination of breast cancer risk than did the BCSC clinical risk model for predicting 5-year risk (AI time-dependent area under the receiver operating characteristic curve [AUC] range, 0.63–0.67, vs BCSC time-dependent AUC, 0.61; Bonferroni-adjusted P < .0016). This difference was most pronounced for interval cancer risk for certain algorithms, which highlights the strength of AI to identify missed or aggressive interval cancers. Furthermore, we demonstrated that AI algorithms trained for short time horizons can predict future risk of cancer up to 5 years when no cancer is clinically detected at mammography. As expected, performance improved for algorithms trained for longer time horizons. Combining BCSC and AI further improves risk prediction versus AI alone and decreases the differences in future risk performance across AI algorithms (for all cancer risk: time-dependent AUC range, 0.66–0.68; Bonferroni-adjusted P < .0016).
Mammography AI algorithms provide an approach for improving breast cancer risk prediction beyond clinical variables such as age, family history, or the traditional imaging risk biomarker of breast density. The absolute increase in the AUC for the best mammography AI relative to BCSC was 0.09 for interval cancer risk and 0.06 for overall 5-year risk, a substantial and clinically meaningful improvement. The overall performance improvement remained when restricting the analysis to invasive cancer only. In order for an AI model to achieve an AUC of approximately 0.7, the model must have predictors that are two to three times more informative than clinical models such as the BCSC with an AUC of approximately 0.6 (1). Although we focus on AUC as an accepted metric to compare general performance of risk models, a further approach to understand clinical significance is provided by our estimates for cancer yield or incidence rate ratios using hypothetical percentile cutoffs. For example, for a high-risk group defined at greater than 90th percentile risk, AI predicted up to 28% of cancers versus 21% with BCSC. However, because of the numerous use cases in which risk models are applied, clinical impact ultimately depends on the context and specific approach in which risk stratification is implemented. Continued strong predictive performance at 1–5 years is surprising and suggests that AI is not only identifying missed cancers but may identify breast tissue features that help predict future cancer development. This is analogous to high breast density independently predicting both tissue masking and future cancer risk (34).
We evaluated risk at different time horizons because each has distinct clinical implications. Certain AI algorithms excelled at predicting patients at high risk of interval cancer, which are often aggressive cancers (34,35) and may require a second reading of mammograms, supplementary screening (eg, with breast MRI), or short-interval follow-up. We also found AI algorithms predicted future risk, which may lead to more frequent and intensive screening or risk counseling for primary prevention. Overall, algorithms maintained robust performance in subgroup analyses for invasive cancer only.
The BCSC model prediction was originally built using U.S. national incidence rates from the Surveillance, Epidemiology, and End Results Program, and the predictions remained well calibrated with outcomes using our cohort, suggesting that our study population and results are similarly generalizable. However, the Mirai model (the only model that generated absolute risk estimates) overestimated cancer risk by a factor of two across all risk strata (observed to expected ratios of 0.49–0.76; Table S9). This is likely because Mirai was originally calibrated for both diagnostic risk (ie, cancer detected on the index mammogram) and future risk. Although model calibration does not affect the observed discriminative performance, calibration is critical when clinical decisions are based on prespecified risk thresholds. At the same time, AI models trained to predict specific thresholds can be recalibrated to support these decisions.
Beyond improved performance, mammography-based AI risk models provide practical advantages versus traditional clinical risk models. AI uses a single data source (the screening mammographic examination) that is available for most women in whom breast cancer risk prediction is relevant, enabling risk scores to be generated consistently and efficiently across a large population. Mammography AI risk models overcome certain barriers for risk models such as time and cost for combining multiple data elements from potentially different sources, as well as dependence on patient-reported history and susceptibility to missing data or recall bias. However, mammography AI risk models are limited to women who have undergone mammography. Therefore, these models cannot inform decisions regarding when women should start screening. Moreover, mammography AI risk models also have potential costs (eg, software or hardware) and other technical and workflow considerations for implementation. Some breast imaging practices may already incorporate computer-aided detection AI, and the generated score may simultaneously be used for future risk stratification. Before AI is applied, it should be evaluated in the local patient populations for validity and potential hidden biases or disparities (36).
Our study had limitations. It was unable to evaluate all existing mammography AI algorithms, which are numerous (11,37) and may have produced different results than the five algorithms we evaluated. However, we provided a robust sample of one-third of the U.S. Food and Drug Administration– and Conformité Européene–cleared commercial algorithms and well-known open-source algorithms. We were also unable to assess the extent to which family history was missing. However, the prevalence of family history was comparable to national estimates (7), suggesting reasonably complete ascertainment. Thus, our estimated BCSC AUC was likely valid and was indeed similar to previously published studies (38,39). Previously reported (13,40) Mirai algorithm performances were higher than those in our results, but this was because those studies evaluated combined diagnostic and future risk performance.
In conclusion, mammography artificial intelligence (AI) algorithms provided prediction of breast cancer risk to 5 years that was better than the Breast Cancer Surveillance Consortium (BCSC) clinical risk model, and the combination of AI and BCSC models further improved prediction. Our results imply that mammography AI algorithms alone may provide a clinically meaningful improvement compared with current clinical risk models at early time horizons (ie, time during which risk is assessed), with further improvements in prediction when AI and clinical risk models are combined. Although AI algorithm performance declines with longer time horizons, most of the algorithms evaluated have not yet been trained to predict longer-term outcomes, suggesting a rich opportunity for further improvement. Evaluating a larger sample of the numerous AI mammography algorithms that are available remains for future efforts (11,37), although we examined multiple U.S. Food and Drug Administration– and Conformité Européene–cleared commercial algorithms and well-known open-source algorithms. Moreover, AI provides a powerful way to stratify women for clinical considerations that necessitate shorter time horizons such as risk-based screening and supplemental imaging. The impact of AI models on clinical decisions requiring risk prediction beyond 5 years requires further study in cohorts with longer follow-up.
Acknowledgments
Acknowledgments
The authors thank Jane Bethard-Tracy, MA, and the Kaiser Permanente Northern California Breast Cancer Tracking System staff, Bing Lee, MS, Wei Yu, MS, Naomi Ruff, PhD, ELS, and Seth Selkow, AAS, for their additional contributions in supporting this study. The authors also thank the patients, mammography facilities, and radiologists for the data they provided for this study.
Supported by the Permanente Medical Group (TPMG) Delivery Science and Applied Research Physician Researcher Program and the National Cancer Institute (R01CA264987). N.M.H. supported by grant from National Institutes of Health (U01 CA225427).
Disclosures of conflicts of interest: V.A.A. No relevant relationships. L.A.H. No relevant relationships. N.S.A. No relevant relationships. D.S.N.B. DataSafety Monitoring Board membership for WISDOM study; stock/stock options in Grail (a subsidiary of Illumina); employed by Grail. J.B.C. No relevant relationships. L.J.E. Board of directors for Quantum Leap Healthcare Collaborative; grant funding from Quantum Leap Healthcare Collaborative for the I-Spy trial; grant from Merck; fees from UpToDate for writing; member of Blue Cross/Blue Shield Medical Advisory Panel and is reimbursed for travel and time. N.M.H. Research funding paid to institution from Kheiron Medical. M.M.G. Royalties from Oxford University Press; DataSafety Monitoring Board/Advisory Board membership for Study of Women Across the Nation. J.K. No relevant relationships. L.H.K. No relevant relationships. D.A.L. No relevant relationships. V.X.L. No relevant relationships. C.M.L. No relevant relationships. D.L.M. Grants paid to author’s institution from NCI, PCORI. A.P. No relevant relationships. L.S. No relevant relationships. W.S. No relevant relationships. H.C.Y. No relevant relationships. C.L. No relevant relationships.
Abbreviations:
- AI
- artificial intelligence
- AUC
- area under the receiver operating characteristic curve
- BCSC
- Breast Cancer Surveillance Consortium
- BI-RADS
- Breast Imaging Reporting and Data System
References
- 1. Gail MH , Pfeiffer RM . Breast Cancer Risk Model Requirements for Counseling, Prevention, and Screening . J Natl Cancer Inst 2018. ; 110 ( 9 ): 994 – 1002 . [DOI] [PMC free article] [PubMed] [Google Scholar]
- 2. Pashayan N , Antoniou AC , Ivanus U , et al . Personalized early detection and prevention of breast cancer: ENVISION consensus statement . Nat Rev Clin Oncol 2020. ; 17 ( 11 ): 687 – 705 . [Published correction appears in Nat Rev Clin Oncol 2020;17(11):716.] [DOI] [PMC free article] [PubMed] [Google Scholar]
- 3. Shieh Y , Eklund M , Madlensky L , et al . Breast Cancer Screening in the Precision Medicine Era: Risk-Based Screening in a Population-Based Trial . J Natl Cancer Inst 2017. ; 109 ( 5 ): djw290 . [DOI] [PubMed] [Google Scholar]
- 4. Miglioretti DL , Bissell MCS , Kerlikowske K , et al . Assessment of a Risk-Based Approach for Triaging Mammography Examinations During Periods of Reduced Capacity . JAMA Netw Open 2021. ; 4 ( 3 ): e211974 . [DOI] [PMC free article] [PubMed] [Google Scholar]
- 5. Gail MH , Brinton LA , Byar DP , et al . Projecting individualized probabilities of developing breast cancer for white females who are being examined annually . J Natl Cancer Inst 1989. ; 81 ( 24 ): 1879 – 1886 . [DOI] [PubMed] [Google Scholar]
- 6. Tice JA , Cummings SR , Smith-Bindman R , Ichikawa L , Barlow WE , Kerlikowske K . Using clinical factors and mammographic breast density to estimate breast cancer risk: development and validation of a new predictive model . Ann Intern Med 2008. ; 148 ( 5 ): 337 – 347 . [DOI] [PMC free article] [PubMed] [Google Scholar]
- 7. Tice JA , Miglioretti DL , Li CS , Vachon CM , Gard CC , Kerlikowske K . Breast Density and Benign Breast Disease: Risk Assessment to Identify Women at High Risk of Breast Cancer . J Clin Oncol 2015. ; 33 ( 28 ): 3137 – 3143 . [DOI] [PMC free article] [PubMed] [Google Scholar]
- 8. Tyrer J , Duffy SW , Cuzick J . A breast cancer prediction model incorporating familial and personal risk factors . Stat Med 2004. ; 23 ( 7 ): 1111 – 1130 . [DOI] [PubMed] [Google Scholar]
- 9. Rizzo S , Botta F , Raimondi S , et al . Radiomics: the facts and the challenges of image analysis . Eur Radiol Exp 2018. ; 2 ( 1 ): 36 . [DOI] [PMC free article] [PubMed] [Google Scholar]
- 10. Geras KJ , Mann RM , Moy L . Artificial Intelligence for Mammography and Digital Breast Tomosynthesis: Current Concepts and Future Perspectives . Radiology 2019. ; 293 ( 2 ): 246 – 259 . [DOI] [PMC free article] [PubMed] [Google Scholar]
- 11. Schaffter T , Buist DSM , Lee CI , et al . Evaluation of Combined Artificial Intelligence and Radiologist Assessment to Interpret Screening Mammograms . JAMA Netw Open 2020. ; 3 ( 3 ): e200265 . [DOI] [PMC free article] [PubMed] [Google Scholar]
- 12. Eriksson M , Czene K , Strand F , et al . Identification of Women at High Risk of Breast Cancer Who Need Supplemental Screening . Radiology 2020. ; 297 ( 2 ): 327 – 333 . [DOI] [PubMed] [Google Scholar]
- 13. Yala A , Mikhael PG , Strand F , et al . Toward robust mammography-based models for breast cancer risk . Sci Transl Med 2021. ; 13 ( 578 ): eaba4373 . [DOI] [PubMed] [Google Scholar]
- 14. American College of Radiology . ACR BI-RADS Atlas: Breast Imaging Reporting and Data System . 5th ed . Reston, Va: : American College of Radiology; , 2013. . [Google Scholar]
- 15. Daly MB , Pal T , Berry MP , et al . Genetic/Familial High-Risk Assessment: Breast, Ovarian, and Pancreatic, Version 2.2021, NCCN Clinical Practice Guidelines in Oncology . J Natl Compr Canc Netw 2021. ; 19 ( 1 ): 77 – 102 . [DOI] [PubMed] [Google Scholar]
- 16. Prentice RL . A case-cohort design for epidemiologic cohort studies and disease prevention trials . Biometrika 1986. ; 73 ( 1 ): 1 – 11 . [Google Scholar]
- 17. Sharp SJ , Poulaliou M , Thompson SG , White IR , Wood AM . A review of published analyses of case-cohort studies and recommendations for future reporting . PLoS One 2014. ; 9 ( 6 ): e101176 . [DOI] [PMC free article] [PubMed] [Google Scholar]
- 18. von Elm E , Altman DG , Egger M , et al . The Strengthening the Reporting of Observational Studies in Epidemiology (STROBE) statement: guidelines for reporting observational studies . J Clin Epidemiol 2008. ; 61 ( 4 ): 344 – 349 . [DOI] [PubMed] [Google Scholar]
- 19. Callahan M , Sanderson J . A breast cancer tracking system . Perm J 2000. ; 4 : 36 – 39 . https://www.thepermanentejournal.org/doi/10.7812/TPP/00.930 . [Google Scholar]
- 20. Shen Y , Wu N , Phang J , et al . An interpretable classifier for high-resolution breast cancer screening images utilizing weakly supervised localization . Med Image Anal 2021. ; 68 : 101908 . [DOI] [PMC free article] [PubMed] [Google Scholar]
- 21. Mammoscreen by Therapixel . https://www.mammoscreen.com/about. Accessed January 7, 2023 .
- 22. iCAD . https://www.icadmed.com/. Accessed January 7, 2023 .
- 23. Kheiron Medical Technologies . https://www.kheironmed.com/. Accessed January 22, 2021 .
- 24. Breast Cancer Surveillance Consortium . Breast Cancer Surveillance Consortium Risk Calculator . https://tools.bcsc-scc.org/BC5yearRisk/sourcecode.htm. Accessed August 18, 2021 .
- 25. R Core Team . The R Project for Statistical Computing . https://www.r-project.org/ Published 2019. Accessed March 6, 2020 .
- 26. Heagerty PJ , Lumley T , Pepe MS . Time-dependent ROC curves for censored survival data and a diagnostic marker . Biometrics 2000. ; 56 ( 2 ): 337 – 344 . [DOI] [PubMed] [Google Scholar]
- 27. Liu D , Cai T , Zheng Y . Evaluating the predictive value of biomarkers with stratified case-cohort design . Biometrics 2012. ; 68 ( 4 ): 1219 – 1227 . [DOI] [PMC free article] [PubMed] [Google Scholar]
- 28. Efron B , Tibshirani R . Bootstrap Methods for Standard Errors, Confidence Intervals, and Other Measures of Statistical Accuracy . Stat Sci 1986. ; 1 ( 1 ): 54 – 75 . [Google Scholar]
- 29. Blanche P , Dartigues J-F , Jacqmin-Gadda H . Estimating and comparing time-dependent areas under receiver operating characteristic curves for censored event times with competing risks . Stat Med 2013. ; 32 ( 30 ): 5381 – 5397 . [DOI] [PubMed] [Google Scholar]
- 30. Harrell FE Jr . Regression Modeling Strategies With Applications to Linear Models, Logistic and Ordinal Regression, and Survival Analysis . Springer; , 2015. . [Google Scholar]
- 31. Harrell FE Jr . rms: Regression Modeling Strategies . https://CRAN.R-project.org/package=rms. Published 2020. Accessed March 6, 2020 .
- 32. Brentnall AR , Cuzick J , Buist DSM , Bowles EJA . Long-term Accuracy of Breast Cancer Risk Assessment Combining Classic Risk Factors and Breast Density . JAMA Oncol 2018. ; 4 ( 9 ): e180174 . [DOI] [PMC free article] [PubMed] [Google Scholar]
- 33. Liddell FD . Simple exact analysis of the standardised mortality ratio . J Epidemiol Community Health 1984. ; 38 ( 1 ): 85 – 88 . [DOI] [PMC free article] [PubMed] [Google Scholar]
- 34. Kerlikowske K , Zhu W , Tosteson AN , et al . Identifying women with dense breasts at high risk for interval cancer: a cohort study . Ann Intern Med 2015. ; 162 ( 10 ): 673 – 681 . [DOI] [PMC free article] [PubMed] [Google Scholar]
- 35. Porter PL , El-Bastawissi AY , Mandelson MT , et al . Breast tumor characteristics as predictors of mammographic detection: comparison of interval- and screen-detected cancers . J Natl Cancer Inst 1999. ; 91 ( 23 ): 2020 – 2028 . [DOI] [PubMed] [Google Scholar]
- 36. Wiens J , Saria S , Sendak M , et al . Do no harm: a roadmap for responsible machine learning for health care . Nat Med 2019. ; 25 ( 9 ): 1337 – 1340 [Published correction appears in Nat Med 2019;25(10):1627.] . [DOI] [PubMed] [Google Scholar]
- 37. Dreyer K , Wald C , Allen B , Agarwal S , Gichoya J , Patti J . American College of Radiology Data Science Institute AI Central; . https://aicentral.acrdsi.org/. Accessed April 11, 2022 . [DOI] [PubMed] [Google Scholar]
- 38. McCarthy AM , Liu Y , Ehsan S , et al . Validation of Breast Cancer Risk Models by Race/Ethnicity, Family History and Molecular Subtypes . Cancers (Basel) 2021. ; 14 ( 1 ): 45 . [DOI] [PMC free article] [PubMed] [Google Scholar]
- 39. Tice JA , Bissell MCS , Miglioretti DL , et al . Validation of the breast cancer surveillance consortium model of breast cancer risk . Breast Cancer Res Treat 2019. ; 175 ( 2 ): 519 – 523 . [DOI] [PMC free article] [PubMed] [Google Scholar]
- 40. Yala A , Mikhael PG , Strand F , et al . Multi-Institutional Validation of a Mammography-Based Breast Cancer Risk Model . J Clin Oncol 2022. ; 40 ( 16 ): 1732 – 1740 . [DOI] [PMC free article] [PubMed] [Google Scholar]


