Abstract
Better understanding of the biology of resistance to DNA methyltransferase (DNMT) inhibitors is required to identify therapies that can improve their efficacy for patients with high-risk myelodysplastic syndrome (MDS). CCRL2 is an atypical chemokine receptor that is upregulated in CD34+ cells from MDS patients and induces proliferation of MDS and secondary acute myeloid leukemia (sAML) cells. In this study, we evaluated any role that CCRL2 may have in the regulation of pathways associated with poor response or resistance to DNMT inhibitors. We found that CCRL2 knockdown in TF-1 cells downregulated DNA methylation and PRC2 activity pathways and increased DNMT suppression by azacitidine in MDS/sAML cell lines (MDS92, MDS-L and TF-1). Consistently, CCRL2 deletion increased the sensitivity of these cells to azacitidine in vitro and the efficacy of azacitidine in an MDS-L xenograft model. Furthermore, CCRL2 overexpression in MDS-L and TF-1 cells decreased their sensitivity to azacitidine. Finally, CCRL2 levels were higher in CD34+ cells from MDS and MDS/myeloproliferative neoplasm patients with poor response to DNMT inhibitors. In conclusion, we demonstrated that CCRL2 modulates epigenetic regulatory pathways, particularly DNMT levels, and affects the sensitivity of MDS/sAML cells to azacitidine. These results support CCRL2 targeting as having therapeutic potential in MDS/sAML.
Introduction
Treatment with DNMA methyltransferase (DNMT) inhibitors is the international standard for patients with high-risk myelodysplastic syndrome (MDS) and a subset of patients with secondary acute myeloid leukemia (sAML),1 but overall survival in these patients remains poor.2 Various studies have implicated immune regulation and nucleoside metabolism in the development of resistance to DNMT inhibitors3-6 but these pathways have not been targeted in combination with DNMT inhibitors in pre-clinical models or in MDS patients. On the contrary, most of the doublet therapies using azacitidine as a backbone have not yet led to significantly improved response rates or survival among MDS patients.7, 8 Moreover, there are currently no available biomarkers that can predict the responses of MDS patients to DNMT inhibitors. Together, these facts highlight the need for better understanding of the molecular basis of the reduced activity of DNMT inhibitors in order to provide predictive information and develop novel and effective treatment strategies for MDS patients.9
We recently discovered that CCRL2, an atypical chemokine receptor, is overexpressed in CD34+ cells from MDS patients compared to those from healthy controls, and that CCRL2 expression promotes MDS and sAML cell growth in vitro and in vivo.10 CCRL2 is critical for the activation of the IL-8/CXCR2,11 ERK/MAPK and AKT pathways12 in inflammatory cells. These pathways have been associated with the induction of MDS and sAML cell growth.13 We found that CCRL2 interacts with JAK2, regulates JAK2/STAT signaling in MDS and sAML cells and alters their sensitivity to JAK2 inhibition.10 The genes found to be upregulated by CCRL2 in MDS cells included DNMT1,10 one of the DNMT that are selectively degraded by hypomethylating agents.14 Understanding the role of CCRL2 and its downstream signaling in resistance to hypomethylating agents could provide critical insights into the molecular biology of MDS, facilitating the discovery of novel biomarkers and, more importantly, new therapeutic strategies for patients with high-risk MDS and sAML. In this study, we found that CCRL2 activation influenced PRC2 complex activity and DNA methylation pathways as well as DNMT expression. Furthermore, its knockdown (KD) enhanced azacitidine-mediated cytotoxicity and blast differentiation in vitro and in vivo. Finally, analysis of primary samples from MDS patients revealed that higher CCRL2 expression is associated with a poorer response to DNMT inhibitors.
Methods
Cell lines and reagents, and CCRL2 manipulation
The cell lines and reagents used are described in the Online Supplementary Methods. Likewise the methods used for CCRL2 lentiviral KD, CRISPR-Cas9 CCRL2 editing and the development of a doxycycline-induced CCRL2 expression method are also described in the Online Supplementary Methods.
RNA sequencing and gene set enrichment analysis
Total RNA was collected using the total RNA Miniprep kit (Monarch #T2010S). RNA-sequencing libraries were constructed using the Illumina TruSeq RNA Sample Preparation Kit v3. Sequencing was performed on an Illumina NovaSeq system to obtain a total of 1.6x10⁹ read pairs. The methods used for the analysis of raw RNA-sequencing data15-17 are described in the Online Supplementary Methods.
Publicly available database
RNA data from 228 MDS samples were extracted from the publicly available BloodSpot database (GSE42519, GSE13159, GSE15434, GSE61804, GSE14468, and TCGA).18
Western bloting
Protein was extracted as previously described.19 Antibodies are reported in the Online Supplementary Methods.
Nuclear and cytoplasmic fractionation
Nuclear/cytoplasmic fractionation was performed using the NE-PER™ Nuclear and Cytoplasmic Extraction kit from ThermoFisher Scientific (# 78833) as previously described.20
Clonogenicity assays
The methods used for clonogenicity assays are described in the Online Supplementary Methods.
MDS-L xenograf studies
MDS-L cells transduced with shControl and shCCRL2 shRNA were transduced with a retroviral vector carrying an enhanced green fluorescent protein (GFP) firefly luciferase fusion gene.21 GFP+ cells were injected intravenously into 10-week-old NOD.Cg-PrkdcscidIl2rgtm1WjlTg(CMV-IL3,CSF2,KITLG) 1Eav/MloySzJ male mice (Jackson Laboratory, stock n. 013062) (6x10⁵ cells/mouse) 48 h after intraperitoneal injection of clophosome-A clodronate liposomes (100 μL/mouse).10 The bioluminescence signal was measured by an IVIS spectrum in vivo imaging system at days 3, 23, 40, and 60. Mice with evidence of engraftment at day 23 (with a signal of at least 107 photons/sec) were treated with intravenous dimethylsulfoxide (DMSO) or azacitidine (2.5 mg/kg/day, every 5 days for a total of 5 doses). At day 60, the mice were sacrificed and the percentage of human CD45+ (hCD45+) cells was assessed in the bone marrow by flow cytometry. CD11b expression was assessed in hCD45+ cells by flow cytometry.
Patients and sample processing
Bone marrow aspirates were obtained from 20 patients with MDS and MDS/myeloproliferative neoplasms (MPN) seen at the Johns Hopkins Sidney Kimmel Comprehensive Cancer Center. Patients granted informed consent to participation in the study which was approved by the Johns Hopkins Medical Institutes Institutional Review Board. The process of CD34+ cell collection is described in the Online Supplementary Methods. Karyotyping and next-generation sequencing were performed at the time of sample collection, using our established Johns Hopkins 63-gene panel22,23 (Online Supplementary Table S3). Response to DNMT inhibitors was assessed using International Working Group (IWG) response criteria in MDS.24 The best response during the first 6 months of treatment was used for the analysis.
Flow cytometry analysis
The methods used for flow cytometry analysis are described in the Online Supplementary Methods.
Statistical analysis
Statistical analyses were performed using GraphPad Prism (GraphPad Software, La Jolla, CA, USA). The statistical methods are described in the Online Supplementary Methods.
Results
CCRL2 regulates the expression of genes in pathways associated with DNA methylation and PRC2 complex activity
We recently reported that CCRL2 deletion in MDS/AML cell lines suppresses their proliferation and inhibits cytokine-mediated JAK2/STAT activation.10 To identify other molecular pathways regulated by CCRL2, we performed unbiased RNA-sequencing in TF-1 cells transduced with either non-targeting vector (shControl) or an shRNA targeting CCRL2 (shCCRL2 – sh1). Subsequently, we identified specific molecular pathways affected by CCRL2 KD using gene set enrichment analysis (GSEA). The volcano plot is presented in Online Supplementary Figure S1A and principal component analysis is shown in Online Supplementary Figure S1B.
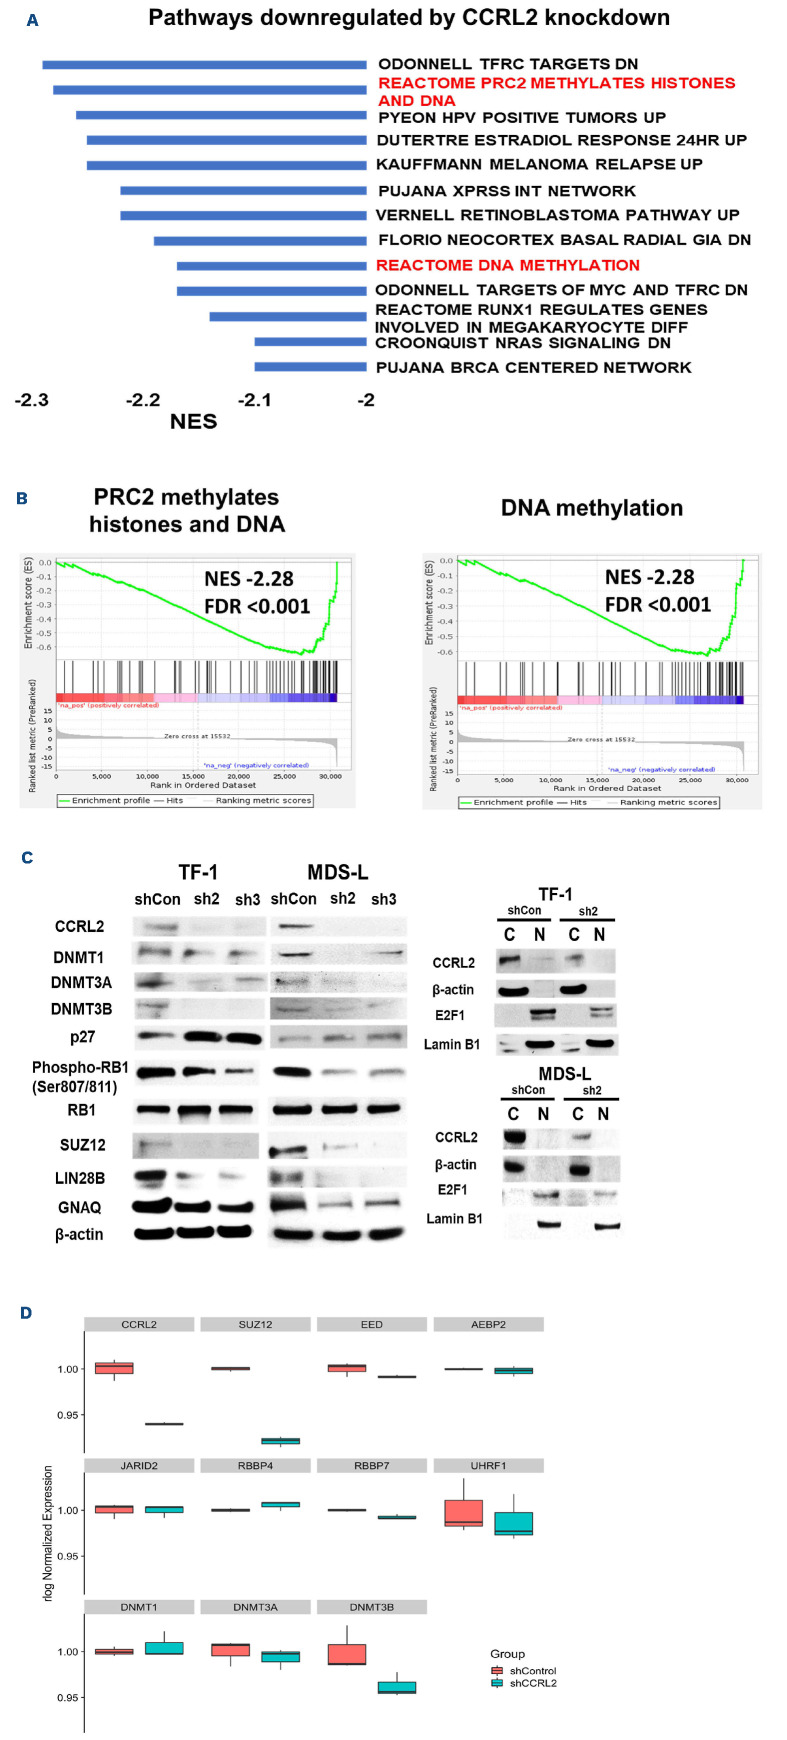
Among the top pathways downregulated by CCRL2 KD were PRC2-mediated methylation of histones and DNA (normal enrichment score [NES] -2.28, false discovery rate [FDR] <0.001) and DNA methylation (NES -2.17, FDR <0.001) (Figure 1A, B). Other top pathways downregulated by CCRL2 KD were pathways associated with cell cycle progression, including transferrin receptor (TFRC) targets (NES -2.29, FDR <0.001), human papilloma virus (HPV)-positive tumors (CDK/RB1/E2F1) (NES -2.26, FDR <0.001), Retinoblastoma pathway (NES -2.2, FDR <0.001), MYC/TFRC targets (NES -2.17, FDR <0.001) and DNA damage repair pathways including the XPRSS network (NES -2.20, FDR <0.001), melanoma relapse (NES -2.25, FDR <0.001) and the BRCA network (NES -2.09, FDR =0.002) (Figure 1A). The top pathways that were upregulated by CCRL2 KD are shown in Online Supplementary Figure S1C.
The effect of CCRL2 KD in the top CCRL2-regulated pathways was validated in TF-1 and MDS-L cells by western blot. In particular, CCRL2 KD by two independent shRNA (sh2 and sh3) suppressed the protein levels of DNMT3A and DNMT3B in TF-1 cells and of all of the DNMT in MDS-L cells (Figure 1C). Similarly, CCRL2 KD suppressed the protein levels of the PRC2 complex component SUZ12 and the levels of the TFRC targets LIN28B and GNAQ in both cell lines (Figure 1C). Finally, upregulation of the HPV tumor pathway is associated with decreased p27 levels, suppressed cyclin-dependent-kinase (CDK)-mediated retinoblastoma protein (RB1) phosphorylation and increased E2F1 nuclear translocation.25 Indeed, we found that CCRL2 KD increased p27 levels and CDK-mediated RB1 phosphorylation and decreased the E2F1 nuclear levels in both TF-1 and MDS-L cells (Figure 1C).
Figure 1.
CCRL2 knockdown downregulates pathways associated with DNA methylation and PRC2 activity. (A) RNA sequencing and gene set enrichment analysis in RNA collected from TF-1 cells transduced with shControl or shCCRL2 (sh1) lentiviruses and selected with puromycin demonstrated a number of oncogenic pathways downregulated by CCRL2 knockdown (KD). Among the topdownregulated pathways were pathways associated with DNA methylation and PRC2 activity. (B) Enrichment plots showing the suppression of PRC2 methylation activity and DNA methylation pathways by CCRL2 KD. (C) Western blot showing that CCRL2 KD suppressed DNMT3A and DNMT3B in TF-1 cells and all the DNMT in MDS-L cells. CCRL2 KD also increased p27 levels, decreased RB1 phosphorylation, and suppressed the protein levels of the PRCA component SUZ12, and the TFRC targets LIN28B and GNAQ in both TF-1 and MDS-L cells. CCRL2 KD decreased the nuclear levels of E2F1 in both TF-1 and MDS-L cells. (D) Box plot of normalized expression of selected genes encoding DNA methyltransferases (DNMT) and PRC2 components between CCRL2 knockout cells and controls. NES: normalized enrichment score; FDR: false discovery rate.
Within the PRC2 activity and DNA methylation pathways, genes encoding DNMT such as DNMT3A and DNMT3B, histone modifiers such as UHRF1 and RBBP7, and PRC2 components such as AEBP2, EED and SUZ12 (Figure 1D) were found to be downregulated by CCRL2 KD in TF-1 cells. The correlation between the expression of CCRL2 and the expression of genes involved in DNA methyl-ation and PRC2 activity was further assessed using RNA-sequencing data from 228 MDS samples from the BloodSpot database.18 Linear regression analysis showed that CCRL2 RNA levels were positively correlated with DNMT1 (coefficient 0.30, P=0.010), EED (coefficient 0.21, P=0.011), RBBP7 (coefficient 0.45, P<0.001) and SUZ12 levels (coefficient 0.49, P<0.001) and negatively correlated with DNMT3A (coefficient -0.45, P<0.001) and UHFR1 levels (coefficient -0.11, P=0.024) (Online Supplementary Figure S2).
Collectively, these results suggest a possible association of CCRL2 and genes involved in DNA methylation and histone modification in MDS and sAML.
CCRL2 deletion increases DNMT protein suppression by azacitidine
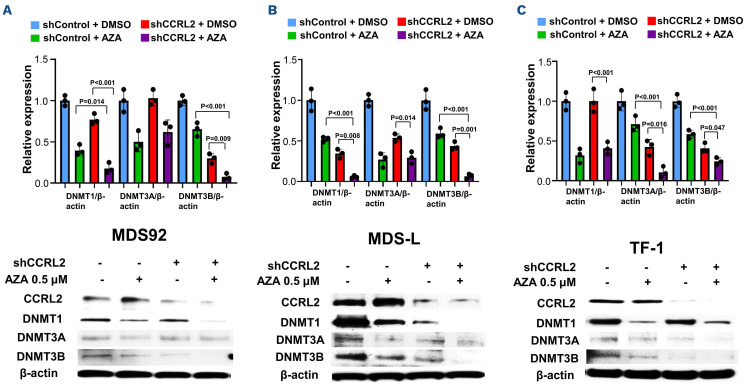
One of the best-studied mechanisms of DNMT inhibitor activity is the degradation of DNMT proteins in MDS and sAML cells, which leads to upregulation of tumor suppressor and differentiation genes by promoter demethylation.14 Based on our data supporting CCRL2 regulation of DNMT RNA expression,10 we hypothesized that CCRL2 loss increases azacitidine-mediated DNMT protein suppression. MDS92, MDS-L and TF-1 cells were transduced with the shControl and shCCRL2 (sh1) vectors and treated with 0.5 mM azacitidine for 24 hours. We found that the combination of CCRL2 KD and azacitidine treatment markedly suppressed DNMT1 and DNMT3B expression in MDS92 (Figure 2A) and MDS-L (Figure 2B) and DNMT3A and DNTM3B in TF-1 cells (Figure 2C) compared to the single modalities.
CCRL2 knockdown increases the clonogenicity inhibition effect of azacitidine and induces its apoptotic and differentiation effects in myelodysplastic syndrome and secondary acute myeloid leukemia cells
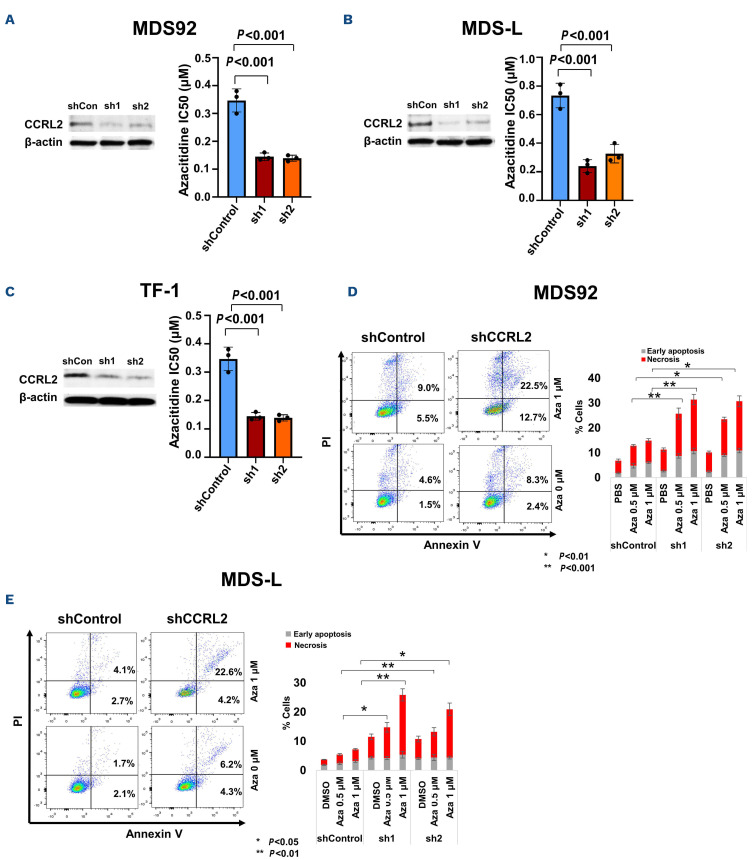
MDS and sAML cells were treated with 0, 0.1, 0.25, 0.5 or 1 mM azacitidine for 3 days and were then plated in methylcellulose medium to assess clonogenicity. CCRL2 KD decreased the half maximal inhibitory concentration (IC50) of azacitidine calculated by the clonogenicity of MDS92, MDS-L, and TF-1 cells (Figure 3A-C) (Online Supplementary Figure S3A-C). Serial passage in methylcellulose medium showed that CCRL2 KD and treatment with azacitidine both enhanced the suppression of clonogenic potential of MDS-L and TF-1 cells (Online Supplementary Figure S3D, E).
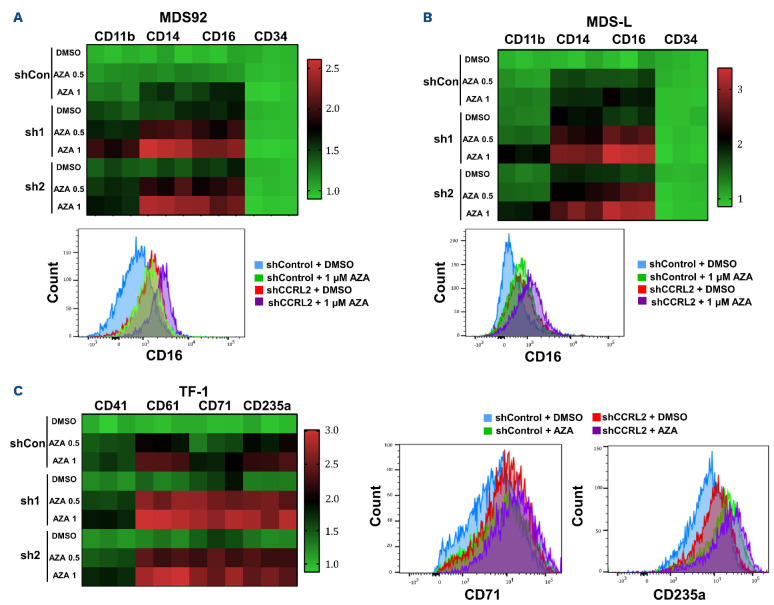
CCRL2 KD increased azacitidine-mediated apoptosis in MDS92 and MDS-L cells (Figure 3D, E), but not in TF-1 cells (Online Supplementary Figure S4A). The selection of surface markers to study the impact of CCRL2 KD and azacitidine on cell differentiation was based on the previously reported effect of CCRL2 on the expression of differentiation markers in MDS92, MDS-L and TF-1 cells.10 CCRL2 KD increased azacitidine-mediated induction of CD11b, CD14, and CD16 expression on the surface of MDS92 and MDS-L cells (Figure 4A, B, Online Supplementary Figure S4B, C) and CD61, CD71 and CD235a on the surface of TF-1 cells (Figure 4C, Online Supplementary Figure S4D). No significant morphological alterations were identified in cells under different treatments (data not shown).
Figure 2.
CCRL2 knockdown increases DNMT protein suppression by azacitidine. (A-C) MDS92, MDS-L and TF-1 cells were treated with 0.5 mM azacitidine for 24 h following transduction with shControl or shCCRL2 (sh1) lentiviruses and selection with puromycin. Quantitative data and a representative western blot are shown. (A) The combination of CCRL2 knockdown (KD) and azacitidine treatment had a more prominent effect on the suppression of DNMT1 and DNTM3B levels in MDS92 cells compared to azacitidine (P=0.014 for DNMT1 and P<0.001 for DNMT3B) and shCCRL2 (P<0.001 for DNMT1 and P=0.009 for DNMT3B) separately. (B) The combination of CCRL2 KD and azacitidine treatment had a more prominent effect on the suppression of DNMT1 and DNTM3B levels in MDS-L cells compared to azacitidine (P<0.001 for both DNMT1 and DNMT3B) and shCCRL2 (P=0.008 for DNMT1 and P=0.001 for DNMT3B). (C). The combination of CCRL2 KD and azacitidine treatment had a more prominent effect on the suppression of DNMT1 and DNTM3B levels in MDS92 cells compared to azacitidine (P<0.001 for both DNMT3A and DNMT3B) and shCCRL2 (P=0.016 for DNMT3A and P=0.047 for DNMT3B).
Figure 3.
CCRL2 knockdown increases the clonogenicity inhibition and apoptotic effects of azacitidine. (A) CCRL2 knockdown (KD) by two different lentiviruses (sh1 and sh2) decreased the azacitidine half maximal inhibitory concentration (IC50) for the clonogenicity of MDS92 cells (P<0.001 for both sh1 and sh2). (B) CCRL2 KD by two different lentiviruses (sh1 and sh2) decreased the azacitidine IC50 for the clonogenicity of MDS-L cells (P<0.001 for both sh1 and sh2). (C) CCRL2 KD by two different lentiviruses (sh1 and sh2) decreased the azacitidine IC50 for the clonogenicity of TF-1 cells (P<0.001 for both sh1 and sh2). (D) CCRL2 KD in MDS92 cells increased the percentage of early apoptotic and necrotic cells under treatment with 0.5 mM (P<0.001 with sh1 and P=0.005 with sh2) and 1 mM (P<0.001 with sh1 and P=0.007 with sh2) of azacitidine (n=3). (E) CCRL2 KD in MDS-L cells increased the percentage of early apoptotic and necrotic cells under treatment with 0.5 mM (P=0.028 with sh1 and P=0.003 with sh2) and 1 mM (P=0.003 with sh1 and P=0.035 with sh2) of azacitidine (n=3).
CCRL2 overexpression increases the resistance to MDS-L and TF-1 cells to azacitidine
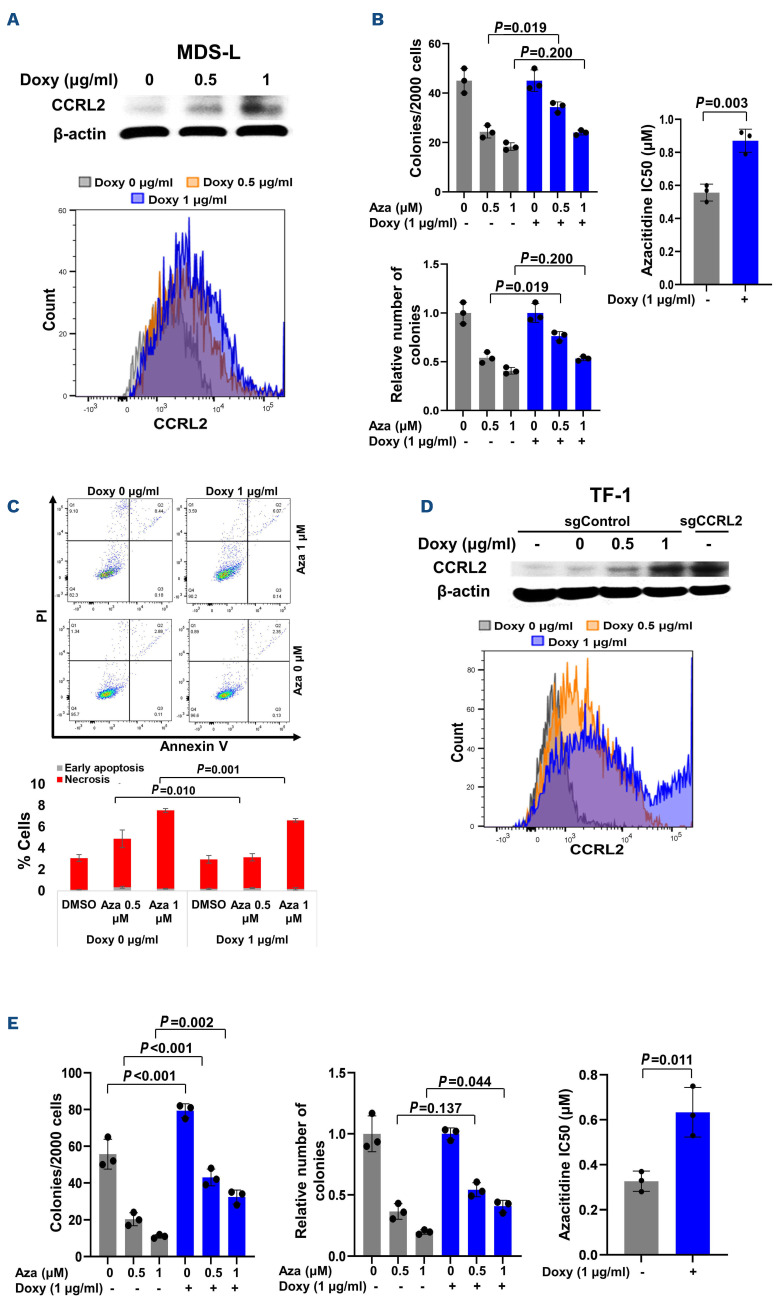
To analyze the effect of CCRL2 expression on the development of resistance to azacitidine, MDS-L cells were transduced with pLV-Puro-TRE-CCRL2- and pLV-HygroCMV>tTS/rtTA-expressing lentiviruses and cells were selected with puromycin and hygromycin. Doxycycline- induced CCRL2 expression was confirmed by western blot and flow cytometry (Figure 5A). CCRL2 overexpression decreased the clonogenicity inhibition effect of 0.5 mM azacitidine and significantly increased the IC50 of azacitidine (Figure 5B). Consistently, CCRL2 overexpression caused a small decrease of the apoptotic effect of 0.5 and 1 mM azacitidine (Figure 5C).
Figure 4.
CCRL2 knockdown increases the differentiation effect of azacitidine. (A) Treatment of MDS92 cells transduced with shCCRL2 (sh1 or sh2) lentiviruses with 0.5 and 1 μΜ azacitidine (Aza) led to a more prominent increase of CD11b (Aza 0.5: P<0.001 for both sh1 and sh2; Aza 1: P=0.001 for sh1 and P<0.001 for sh2), CD14 (Aza 0.5: P<0.001 for both sh1 and sh2; Aza 1: P<0.001 for both sh1 and sh2) and CD16 (Aza 0.5: P<0.001 for both sh1 and sh2; Aza 1: P<0.001 for both sh1 and sh2) expression compared to treatment of cells transduced with shControl lentivirus. Representative flow cytometry graph showing that CCRL2 KD increased the upregulation of CD16 on the surface of MDS92 cells caused by 1 mM azacitidine. (B) Treatment of MDS-L cells transduced with shCCRL2 (sh1 or sh2) lentiviruses with 0.5 and 1 mM azacitidine led to a more prominent increase of CD11b (Aza 0.5: P<0.001 for both sh1 and sh2; Aza 1: P<0.001 for sh1 and P<0.001 for sh2), CD14 (Aza 0.5: P=0.001 for both sh1 and sh2; Aza 1: P<0.001 for both sh1 and sh2) and CD16 (Aza 0.5: P<0.001 for both sh1 and sh2; Aza 1: P<0.001 for both sh1 and sh2) expression compared to treatment of cells transduced with shControl lentivirus. Representative flow cytometry graph showing that CCRL2 KD increased the upregulation of CD16 on the surface of MDS-L cells caused by 1 mM azacitidine. (C) Treatment of TF-1 cells transduced with shCCRL2 (sh1 or sh2) lentiviruses with 0.5 and 1 mM azacitidine led to a more prominent increase of CD41 (Aza 1: P=0.037 for sh2), CD61 (Aza 0.5: P<0.001 for sh1 and P=0.001 for sh2, Aza 1: P<0.001 for sh1 and P=0.005 for sh2), CD71 (Aza 0.5: P<0.001 for sh1, P=0.002 for sh2; Aza 1: P<0.001 for sh1, P=0.002 for sh2), CD235a (Aza 0.5: P=0.002 for sh1 and P=0.007 for sh2; Aza 1: P=0.010 for sh1 and P=0.030 for sh2) expression compared to treatment of cells transduced with shControl lentivirus. Representative flow cytometry graphs showing that CCRL2 KD increased the upregulation of CD71 and CD235a on the surface of TF-1 cells caused by 1 mM azacitidine (n=3).
Figure 5.
Doxycycline-induced CCRL2 overexpression increases the resistance of MDS-L and TF-1 cells to azacitidine. (A) Doxycycline-induced CCRL2 overexpression in MDS-L cells transduced with pLV-Puro-TRE-CCRL2- and pLV-Hygro-CMV>tTS/rtTA-expressing lentiviruses and selected with puromycin and hygromycin treatment was confirmed by western blot and flow cytometry. (B) CCRL2 overexpression by treatment of MDS-L cells with 1 mg/mL doxycycline led to a less prominent suppression of clonogenicity by 0.5 mM azacitidine (P=0.019) and increase of the azacitidine half maximal inhibitory concentration (IC50) (P=0.003). (C) CCRL2 overexpression by treatment of MDS-L cells with 1 mg/mL doxycycline led to a small decrease of the percentage of apoptotic cells under treatment with 0.5 mM (P=0.010) and 1 mM azacitidine (P=0.001). (D) Doxycycline-induced CCRL2 overexpression in TF-1 cells with CRISPR-Cas9 CCRL2 deletion, transduced with pLV-Puro-TRE-CCRL2-and pLV-Hygro-CMV>tTS/rtTA-expressing lentiviruses and selected with puromycin and hygromycin treatment, was confirmed by western blot and flow cytometry. (E) CCRL2 overexpression by treatment of TF-1 cells with 1 mg/mL doxycycline led to a higher clonogenic capacity (P<0.001) in cells treated with dimethylsulfoxide and a less prominent suppression of clonogenicity by 0.5 mM (P=0.001) and 1 mM azacitidine (P=0.002). This led to a less prominent decrease of the relative number of colonies in cells treated with 1 mM azacitidine (P=0.044) and an increased azacitidine IC50 (P=0.011). Doxy: doxycycline; Aza: azacitidine; DMSO: dimethylsulfoxide.
CRISPR-Cas9 delivered via electroporation was used to delete CCRL2 in TF-1 cells. Gene editing was confirmed by DNA sequencing, CCRL2 expression was assessed by flow cytometry and clonogenicity assays confirmed that CCRL2 deletion suppressed the clonogenicity of TF-1 cells (Online Supplementary Figure S5A). TF-1 cells with CCRL2 deletion (sgRNA1) were transduced with pLV-Puro-TRE-CCRL2- and pLV-Hygro-CMV>tTS/rtTA-expressing lentiviruses and cells were selected with puromycin and hygromycin. Doxycycline-induced CCRL2 expression was confirmed by western blot and flow cytometry (Figure 5D). CCRL2 over-expression decreased the clonogenicity inhibition effect of 0.5 and 1 mM azacitidine and increased the IC50 of azacitidine (Figure 5E).
CCRL2 knockdown increases the efficacy of azacitidine in an MDS-L xenograf model
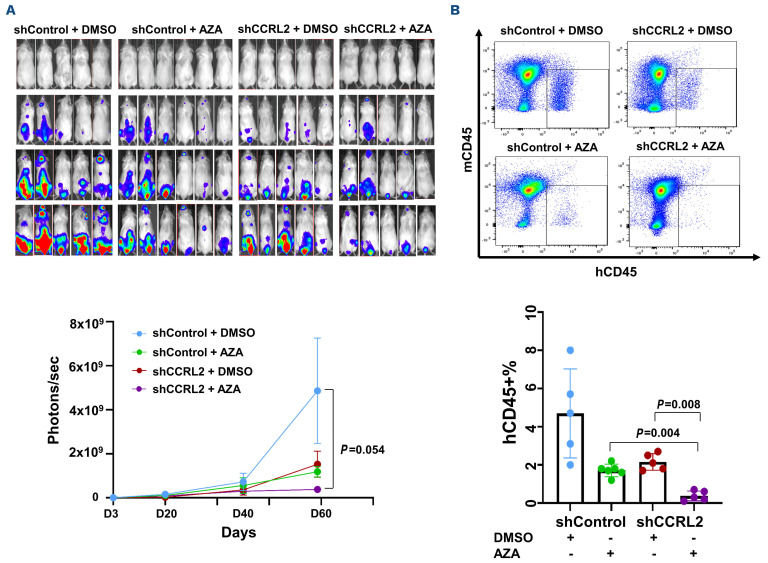
To test the impact of CCRL2 expression on the response of MDS to azacitidine in vivo, MDS-L cells transfected with shControl or shCCRL2 and a GFP+/luciferase+ dual reporter retrovirus were injected intravenously into NSG-hSCF/hGM-CSF/hIL3 (NSGS) mice 48 hours after intraperi-toneal injection of clophosome-A clodronate liposomes as previously described.10 Cell growth was monitored by the bioluminescence signal at days 3, 23, 40 and 60. Engrafted mice (signal of at least 107 photons/sec at day 23) (11/13 injected with shControl MDS-L cells and 10/18 injected with shCCRL2 MDS-L cells, P=0.129) were treated with intravenous azacitidine (2.5 mg/kg/day) or DMSO every 5 days for a total of five doses starting at day 30.26 Mice engrafted with shCCRL2 cells and treated with azacitidine had the lowest disease burden measured at 60 days (Figure 6A). At that point, all mice were sacrificed and the percentage of MDS-L cells in the bone marrow was recorded. Mice engrafted with shCCRL2 cells and treated with azacitidine had the lowest MDS-L cell burden (Figure 6B). Specifically, their percentage of hCD45+ cells was lower compared to that of mice engrafted with shControl cells and treated with azacitdine (P=0.004) and mice engrafted with shCCRL2 cells and treated with DMSO (P=0.008) (Figure 6B). CD11b expression of the hCD45+ cells was overall higher in mice engrafted with shCCRL2 cells and treated with azacitidine than in the rest of the groups (Online Supplementary Figure S5B).
Higher CCRL2 expression in CD34+ cells from patients with myelodysplastic syndromes is associated with worse response to DNMT inhibitors
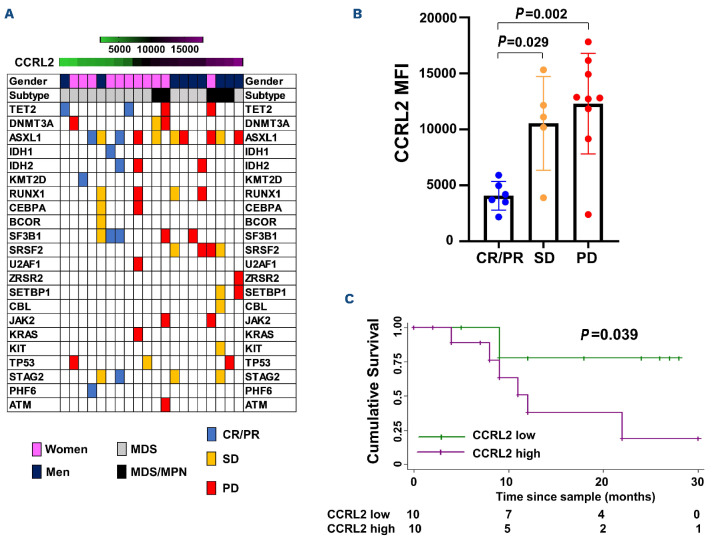
To further study CCRL2 expression and its relation to response to DNMT inhibitors, CCRL2 protein levels in samples from patients with MDS or MDS/MPN were measured by flow cytometry in CD34+ cells sorted from bone marrow aspirates (Online Supplementary Figure S5C, Online Supplementary Table S1). The median follow-up of patients treated with DNMT inhibitors was 12 months (±8.74 months). The response to DNMT inhibition was defined as the best response during the first 6 months of therapy according to IWG response criteria in MDS.24 The genomic profile, gender, subtype (MDS or MDS/MPN) and response of each patient stratified by CCRL2 level are shown in Figure 7A. No significant correlation was found between CCRL2 expression and age, blast percentage, revised International Prognostic Staging System score, karyotype, or number of mutations (Online Supplementary Table S2). MDS/MPN diagnosis, male gender and presence of SETBP1 mutation were positively associated with CCRL2 protein levels (P=0.018, P=0.056 and P=0.031, respectively) (Online Supplementary Table S2). Patients with progressive disease (P=0.002) and stable disease (P=0.029) had higher CCRL2 levels compared to patients in complete remission or partial remission (Figure 7B).
Three out of six (50%) patients with complete or partial remission and two of five (40%) patients with stable disease, but none (0%) of the nine patients with progressive disease underwent allogeneic bone marrow transplantation (BMT) following DNMT inhibitor therapy. Given that CCRL2 expression was associated with response to DNMT inhibitors, we next evaluated the impact of CCRL2 levels on overall survival in this cohort of MDS and MDS/MPN patients treated with DNMT inhibitors. CCRL2 levels higher than the median were associated with worse overall survival compared to CCRL2 levels lower than the median (P=0.039) (Figure 7C).
Figure 6.
Combination treatment with CCRL2 knockdown and azacitidine leads to MDS-L growth suppression in NSGS mice. (A) Monitoring the bioluminescence signal showed that NSGS mice engrafted with MDS-L cells transduced with shCCRL2 lentivirus treated with intravenous azacitidine (2.5 mg/kg/day every 5 days for 5 doses) showed the smallest disease growth compared to mice engrafted with MDS-L cells transduced with shControl lentivirus and treated with dimethylsulfoxide (DMSO) or azacitidine and mice engrafted with MDS-L cells transduced with shCCRL2 lentivirus and treated with DMSO. (B) Mice engrafted with MDS-L cells transduced with shCCRL2 and treated with azacitidine had lower disease burden in their bone marrow based on the percentage of human CD45 (hCD45+%) cells compared to mice engrafted with shControl transduced cells and treated with azacitidine (P=0.004) and mice engrafted with shCCRL2 transduced cells and treated with DMSO (P=0.008). AZA: azacitidine.
Discusssion
DNMT inhibitor treatment remains the standard of care for patients with high-risk myeloid neoplasms. Unfortunately, the effect of DNMT inhibitors is transient, with responses usually maintained for less than 12 months in patients with adverse disease biology.27 Patients with progressive disease or relapse following DNMT inhibitor therapy have a particularly poor survival.28 Allogeneic BMT is the only curative option for these patients and can improve their survival, but an initial response to DNMT inhibitors is generally required for pre-transplant debulking.29 The addition of venetoclax has produced promising results but a significant percentage of MDS and sAML patients fail to respond or develop early resistance.30,31 For this reason, a number of international clinical trials are investigating whether the efficacy of azacitidine can be improved by the addition of novel agents (NCT04313881, NCT03745716). Moreover, there is no available biomarker for the prediction of response to DNTM inhibitors among MDS patients. Thus, a better understanding of the molecular mechanisms of resistance to DNMT inhibitors remains critical for the early prediction of response and discovery of targets for novel therapies that can improve DNMT inhibitor efficacy.
Our in vitro assays revealed that CCRL2 deletion primarily promoted the apoptotic effects of azacitidine in MDS92 and MDS-L cells with a relatively lesser effect on cell differentiation. On the contrary, induction of differentiation was more prominent in the sAML TF-1 cells. Inhibition of clonogenicity was observed in all tested cell lines. Inducible CCRL2 overexpression consistently suppressed inhibition of clonogenicity by azacitidine in two cellular models. These findings were further confirmed in an MDS-L xenograft model with the combination of CCRL2 suppression and azacitidine treatment more prominently suppressing disease burden when compared to the single modalities. MDS-L is a leukemic subline derived from the MDS92 cell line established from a patient with MDS with 5q deletion and monosomy 7.32,33 These cells carry NRAS and TP53 mutations.33 Although the effect of lenalidomide has been described in MDS-L xenografts,33 to our knowledge this is the first report of the efficacy of azacitidine in the suppression of MDS-L cell growth in vivo. This provides a very useful tool for the discovery of novel agents with potential to improve the activity of DNMT inhibitors in high-risk MDS.
Figure 7.
CCRL2 expression in CD34+ cells is negatively correlated with response to DNMT inhibitors. (A) Genomic landscape of patients with myelodysplastic syndrome (MDS) and MDS/myeloproliferative neoplasms (MPN) included in the analysis sorted by CCRL2 levels with gender, disease subtype (MDS and MDS/MPN) and specific somatic mutations being indicated. MDS/MPN patients had higher levels of CCRL2 (P=0.033) and men had relatively higher levels compared to women (P=0.047). Patients who achieved complete or partial remission (CR or PR) are presented in blue, patients with stable disease (SD) are presented in orange and patients with progressive disease (PD) are presented in red. (B) Patients with CR/PR had lower CCRL2 levels in their CD34+ cells compared to patients with SD (P=0.029) or PD (P=0.002). (C) Kaplan-Meier analysis showed that CCRL2 protein levels above the median were associated with worse overall survival since diagnosis (P=0.039) compared to CCRL2 protein levels below the median.
CCRL2 is an atypical chemokine receptor that acts to intensify cytokine signaling, with usual expression on differentiated myeloid cells.11.34 Our group recently found that this receptor is a mediator of MDS and sAML growth by augmenting cytokine-regulated JAK2/STAT signaling.10 Here, we performed RNA sequencing with subsequent GSEA, to demonstrate that CCRL2 KD affects pathways associated with DNA methylation and PRC2 activity. Among the involved genes, those encoding various DNMT were down-regulated by CCRL2 KD. This was consistent with our published results showing that DNMT1 is regulated by CCRL2 in MDS cell lines.10 DNMT inhibitors bind to DNMT after incorporation into newly synthesized DNA;35 this causes DNMT degradation and decreased genomic DNA methylation.35,36 Higher DNMT levels have been associated with resistance to DNTM inhibitors in MDS/AML cell lines and primary samples.37 Our results show that the combination of CCRL2 deletion and azacitidine leads to a more prominent suppression of DNMT protein levels as compared to single modality therapies. Our observations provide a rationale to explain why cells with lower CCRL2 levels demonstrate increased responsiveness to DNMT inhibition. However, we were unable to develop models with concurrent CCRL2 deletion and DNMT upregulation to provide stronger mechanistic insight into the role of DNMT in CCRL2-mediated resistance to azacitidine. Thus, further studies are required to shed light onto the exact molecular mechanism.
Our GSEA results and validation by western blotting highlight pathways associated with cell cycle progression such as TFRC, CDK/RB1/E2F and DNA damage repair pathways, all negatively affected by CCRL2 suppression. This is consistent with previous findings by our group and others showing that CCRL2 regulates oncogenic pathways implicated in cancer growth10,38 and, particularly, cell cycle pro-gression.10 A number of genes implicated in altered DNA methylation, including genes encoding DNMT proteins, are regulated by oncogenic pathways.39,40 Interestingly, RB1 protein suppresses the transcription of DNMT141 and DNMT3A42 in cancer cells. Our RNA-sequencing data and our western blot analysis suggested that CCRL2 KD is associated with E2F suppression and RB1 induction, providing a possible explanation linking upregulated DNMT and CCRL2 expression. Further studies are required to confirm the exact biology of these associations. Our analysis of primary samples showed higher CCRL2 expression in MDS and MDS/MPN CD34+ cells from poor re-sponders to DNMT inhibitors. Higher CCRL2 expression was also associated with male gender and SETBP1 mutations. Men with chronic myeloid diseases have overall worse outcomes compared to women22,23,43 and SETBP1 mutations have been associated with worse response to DNMT inhibitors.44 Given that response to DNMT inhibitors is generally required to support further treatment with allogeneic BMT,45 it is not surprising that lower CCRL2 levels were associated with better survival in this cohort of patients treated with DNMT inhibitors. We previously reported results based on The Cancer Genome Atlas database demonstrating that higher CCRL2 expression is associated with worse survival among AML patients.10 Overall, these findings suggest that CCRL2 expression probably has a negative impact on the outcomes of patients with myeloid neoplasms. Finally, patients with MDS/MPN had higher CCRL2 expression compared to patients with pure MDS.
This observation underlies the role of CCRL2 as a promoter of cell cycle progression and cell proliferation in myeloid malignancies.10
In conclusion, we provide evidence that CCRL2 influences DNA methylation pathways and increases DNMT protein levels. CCRL2 suppression increases the efficacy of azacitidine in vitro and in vivo. Furthermore, CCRL2 expression in CD34+ cells from MDS and MDS/MPN patients is negatively associated with response to DNMT inhibitors. Additional studies are required to understand the precise mechanisms underpinning these associations.
Supplementary Material
Funding Statement
Funding: This study was supported by the National Cancer Institute/NIH (P01 CA225618-01A1, P30 CA06973, R01 HL156144, and K08 HL136894), NIH, National Heart, Lung, and Blood Institute (T32 HL007525), the American Society of Hematology Research Training Award for Fellows (ASH RTAF) and the McMillan Pathway to Independence Program Award.
References
- 1.Karantanos T, DeZern AE. Biology and clinical management of hypoplastic MDS: MDS as a bone marrow failure syndrome. Best Pract Res Clin Haematol. 2021;34(2):101280. [DOI] [PubMed] [Google Scholar]
- 2.Zeidan AM, Shallis RM, Wang R, Davidoff A, Ma X. Epidemiology of myelodysplastic syndromes: why characterizing the beast is a prerequisite to taming it. Blood Rev. 2019;34:1-15. [DOI] [PubMed] [Google Scholar]
- 3.Bowler EH, Bell J, Divecha N, Skipp P, Ewing RM. Proteomic analysis of azacitidine-induced degradation profiles identifies multiple chromatin and epigenetic regulators including Uhrf1 and Dnmt1 as sensitive to azacitidine. J Proteome Res. 2019;18(3):1032-1042. [DOI] [PubMed] [Google Scholar]
- 4.Unnikrishnan A, Papaemmanuil E, Beck D, et al. Integrative genomics identifies the molecular basis of resistance to azacitidine therapy in myelodysplastic syndromes. Cell Rep. 2017;20(3):572-585. [DOI] [PubMed] [Google Scholar]
- 5.Leung KK, Nguyen A, Shi T, et al. Multiomics of azacitidine-treated AML cells reveals variable and convergent targets that remodel the cell-surface proteome. Proc Natl Acad Sci U S A. 2019;116(2):695-700. [DOI] [PMC free article] [PubMed] [Google Scholar]
- 6.Valencia A, Masala E, Rossi A, et al. Expression of nucleoside-metabolizing enzymes in myelodysplastic syndromes and modulation of response to azacitidine. Leukemia. 2014;28(3):621-628. [DOI] [PMC free article] [PubMed] [Google Scholar]
- 7.Sekeres MA, Watts J, Radinoff A, et al. Randomized phase 2 trial of pevonedistat plus azacitidine versus azacitidine for higher-risk MDS/CMML or low-blast AML. Leukemia. 2021;35(7):2119-2124. [DOI] [PMC free article] [PubMed] [Google Scholar]
- 8.Sekeres MA, List AF, Cuthbertson D, et al. Phase I combination trial of lenalidomide and azacitidine in patients with higher-risk myelodysplastic syndromes. J Clin Oncol. 2010;28(13):2253-2258. [DOI] [PMC free article] [PubMed] [Google Scholar]
- 9.Bejar R, Steensma DP. Recent developments in myelodysplastic syndromes. Blood. 2014;124(18):2793-2803. [DOI] [PubMed] [Google Scholar]
- 10.Karantanos T, Teodorescu P, Perkins B, et al. The role of the atypical chemokine receptor CCRL2 in myelodysplastic syndrome and secondary acute myeloid leukemia. Sci Adv. 2022;8(7):eabl8952. [DOI] [PMC free article] [PubMed] [Google Scholar]
- 11.Del Prete A, Martínez-Muñoz L, Mazzon C, et al. The atypical receptor CCRL2 is required for CXCR2-dependent neutrophil recruitment and tissue damage. Blood. 2017;130(10):1223-1234. [DOI] [PubMed] [Google Scholar]
- 12.Zhang Y, Li S, Liu Q, et al. Mycobacterium tuberculosis heat-shock protein 16.3 induces macrophage M2 polarization through CCRL2/CX3CR1. Inflammation. 2020;43(2):487-506. [DOI] [PMC free article] [PubMed] [Google Scholar]
- 13.Schinke C, Giricz O, Li W, et al. IL8-CXCR2 pathway inhibition as a therapeutic strategy against MDS and AML stem cells. Blood. 2015;125(20):3144-3152. [DOI] [PMC free article] [PubMed] [Google Scholar]
- 14.Christman JK. 5-Azacytidine and 5-aza-2'-deoxycytidine as inhibitors of DNA methylation: mechanistic studies and their implications for cancer therapy. Oncogene. 2002;21(35):5483-5495. [DOI] [PubMed] [Google Scholar]
- 15.Leek JT, Storey JD. Capturing heterogeneity in gene expression studies by surrogate variable analysis. PLoS Genet. 2007;3(9):1724-1735. [DOI] [PMC free article] [PubMed] [Google Scholar]
- 16.Subramanian A, Tamayo P, Mootha VK, et al. Gene set enrichment analysis: a knowledge-based approach for interpreting genome-wide expression profiles. Proc Natl Acad Sci U S A. 2005;102(43):15545-15550. [DOI] [PMC free article] [PubMed] [Google Scholar]
- 17.Liberzon A, Birger C, Thorvaldsdóttir H, Ghandi M, Mesirov JP, Tamayo P. The Molecular Signatures Database (MSigDB) hallmark gene set collection. Cell Syst. 2015;1(6):417-425. [DOI] [PMC free article] [PubMed] [Google Scholar]
- 18.Bagger FO, Kinalis S, Rapin N. BloodSpot: a database of healthy and malignant haematopoiesis updated with purified and single cell mRNA sequencing profiles. Nucleic Acids Res. 2019;47(D1):D881-D885. [DOI] [PMC free article] [PubMed] [Google Scholar]
- 19.Karantanos T, Karanika S, Wang J, et al. Caveolin-1 regulates hormone resistance through lipid synthesis, creating novel therapeutic opportunities for castration-resistant prostate cancer. Oncotarget. 2016;7(29):46321-46334. [DOI] [PMC free article] [PubMed] [Google Scholar]
- 20.Hung SC, Pochampally RR, Chen SC, Hsu SC, Prockop DJ. Angiogenic effects of human multipotent stromal cell conditioned medium activate the PI3K-Akt pathway in hypoxic endothelial cells to inhibit apoptosis, increase survival, and stimulate angiogenesis. Stem Cells. 2007;25(9):2363-70. [DOI] [PubMed] [Google Scholar]
- 21.Vera J, Savoldo B, Vigouroux S, et al. T lymphocytes redirected against the kappa light chain of human immunoglobulin efficiently kill mature B lymphocyte-derived malignant cells. Blood. 2007;108(12):3890-3897. [DOI] [PMC free article] [PubMed] [Google Scholar]
- 22.Karantanos T, Gondek LP, Varadhan R, et al. Gender-related differences in the outcomes and genomic landscape of patients with myelodysplastic syndrome/myeloproliferative neoplasm overlap syndromes. Br J Haematol. 2021;193(6):1142-1150. [DOI] [PMC free article] [PubMed] [Google Scholar]
- 23.Karantanos T, Chaturvedi S, Braunstein EM, et al. Sex determines the presentation and outcomes in MPN and is related to sex-specific differences in the mutational burden. Blood Adv. 2020;4(12):2567-2576. [DOI] [PMC free article] [PubMed] [Google Scholar]
- 24.Cheson BD, Greenberg PL, Bennett JM, et al. Clinical application and proposal for modification of the International Working Group (IWG) response criteria in myelodysplasia. Blood. 2006;108(2):419-425. [DOI] [PubMed] [Google Scholar]
- 25.Pyeon D, Newton MA, Lambert PF, et al. Fundamental differences in cell cycle deregulation in human papillomavirus-positive and human papillomavirus-negative head/neck and cervical cancers. Cancer Res. 2007;67(10):4605-4619. [DOI] [PMC free article] [PubMed] [Google Scholar]
- 26.Sutherland MK, Yu C, Anderson M, et al. 5-azacytidine enhances the anti-leukemic activity of lintuzumab (SGN-33) in preclinical models of acute myeloid leukemia. MAbs. 2010;2(4):440-448. [DOI] [PMC free article] [PubMed] [Google Scholar]
- 27.Zeidan AM, Stahl M, Hu X, et al. Long-term survival of older patients with MDS treated with HMA therapy without subsequent stem cell transplantation. Blood. 2018;131(7):818-821. [DOI] [PMC free article] [PubMed] [Google Scholar]
- 28.Prébet T, Gore SD, Esterni B, et al. Outcome of high-risk myelodysplastic syndrome after azacitidine treatment failure. J Clin Oncol. 2011;229(24):3322-3327. [DOI] [PMC free article] [PubMed] [Google Scholar]
- 29.Nakamura R, Saber W, Martens M, et al. A multi-center biologic assignment trial comparing reduced intensity allogeneic hematopoietic cell transplantation to hypomethylating therapy or best supportive care in patients aged 50-75 with advanced myelodysplastic syndrome: Blood and Marrow Transplant Clinical Trials Network study 1102. Blood. 2020;136(Suppl 1):19-21. [Google Scholar]
- 30.DiNardo CD, Pratz K, Pullarkat V, et al. Venetoclax combined with decitabine or azacitidine in treatment-naive, elderly patients with acute myeloid leukemia. Blood. 2019;133(1):7-17. [DOI] [PMC free article] [PubMed] [Google Scholar]
- 31.Bazinet A, Darbaniyan F, Jabbour E, et al. Azacitidine plus venetoclax in patients with high-risk myelodysplastic syndromes or chronic myelomonocytic leukaemia: phase 1 results of a single-centre, dose-escalation, dose-expansion, phase 1-2 study. Lancet Haematol. 2022;9(10):e756-e765. [DOI] [PubMed] [Google Scholar]
- 32.Kida JI, Tsujioka T, Suemori SI, et al. An MDS-derived cell line and a series of its sublines serve as an in vitro model for the leukemic evolution of MDS. Leukemia. 2018;32(8):1846-1850. [DOI] [PubMed] [Google Scholar]
- 33.Rhyasen GW, Wunderlich M, Tohyama K, Garcia-Manero G, Mulloy JC, Starczynowski DT. An MDS xenograft model utilizing a patient-derived cell line. Leukemia. 2014;28(5):1142-1145. [DOI] [PMC free article] [PubMed] [Google Scholar]
- 34.Schioppa T, Sozio F, Barbazza I, et al. Molecular basis for CCRL2 regulation of leukocyte migration. Front Cell Dev Biol. 2020;8:615031. [DOI] [PMC free article] [PubMed] [Google Scholar]
- 35.Hurd PJ, Whitmarsh AJ, Baldwin GS, et al. Mechanism-based inhibition of C5-cytosine DNA methyltransferases by 2-H pyrimidinone. J Mol Biol. 1999;286(2):389-401. [DOI] [PubMed] [Google Scholar]
- 36.Flotho C, Claus R, Batz C, et al. The DNA methyltransferase inhibitors azacitidine, decitabine and zebularine exert differential effects on cancer gene expression in acute myeloid leukemia cells. Leukemia. 2009;23(6):1019-1028. [DOI] [PubMed] [Google Scholar]
- 37.Solly F, Koering C, Mohamed AM, et al. An miRNA-DNMT1 axis is involved in azacitidine resistance and predicts survival in higher-risk myelodysplastic syndrome and low blast count acute myeloid leukemia. Clin Cancer Res. 2017;23(12):3025-3034. [DOI] [PubMed] [Google Scholar]
- 38.Farsam V, Basu A, Gatzka M, et al. Senescent fibroblast-derived Chemerin promotes squamous cell carcinoma migration. Oncotarget. 2016;7(50):83554-83569. [DOI] [PMC free article] [PubMed] [Google Scholar]
- 39.He S, Wang F, Yang L, et al. Expression of DNMT1 and DNMT3a are regulated by GLI1 in human pancreatic cancer. PloS One. 2011;6(11):e27684. [DOI] [PMC free article] [PubMed] [Google Scholar] [Retracted]
- 40.Tsai KL, Sun YJ, Huang CY, Yang JY, Hung MC, Hsiao CD. Crystal structure of the human FOXO3a-DBD/DNA complex suggests the effects of post-translational modification. Nucleic Acids Res. 2007;35(20):6984-6994. [DOI] [PMC free article] [PubMed] [Google Scholar]
- 41.McCabe MT, Davis JN, Day ML. Regulation of DNA methyltransferase 1 by the pRb/E2F1 pathway. Cancer Res. 2005;65(9):3624-3632. [DOI] [PubMed] [Google Scholar]
- 42.Tang YA, Lin RK, Tsai YT, et al. MDM2 overexpression deregulates the transcriptional control of RB/E2F leading to DNA methyltransferase 3A overexpression in lung cancer. Clin Cancer Res. 2012;18(16):4325-4333. [DOI] [PubMed] [Google Scholar]
- 43.Wang F, Ni J, Wu L, Wang Y, He B, Yu D. Gender disparity in the survival of patients with primary myelodysplastic syndrome. J Cancer. 2019;10(5):1325-1332. [DOI] [PMC free article] [PubMed] [Google Scholar]
- 44.Karantanos T, Tsai HL, Gondek LP, et al. Genomic landscape of myelodysplastic/myeloproliferative neoplasm can predict response to hypomethylating agent therapy. Leuk Lymphoma. 2011;63(8):1942-1948. [DOI] [PMC free article] [PubMed] [Google Scholar]
- 45.Jabbour EJ, Garcia-Manero G, Strati P, et al. Outcome of patients with low-risk and intermediate-1-risk myelodysplastic syndrome after hypomethylating agent failure: a report on behalf of the MDS Clinical Research Consortium. Cancer. 2015;121(6):876-882. [DOI] [PMC free article] [PubMed] [Google Scholar]
Associated Data
This section collects any data citations, data availability statements, or supplementary materials included in this article.


