Abstract
Since its inaugural issue in 2019, Radiology: Cardiothoracic Imaging has disseminated the latest scientific advances and technical developments in cardiac, vascular, and thoracic imaging. In this review, we highlight select articles published in this journal between October 2021 and October 2022. The scope of the review encompasses various aspects of coronary artery and congenital heart diseases, vascular diseases, thoracic imaging, and health services research. Key highlights include changes in the revised Coronary Artery Disease Reporting and Data System 2.0, the value of coronary CT angiography in informing prognosis and guiding treatment decisions, cardiac MRI findings after COVID-19 vaccination or infection, high-risk features at CT angiography to identify patients with aortic dissection at risk for late adverse events, and CT-guided fiducial marker placement for preoperative planning for pulmonary nodules. Ongoing research and future directions include photon-counting CT and artificial intelligence applications in cardiovascular imaging.
Keywords: Pediatrics, CT Angiography, CT-Perfusion, CT–Spectral Imaging, MR Angiography, PET/CT, Transcatheter Aortic Valve Implantation/Replacement (TAVI/TAVR), Cardiac, Pulmonary, Vascular, Aorta, Coronary Arteries
© RSNA, 2023
Keywords: Pediatrics, CT Angiography, CT-Perfusion, CT–Spectral Imaging, MR Angiography, PET/CT, Transcatheter Aortic Valve Implantation/Replacement (TAVI/TAVR), Cardiac, Pulmonary, Vascular, Aorta, Coronary Arteries
Summary
Recent advancements in cardiothoracic imaging have improved the detection and prognostication of cardiothoracic disease, resulting in more accurate diagnosis and better patient management
Essentials
■ The revised Coronary Artery Disease Reporting and Data System, CAD-RADS 2.0, addresses and adapts to the current state of coronary CT angiography (CCTA) use, with notable changes including integration of ischemia testing results and plaque burden quantification.
■ Novel developments and applications of CCTA include quantitative CCTA plaque analysis and quantitative perfusion with estimation of myocardial blood flow.
■ Cardiac MRI evaluation of myocarditis following COVID-19 vaccination demonstrated less severe cardiac injury compared with other causes and improvement at follow-up, although minimal late gadolinium enhancement can persist.
■ CT angiography–derived imaging features, such as entry tear dominance, are crucial for developing patient-specific strategies to predict the risk of future adverse events in patients with aortic dissection.
■ CT-guided fiducial marker placement is an effective and safe method for preoperative planning of pulmonary nodules.
Introduction
Cardiothoracic imaging plays a pivotal role in routine diagnosis, risk stratification, and management of cardiovascular and pulmonary diseases. The field continues to evolve, with recent innovations resulting in improved visualization and understanding of thoracic and cardiovascular diseases and their underlying pathophysiology. These advances in imaging have enabled a comprehensive understanding of cardiothoracic diseases and have led to more precise diagnosis and patient management. This review aims to provide an overview of notable developments in cardiac, vascular, and thoracic imaging published in Radiology: Cardiothoracic Imaging between October 2021 and October 2022. The scope of the review encompasses various aspects of coronary artery and congenital heart diseases, vascular diseases, thoracic imaging, and health services research.
The article selection process was guided by a systematic approach considering multiple factors. Articles were initially ranked by number of downloads and Altmetric scores, and the 10 articles with the highest number of downloads and scores, respectively, were included. Given that these metrics favor articles published earlier in the time period, we also considered timeliness, novelty, and reader interest during the review process. Articles were initially reviewed by trainee editorial board members (D.M. and G.J.A.), with additional editorial input from Radiology: Cardiothoracic Imaging editors.
Of the 63 total articles published between October 2021 and October 2022, 25 articles were selected for inclusion. The writing group would like to acknowledge all authors of manuscripts published in Radiology: Cardiothoracic Imaging. Each author has made a substantial contribution to the journal, its readers, and our field, and we were able to highlight only a limited number of articles in this review.
Articles were grouped into nine categories, which include coronary imaging, myocardial blood flow (MBF) assessment, photon-counting CT, congenital heart disease, cardiac MRI, cardiac imaging in COVID-19, vascular imaging, thoracic imaging, and health services research.
Coronary Imaging
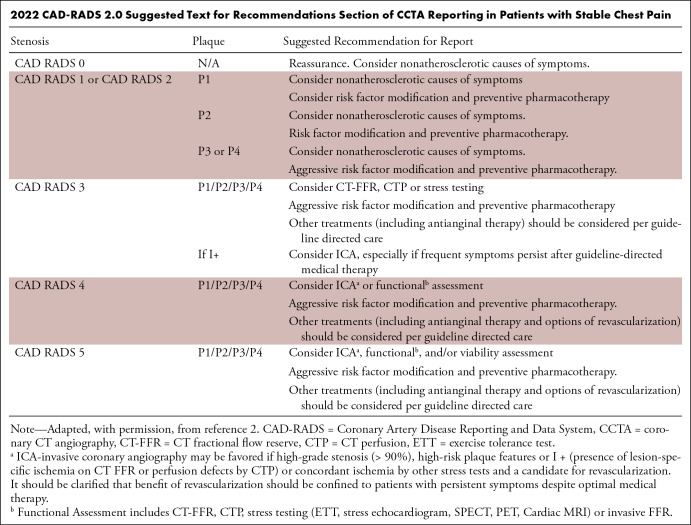
Coronary CT angiography (CCTA) has multisociety guideline recommendations for the evaluation of coronary artery disease (CAD) in patients with acute and stable chest pain (1). The Coronary Artery Disease Reporting and Data System (CAD-RADS) is a standardized reporting system aimed at enhancing the accuracy and reproducibility of CCTA results for the diagnosis and management of CAD. CAD-RADS 2.0 was released in September 2022 (2), addressing some of the limitations of the previous version. Notably, the plaque burden category was added with the “P” modifier, which classifies the overall amount of coronary artery plaque into four levels (P1–P4) (Table). Several options for plaque quantification methods are available, including coronary artery calcium scoring, and imagers have the flexibility of choosing the method most appropriate at their institution and for a given patient. Technological advances regarding ischemia evaluation with CT fractional flow reserve and CT perfusion have also led to the incorporation of the new “I” modifier. This modifier is given only when ischemia testing is performed. It considers the hemodynamic significance of coronary stenoses and can alter the recommended management on the basis of the presence or absence of ischemia. An additional modifier, “E” (for exceptions), was also added, and the prior “V” (for vulnerable plaque) modifier was revised to “HRP” (for high-risk plaque).
2022 CAD-RADS 2.0 Suggested Text for Recommendations Section of CCTA Reporting in Patients with Stable Chest Pain
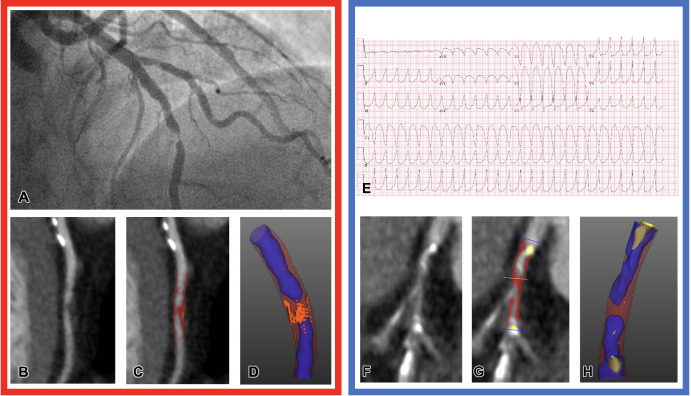
Distinguishing type 1 from type 2 myocardial infarction (MI) is important to guide management. Type 1 MI refers to a primary coronary event attributable to plaque rupture or erosion, whereas type 2 MI occurs secondary to an acute imbalance in myocardial oxygen supply and demand without atherothrombosis. Antithrombotic therapy and invasive imaging are not recommended for type 2 MI and can do more harm than good (3,4). However, clinical risk factors and blood biomarkers alone may be insufficient to differentiate type 1 versus type 2 MI. Meah et al (5) aimed to distinguish type 1 from type 2 MI by using quantitative CCTA plaque analysis (Fig 1). In this study of 327 participants, low-attenuation plaque burden was an independent predictor of type 1 MI (adjusted odds ratio, 3.44 [95% CI: 1.84, 6.95]; P < .001) compared with type 2 MI and had better discriminatory ability for type 1 MI (C statistic = 0.75) compared with other CCTA parameters, such as noncalcified plaque (C statistic = 0.62) and maximal area stenosis (C statistic = 0.61).
Figure 1:
Representative images of CT plaque analysis demonstrate differences between type 1 and type 2 myocardial infarction. Left panel: Images in a 42-year-old man diagnosed with type 1 myocardial infarction. (A) Invasive angiography demonstrates severe stenosis in the distal left anterior descending artery. (B) Coronary CT angiogram, curved planar reformation, (C) quantitative plaque analysis, and (D) three-dimensional quantitative plaque analysis demonstrate a high burden of low-attenuation plaque. Right panel: Images in a 74-year-old man diagnosed with type 2 myocardial infarction. (E) Electrocardiogram demonstrates broad-complex tachycardia consistent with ventricular tachycardia. (F) Coronary CT angiogram, curved planar reformation, (G) quantitative plaque analysis, and (H) three-dimensional quantitative plaque analysis demonstrate a low burden of low-attenuation plaque. Both participants have obstructive coronary artery disease detected with coronary CT angiography. Quantitative plaque analysis demonstrates clear differences, with a much higher burden of low-attenuation plaque in the participant presenting with type 1 myocardial infarction compared with the participant presenting with type 2. (Reprinted, with permission, from reference 5.)
The Coronary CT Angiography Evaluation for Clinical Outcomes: An International Multicenter Registry, or CONFIRM, study evaluated 5-year outcomes of 6386 participants with nonobstructive CAD (less than 50% stenosis) as determined with CCTA. The primary goal was to assess the association of baseline aspirin or statin use with major adverse cardiac events, MI, or death (6). Use of statins was associated with a lower rate of major adverse cardiac events (hazard ratio, 0.59 [95% CI: 0.40, 0.87]; P = .007) in participants with nonobstructive CAD. Conversely, the use of aspirin was not associated with a lower rate of adverse outcomes. Secondary results demonstrated that aspirin or statin use was not protective in participants without any detectable coronary plaque at baseline. CCTA may play an important role in guiding treatment decisions, including recommendations for statins.
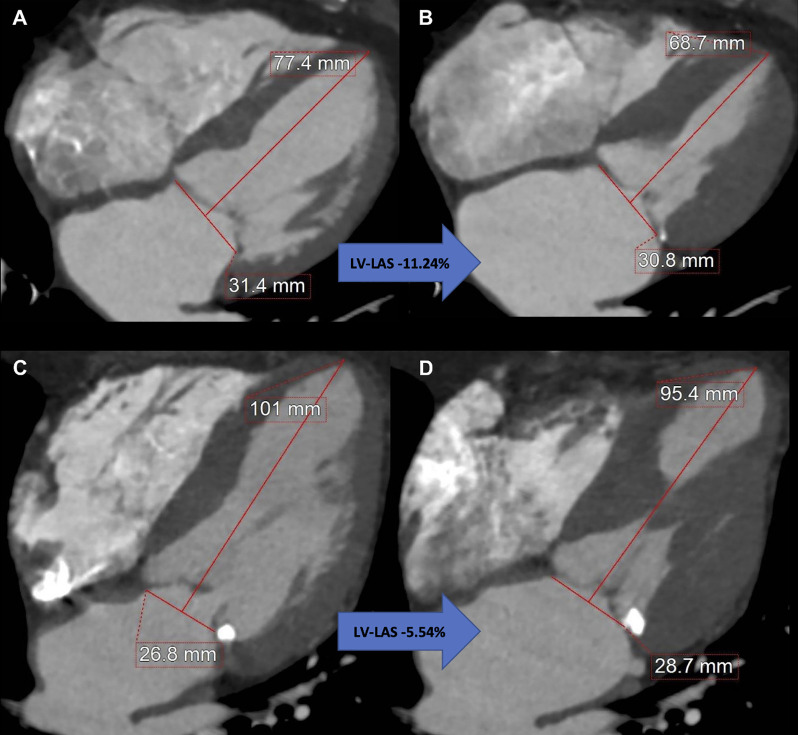
CCTA is a key step in the imaging workup prior to transcatheter aortic valve replacement (TAVR). In a retrospective, single-center study, Aquino and Decker et al (7) used a simplified, CCTA-derived measurement of ventricular longitudinal strain, left ventricular long-axis shortening, using pre-TAVR multiphasic CCTA in 175 patients with severe aortic stenosis (Fig 2). In a multivariable analysis, left ventricular long-axis shortening greater than −9.01% was independently associated with post-TAVR mortality (hazard ratio, 2.83 [95% CI: 1.13, 7.07]; P = .03). CCTA is also useful in guiding coronary interventions. A review by Tzimas et al (8) highlighted the role of CCTA in guiding percutaneous coronary interventions, including the development of an anatomy roadmap to guide interventionalists, plaque characterization, and assessment of coronary translesional physiology.
Figure 2:
Measurement of coronary CT angiography–derived left ventricular (LV) long-axis shortening (LAS) using a reconstructed four-chamber view. Images at (A) end diastole and (B) end systole in an 87-year-old woman with LV-LAS of −11.24%, an ejection fraction of 75%, and a Society of Thoracic Surgeons Predicted Risk of Mortality (STS-PROM) of 6.0% who remained alive after undergoing transcatheter aortic valve replacement (TAVR) for severe aortic stenosis. Images at (C) end diastole and (D) end systole in an 88-year-old man with LV-LAS of −5.54%, an ejection fraction of 67%, and an STS-PROM of 3.6% who died 9 months after undergoing TAVR for severe aortic stenosis. (Reprinted, with permission, from reference 7.)
MBF Assessment
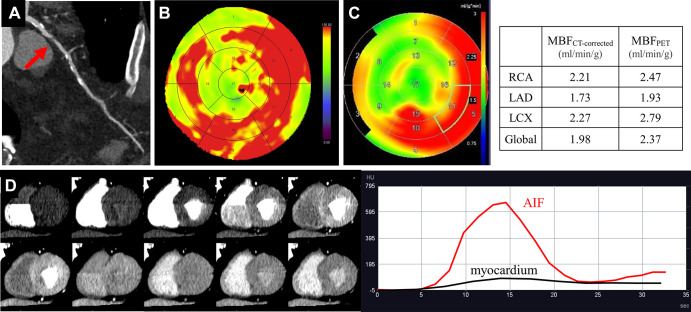
MBF can be quantified using stress perfusion cardiac MRI or PET perfusion imaging (9,10). CT perfusion can also be used to quantify MBF (MBFCT) by using dual-source CT (11). However, MBFCT underestimates true PET-derived MBF (MBFPET) because of inherent differences in myocardial kinetics between iodine contrast media and oxygen 15–labeled water (15O-water) (11). A single-center prospective study with 34 participants used an equation to correct dynamic MBFCT and assess its accuracy versus MBF with 15O-water PET/CT as the reference standard (Fig 3) (12). Prior to correcting MBFCT, MBF values were significantly lower for CT than for PET (1.24 mL/min/g ± 0.33 [SD] vs 2.67 mL/min/g ± 7, respectively; P < .001). However, after applying the correction method to CT, there was no evidence of a difference between MBFCT and MBFPET values (2.64 mL/min/g ± 1.94 vs 2.67 mL/min/g ± 1.87, respectively; P = .88) (12).
Figure 3:
Images in a 72-year-old man with diabetes and hyperlipidemia. (A) Coronary CT angiographic image shows severe stenosis (red arrow) in the proximal portion of the left anterior descending artery (LAD). Both the (B) MBF CT map and (C) MBF PET map demonstrate similar distribution of abnormal perfusion in the anteroseptal wall and apex corresponding to the LAD stenosis. (D) The dynamic CT perfusion (CTP) images and time-attenuation curve obtained with dynamic CTP are demonstrated. AIF = arterial input function, LCX = left circumflex artery, MBF = myocardial blood flow, MBFCT = CT-derived MBF, MBFCT-corrected = CT-derived MBF after correction with the fitting curve, MBFPET = PET-derived MBF, RCA = right coronary artery. (Reprinted, with permission, from reference 12.)
Photon-counting Detector CT
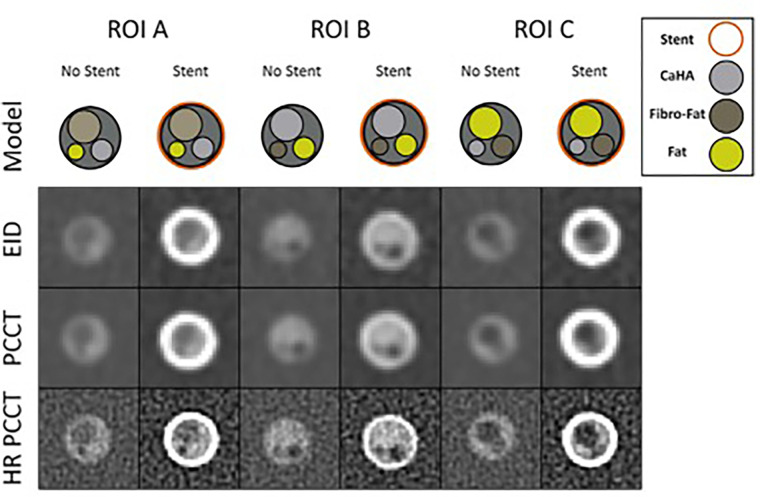
Photon-counting detector CT (PCD CT) is a new generation of CT technology that offers high spatial resolution and excellent image quality (13,14). Using an investigational CT scanner with both energy-integrating detector (EID) and PCD subsystems on a coronary artery phantom, Rajagopal et al (15) compared the detection of coronary plaque composition with and without stents by using EID CT, standard PCD CT, and a high-resolution PCD CT kernel (Fig 4). High-resolution PCD CT helped detect plaque composition more accurately in coronary phantoms with and without stents when compared with EID CT and standard PCD CT, although it had higher noise, and high-resolution PCD CT images were the least affected by stent artifacts and blooming. Similar ability to detect in-stent findings with a high-resolution kernel is supported by a recent study assessing the impact of different scan modes and reconstruction kernels on a clinical PCD CT system (16).
Figure 4:
Coronary phantom content and imaging. Each column shows a different region of interest (ROI), with the detailed 5-mm probe content shown in the top row. Cross-sections of the probe at energy-integrating detector CT (EID; second row), photon-counting CT (PCCT; third row), and high-resolution PCCT (HR PCCT; fourth row) with and without stents. Window and level for unstented cases was 1600 HU and 300 HU and for stented cases was 1000 HU and 250 HU, respectively. (Reprinted, with permission, from reference 1.)
Congenital Heart Disease
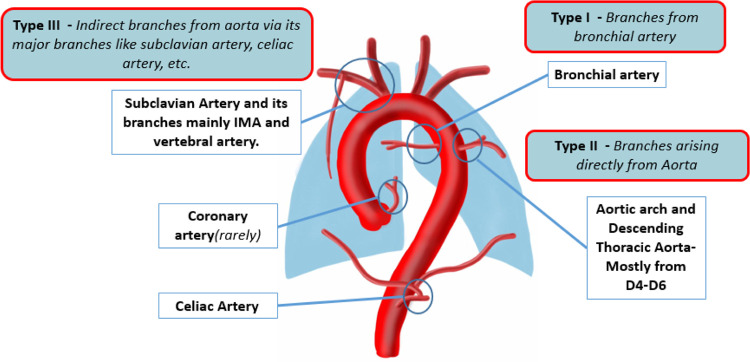
Congenital heart diseases with low antegrade pulmonary flow can lead to the formation of major aortopulmonary collateral arteries (MAPCAs). A review by Alex et al (17) highlighted the causes, pathophysiology, classification, reporting parameters, management options, and differential diagnoses of MAPCAs. Reporting of MAPCAs should include a description of their origin, course, segmental vascular supply, and other cardiac and pulmonary features to influence decision-making and potentially guide treatment planning (Fig 5).
Figure 5:
Diagram representing the common sites of major aortopulmonary collateral arteries origin and classification. D4–D6 = dorsal vertebrae 4 to 6, IMA = internal mammary artery. (Reprinted, with permission, from reference 17.)
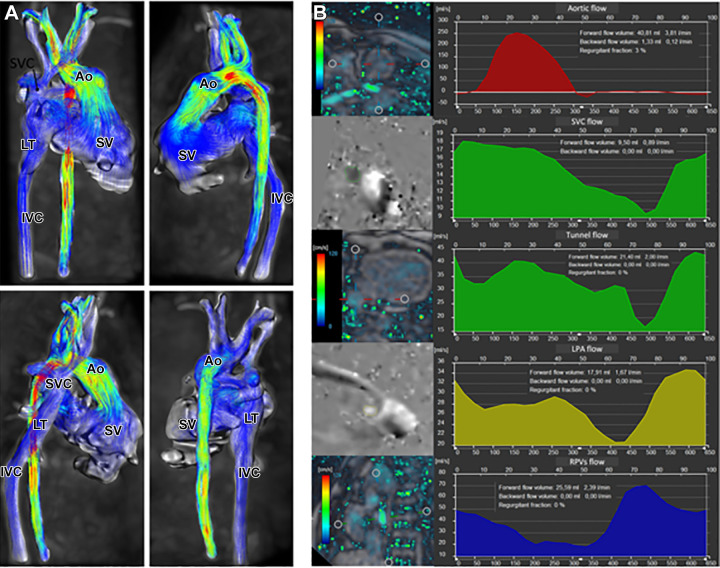
Cardiac MRI is frequently used for presurgical evaluation and lifelong postsurgical monitoring in patients with Fontan cavopulmonary connections. Puricelli et al (18) reviewed multiple MRI sequences that play specific roles in the evaluation of the Fontan cavopulmonary connections. In addition to traditional sequences such as contrast-enhanced MR angiography and two-dimensional phase-contrast imaging, the authors showed that three-dimensional time-resolved phase-contrast MRI (ie, four-dimensional flow) provides additional hemodynamic markers, such as energetics of the Fontan circulation and ventricular efficiency (Fig 6).
Figure 6:
Four-dimensional (4D) flow assessment in an 11-year-old patient with hypoplastic left heart syndrome after intra-atrial lateral tunnel Fontan procedure. (A) Streamline visualization with velocity color coding of 4D flow data. (B) Flow quantification in the aorta (Ao) (red), superior vena cava (SVC) and lateral tunnel (LT) (green), left pulmonary artery (LPA) (yellow), and right pulmonary veins (RPVs) (blue). IVC = inferior vena cava, SV = single ventricle. (Reprinted, with permission, from reference 18.)
Using two-dimensional phase-contrast MRI, Lam et al (19) compared blood flow in 55 fasting pediatric patients with a Fontan circulation to 19 healthy participants and found significant differences in systemic and splanchnic blood flow, with lower blood flow on average in the Fontan group. They also demonstrated a positive moderate correlation between Fontan flow and exercise capacity, as determined by peak oxygen consumption (ie, VO2). Interestingly, the relationship between Fontan blood flow and catheter-measured pre-Fontan mean pulmonary arterial pressure was inverse. Altogether, this study reinforces the concept that reduced blood flow from collateral circulation could lead to organ hypoperfusion (19).
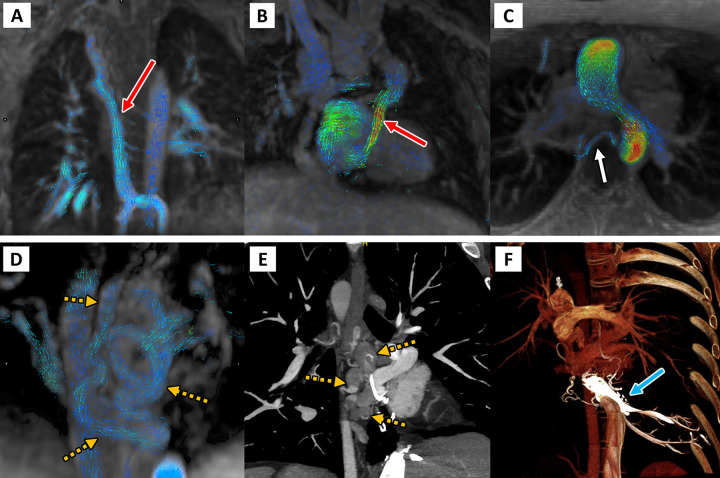
In a multicenter, retrospective study, Raimondi et al (20) used four-dimensional flow to investigate collateral circulation in 75 patients with Fontan circulation (Fig 7). Overall, 49% (37 of 75) of patients had substantial shunts (total shunt volumes > 1.0 L/min), the majority of which were venovenous collaterals (30 of 37, 81%). All nine patients with high cardiac output (>4.0 L/min/m2) had high-flow shunts, mainly venovenous, suggesting that collateral circulation may contribute to the high-output state.
Figure 7:
Four-dimensional (4D) flow visualization of venovenous and aortopulmonary collateral vessels to determine the cause of systemic-pulmonary venous shunting. First are two patients with large venovenous collateral vessels (red arrow): (A) a 5-year-old boy and (B) a 12-year-old boy, with drainage directly into the atrium bypassing the pulmonary arteries. (C) In a 13-year-old girl, a small aortopulmonary collateral artery is seen arising from the descending thoracic aorta (white arrow). Finally, on the bottom row, a 33-year-old man with large serpiginous venous collateral vessels (orange dashed arrows in D and E) is shown on (D) 4D flow and (E, F) cardiac CT angiographic images, illustrating large venous varices and their direct supply from the hepatic venous confluence (blue arrow). (Reprinted, with permission, from reference 20.)
Cardiac MRI
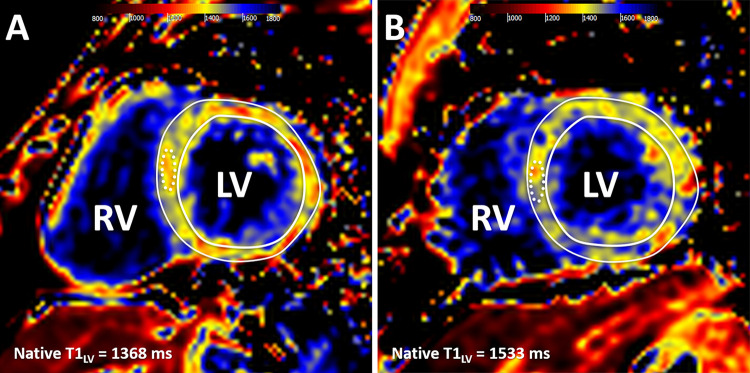
A key strength of cardiac MRI is myocardial tissue characterization, including late gadolinium enhancement (LGE) imaging. Parametric mapping sequences allow the quantification of myocardial tissue changes with incremental clinical value (21). François et al (22) evaluated differences in cardiac MRI parameters in young adults born prematurely. Native T1 values at 3 T were significantly higher in participants born preterm compared with age-matched participants born at term (1477 msec ± 77 vs 1423 msec ± 71, P = .0019), although there was substantial overlap between groups (Fig 8). Higher T1 values were associated with larger cardiac chamber size and impaired systolic strain. These results support the possibility of a distinct cardiomyopathy associated with premature birth and suggest that clinical follow-up to monitor for adverse cardiovascular outcomes may be warranted.
Figure 8:
Cardiac MR native T1 mapping images in adults born (A) term and (B) preterm. Native T1 values were measured in a midventricular section, with global left ventricular (LV) values recorded as a mean native T1 value for the entire mid-LV section (T1LV) and as a mean T1 value for a 1-cm2 region of interest in the septum (dotted line). RV = right ventricle. (Reprinted, with permission, from reference 22.)
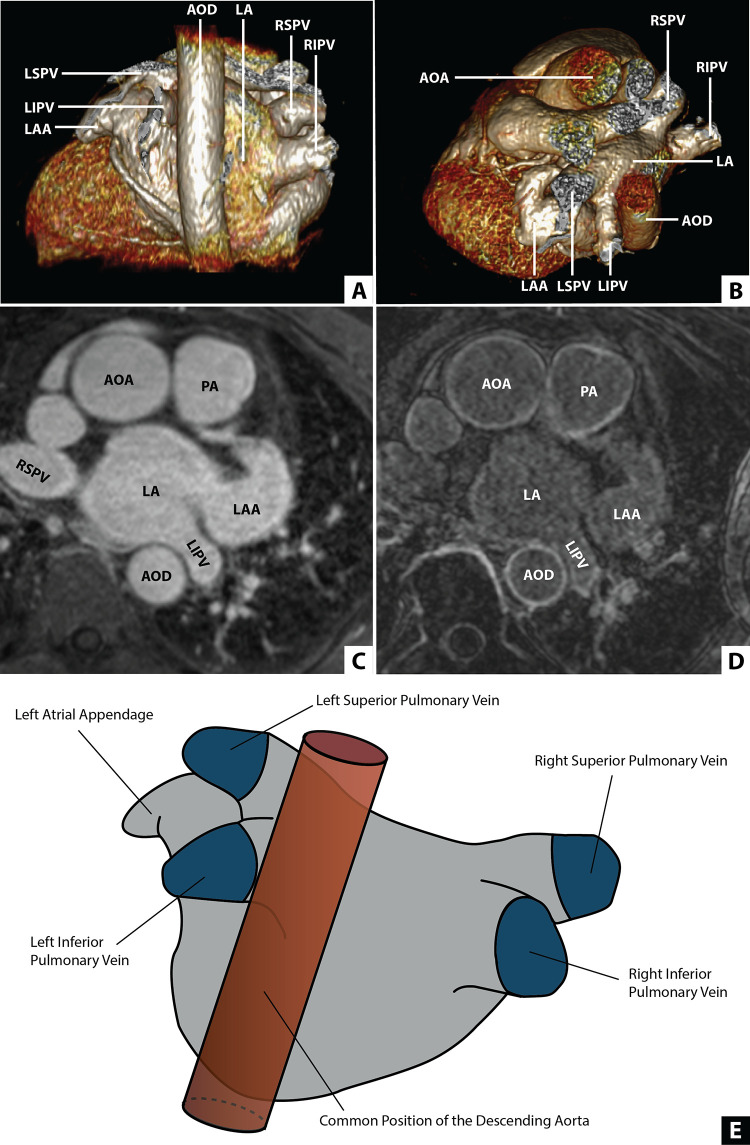
Although cardiac CT is typically used for preprocedural evaluation and planning in patients with atrial fibrillation, high-resolution cardiac MRI sequences for tissue characterization have also been applied for the evaluation and quantification of atrial fibrosis. Hopman et al (23) quantified the extent of left atrial fibrosis globally and regionally by using three-dimensional LGE in patients with atrial fibrillation (Fig 9). Left atrial fibrosis in atrial fibrillation was more extensive in the left inferior pulmonary vein area and correlated negatively with the distance between the descending thoracic aorta and left atrial wall (rs = −0.49, P < .01).
Figure 9:
Position of the descending aorta relative to the left atrium (LA). (A) Multiplanar reconstruction displaying a posterior view of the LA and the descending aorta (AOD). (B) Multiplanar reconstruction displaying an axial view of the LA and the AOD. (C) Contrast-enhanced MR angiogram of the LA and aorta. (D) Late gadolinium enhancement MRI of the LA and the aorta. (E) An illustration of the LA incorporating a common location of the AOD. AOA = ascending aorta, LAA = LA appendage, LIPV = left inferior PV, LSPV = left superior PV, PA = pulmonary artery, PV = pulmonary vein, RIPV = right inferior PV, RSPV = right superior PV. (Reprinted, with permission, from reference 23.)
Myocardial strain analysis using cardiac MRI feature tracking is often performed using an endocardial layer approach, although recent technical developments allow for multilayered analysis. Issak et al (24) evaluated the diagnostic performance of cardiac MRI feature tracking layer-specific strain analysis in patients with suspected acute myocarditis. They found that diagnostic performance for acute myocarditis varied depending on the layer analyzed, with the highest area under the receiver operating characteristic curve values for midmyocardial circumferential strain (0.82) and subepicardial longitudinal strain (0.77). This finding might be explained by the pathophysiology of myocarditis, which frequently involves the subepicardial myocardium.
Cardiac Imaging in COVID-19
Cardiothoracic imaging is commonly used in the evaluation of patients with COVID-19, including for the detection of pneumonia and pulmonary embolism (25,26). Although respiratory symptoms predominate in acute COVID-19, early recognition of myocardial injury in a minority of patients with severe COVID-19 fueled substantial research in this area. Wassenaar et al (27) used feature tracking strain analysis to evaluate 188 athletes referred for cardiac MRI a median of 30 days after COVID-19 diagnosis. Global circumferential strain was weaker in athletes after COVID-19 infection compared with a control group, and this difference persisted following adjustment for age, sex, body mass index, heart rate, and systolic blood pressure (β coefficient, 1.29 [95% CI: 0.20, 2.38]; P = .02). In other patient populations, cardiac MRI abnormalities after COVID-19 infection have been shown to improve or resolve when re-evaluated at longer-term follow-up (28), highlighting the importance of timing with respect to interpretation of imaging findings.
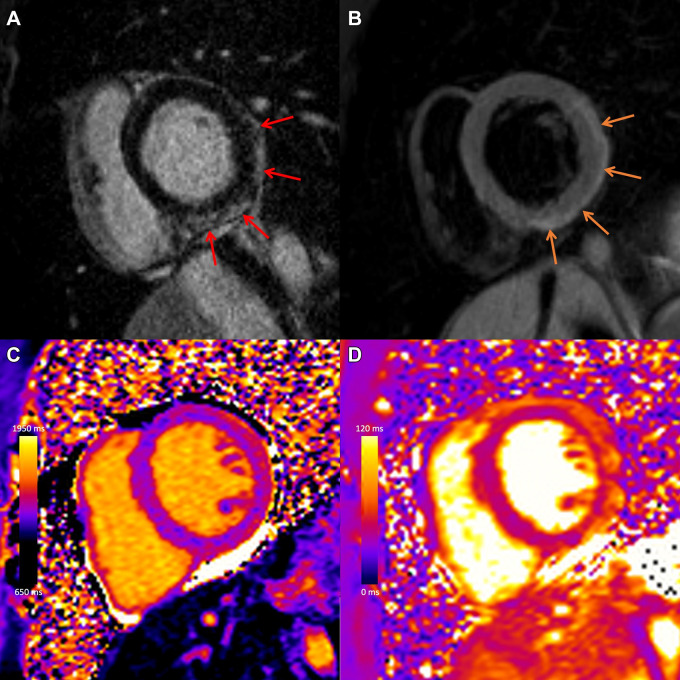
Soon after the introduction of COVID-19 vaccination campaigns, early reports of myocarditis following mRNA vaccination emerged, particularly in younger men. Sanchez Tijmes et al (29) summarized current data on cardiac MRI in patients with myocarditis after COVID-19 illness and after vaccination, highlighting that the pattern of injury at MRI in postvaccine myocarditis was similar to other causes (Fig 10) (30). Sanchez Tijmes et al (31) also described one of the earliest multimodality imaging reports in a patient with myocarditis following a COVID-19 vaccine booster dose. Subsequent reports have demonstrated that myocardial edema typically resolves over weeks, with normalization of left ventricular function and interval decrease in LGE (32).
Figure 10:
COVID-19 vaccine–associated myocarditis. Case example in a 27-year-old man with myocarditis 3 days following COVID-19 vaccine administration. Images from cardiac MRI performed at 1.5 T demonstrate subepicardial late gadolinium enhancement at the (A) basal to mid anterior lateral, inferior lateral, and inferior wall (red arrows), with (B) corresponding high T2 signal (orange arrows), (C) high regional native T1 (1173 msec), and (D) high regional native T2 (59 msec) on short-axis images. (Reprinted, with permission, from reference 29.)
Patel et al (33) compared clinical and cardiac MRI findings among 14 patients with myocarditis after mRNA COVID-19 vaccination and 14 patients with acute myocarditis from other causes. They found that patients with COVID-19 vaccination–associated acute myocarditis had better left ventricular ejection fraction, higher left ventricular global circumferential and radial strain, and less LGE. This is concordant with other studies demonstrating that the extent of myocardial injury in myocarditis after vaccination may be less severe compared with other causes (30).
Vascular Imaging
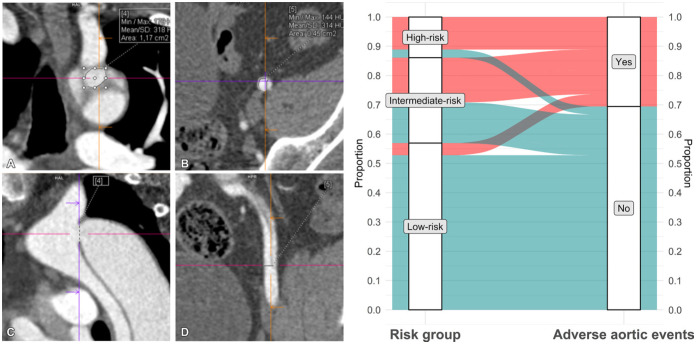
The long-term prognosis of patients with aortic dissection is of substantial clinical interest because of the potential for late complications resulting from chronic degeneration of the false lumen (34,35). However, the rate of false lumen dilatation is highly variable, making it challenging to prospectively identify high-risk patients who would benefit from thoracic surgical or endovascular aneurysm repair (34). Cuellar-Calabria et al (36) hypothesized that an increased false lumen pressure resulting from an imbalance in the size of proximal and distal tears would lead to a higher risk of late adverse events. The authors evaluated the difference in size between proximal and distal tears in 72 participants with aortic dissection who underwent CTA of the aorta in the subacute phase (9 weeks). Adverse events were defined as the occurrence of elective intervention, unexplained sudden death, or acute complications leading to surgical or endovascular treatment or death. Entry tear dominance (Fig 11), defined as a difference of greater than 1.2 cm2 between proximal and distal entry tears, was a significant predictor of adverse events (hazard ratio, 5.2 [95% CI: 2.1, 13]; P < .001). On the other hand, participants without entry tear dominance or any other associated risk factors, such as genetic aortic disease or a maximum aortic diameter greater than 45 mm, had a low risk of late adverse events (7%, three of 41) (Fig 11). This study suggests that imaging features may play a key role in formulating patient-specific strategies to predict the risk of late adverse events in aortic dissection (37).
Figure 11:
On the left: Multiplanar reconstructions of a CT angiographic study show (A, C) the proximal entry tear in the aortic isthmus and (B, D) the distal entry tear in the left external iliac artery in a 49-year-old man with an uncomplicated type B aortic dissection 3 months after discharge. Entry tears are measured in a double oblique en face view close to the (A) coronal plane in a 1.2-cm2 proximal tear and (B) in the axial plane in a 0.5-cm2 distal tear. (C) A sagittal plane of the arch and descending thoracic aorta and (D) a coronal plane of the left iliac artery are provided as references for tear location and plane adjustment. Crosshairs indicate the exact location of each tear in two planes. On the right: Distribution and rate of adverse events in study participants according to risk group. Only three of 41 participants in the low-risk group (7%), which comprised 57% of the total cohort (41 of 72), had a nonacute long-term aortic event (elective surgery). Max = maximum, Min = minimum. (Adapted, with permission, from reference 36.)
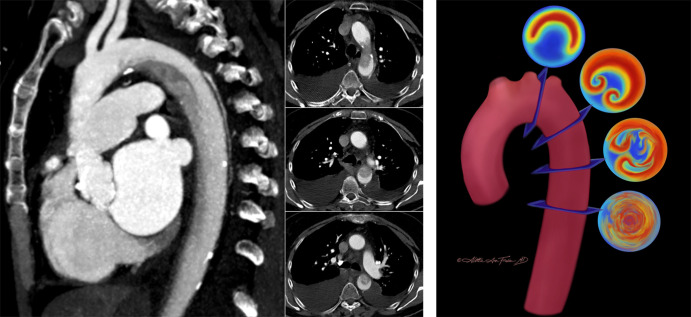
CTA is instrumental for the diagnosis and management of patients with suspected acute aortic syndrome. However, the unique structure of the aorta and its related hemodynamics can lead to the occurrence of flow-related artifacts that can mimic aortic injury. A case report by Ropp et al (38) showcased the “Dean effect,” an unusual artifact observed during early arterial phase imaging that can be mistaken for aortic disease. The artifact is caused by differences in blood flow velocities and vortex formations between the greater and lesser curvature of the aorta, resulting in a dissection flap–like interface between strongly enhanced and minimally enhanced blood in the proximal descending thoracic aorta; this occurs at the aortic arch because of a combination of the aortic curvature and specific flow conditions (38) (Fig 12). The authors recommend using the sagittal plane to reliably distinguish the artifact from pathologic conditions, as it best visualizes the layering of contrast material (Fig 12). Alternatively, repeat CTA with a longer delay could be considered.
Figure 12:
On the left: The “Dean effect” artifact in a 71-year-old woman with increasing dyspnea and a history of hypertension, atrial fibrillation, mitral regurgitation, and congestive heart failure (New York Heart Association grade IV) with an estimated ejection fraction of 20%. One sagittal (left) maximum intensity projection and three axial (right; 3.0-mm section thickness) contrast-enhanced (Omnipaque 350; GE Healthcare) CT angiographic images of the thorax through the level of the aortic arch in a narrowed and decentered soft-tissue window (convolutional kernel l40) demonstrate a flow-related artifact with distinct flow separation. This results in a heterogeneous hypoattenuation along the inner curvature of the arch due to incomplete mixing of unopacified blood with contrast material. The sagittal plane best demonstrates that the finding is artifactual. On the right: Artist’s conceptual illustration of the proposed process of flow perturbation and mixing of blood as it flows from the proximal aorta (superiormost cross section) to the descending aorta (inferiormost cross section). The highest-velocity flow (red) occurs at the outer curvature, while the lowest-velocity flow (blue) occurs at the inner curvature. This unique separation of differential flow velocities is the hypothesized origin of the artifact. As the Dean vortices form (second cross section) and begin to experience flow perturbation and mixing (third cross section), there is eventual flow velocity homogenization and a return to more normal laminar flow as the blood enters the straight tube of the descending aorta (fourth cross section). (Illustration reprinted, with permission, from Aletta Ann Frazier MD.) (Figures adapted, with permission, from reference 38.)
Although rare, acute aortic injuries can occur during invasive coronary angiography and percutaneous coronary interventions (39). Cappellini et al (4) reported a case series of four patients with iatrogenic aortic root injury who underwent postprocedural CTA. Most iatrogenic aortic injuries in this series occurred during intervention of the right coronary artery and were visible at CT as isolated subintimal contrast media staining in the aortic wall. All patients without imaging evidence of communication between the subintimal contrast media staining and the lumen of the aortic root had a favorable short-term prognosis, with complete resolution of the accumulation of undiluted contrast media. Notably, only one patient developed a type A dissection, which was attributed to underlying media degeneration. The authors recommended the use of electrocardiographically gated acquisition and a CTA protocol including nonenhanced and contrast-enhanced arterial phase images when catheterization-related aortic injury is suspected.
Thoracic Imaging
The widespread use of CT has resulted in a growing number of incidentally identified pulmonary nodules that require surgical resection. Intraoperative localization can be challenging depending on the size, location, and attenuation of the nodule. Radiologists can aid in the preoperative localization of pulmonary nodules by placing fiducial markers or microcoils under CT guidance (40).
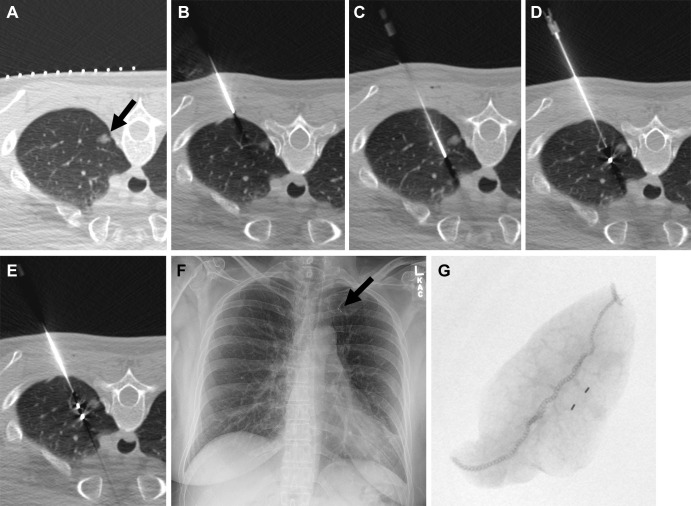
In a recent study, McDermott et al (41) retrospectively investigated success and complication rates of preoperative fiducial marker placement in 190 patients with pulmonary nodules (Fig 13) and demonstrated a 98.5% technical success rate, with only three of the 198 fiducial marker placement procedures performed being unsuccessful. Pneumothorax was the most frequent complication (n = 42, 21%), resolving spontaneously in most patients, with only 11 (6%) requiring a chest tube. Surgical resection of the nodules was successful in all but one patient (0.5%).
Figure 13:
Images in a 50-year-old woman with an incidentally detected, enlarging, 10-mm, left upper lobe, part-solid nodule proven to be adenocarcinoma (100% lepidic). (A) Preliminary axial CT image shows a left upper lobe nodule (arrow). (B) The coaxial introducer needle was advanced through the subcutaneous tissue to the pleura. (C) The needle was advanced deeply to the nodule. (D) The first 3-mm gold fiducial marker was deployed, and the needle was retracted. (E) The second fiducial marker was deployed with the nodule sandwiched between fiducial markers and the pleura. (F) Postprocedure radiograph demonstrates the two fiducial markers in the left upper lung (arrow). (G) Radiograph of the specimen with two fiducial markers in the specimen. (Reprinted, with permission, from reference 41.)
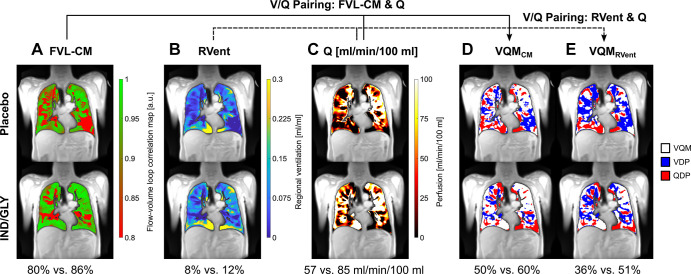
A retrospective study of cardiac left ventricular function in chronic obstructive pulmonary disease (ie, CLAIM study) trial data analyzed dynamic MRI data with the phase-resolved functional lung (PREFUL) technique in a subset of patients (n = 50) (42). PREFUL is an MRI postprocessing algorithm developed to quantify perfusion and ventilation dynamics. Voskrebenzev and Kaireit et al (42) found that PREFUL MRI helped identify treatment-related changes in chronic obstructive pulmonary disease. Compared with placebo, treatment with indacaterol-glycopyrronium increased mean flow-volume loop correlation (least squares mean treatment difference: 0.05 [95% CI: 0.03, 0.07], P < .0001) and reduced ventilation heterogeneity (least squares mean treatment difference: −0.05 [95% CI: −0.07, −0.03], P < .0001) (Fig 14).
Figure 14:
PREFUL MRI parameter maps following treatment with placebo and IND-GLY in one patient. Shown are the FVL-CM (see Figs 1 and 2 in reference 42), RVent, Q, VQMCM, and VQMRVent of one patient with COPD (man, 67 years old, postbronchodilator FEV1 at baseline of 31.6% and FEV1 postbronchodilator treatment of 36.7%, GOLD stage 3) for one coronal section located at the tracheal bifurcation. Note the difference between postplacebo and postbronchodilator treatment: (A) 80% versus 86% (FVL-CM), (B) 8% versus 12% (RVent), (C) 57 versus 85 mL/min/100 mL (Q), (D) 50% versus 60% (VQMCM), and (E) 36% versus 51% (VQMRVent), respectively. Ventilation and perfusion defects (VDP and QDP) were defined as values below threshold (Q < 20 mL/min/100 mL, FVL-CM < 0.9, RVent < 0.075). Images were acquired without contrast agent administration using a two-dimensional gradient-echo sequence in coronal orientation. COPD = chronic obstructive pulmonary disease, FVL-CM = flow-volume loop correlation map, GOLD = Global Initiative for Chronic Obstructive Lung Disease, IND/GLY = indacaterol-glycopyrronium, PREFUL = phase-resolved functional lung, Q = perfusion, QDP = perfusion defect percentage, RVent = regional ventilation, V = ventilation, VDP = ventilation defect percentage, V/Q = ventilation-perfusion, VQM = ventilation-perfusion match, VQMCM = ventilation-perfusion match with Q and FVL-CM, VQMRVent = ventilation-perfusion match with Q and RVent. (Adapted, with permission, from reference 42.)
Health Services Research
The COVID-19 pandemic has brought critical challenges in health care, including a worldwide shortage of iodinated contrast media. In a recent special report, Ananthakrishnan et al (43) discussed disruptions in the delivery of radiology services caused by the iodinated contrast media shortage and described strategies to address supply chain issues that can be implemented in a large academic center. The authors emphasized the importance of early engagement with health system leadership to establish a dedicated task force composed of all key stakeholders and ensure a coordinated response. Technical principles and tactics were suggested, such as repackaging commercially available containers of contrast media to better match needed volumes for clinical scans, adapting scanning protocols to match multiples of repacked contrast media aliquots, and using virtual monoenergetic reconstructions to improve contrast-to-noise ratio. The use of advanced CT scanner technology, such as spectral imaging and photon-counting CT, may offer additional opportunities to reduce contrast media dose (44).
Technological advancements and shifts in health care delivery models have led to changes in the use of cardiac imaging. Reeves et al (45) examined trends in the use of imaging among Medicare beneficiaries between 2010 and 2019. The patterns of noninvasive cardiac imaging use were analyzed among radiologists and cardiologists, focusing on the shifts among four main locations: physician offices, hospital outpatient departments, inpatient settings, and emergency departments. Overall imaging rates per 100 000 beneficiaries, aggregated by location and specialty, increased for cardiac PET (202 to 496, +146%), CCTA (169 to 312, +84%), and cardiac MRI (53 to 119, +125%). Conversely, the combined rate of transthoracic echocardiography, transesophageal echocardiography, and stress echocardiography decreased by 3% (23 911 to 23 188), while the number of transthoracic echocardiography examinations performed by emergency department providers surpassed those performed by cardiologists, likely because of the growing use of point-of-care US. Myocardial perfusion imaging rates declined (7817 to 4996, −36%) in physician offices and inpatient settings but increased in hospital outpatient departments (935 to 1598, +71%).
Future Perspectives
There is growing interest in clinical applications of artificial intelligence in thoracic and cardiovascular imaging, with ongoing research at different stages in the imaging value chain. Such applications include choosing an appropriate imaging test to improve diagnostic accuracy and direct risk prediction from cardiovascular imaging (46). The emergence of PCD CT has generated substantial interest in cardiovascular applications, with the potential to reduce radiation exposure and enhance image quality (47,48).
Conclusion
The field of cardiothoracic imaging is constantly advancing and has potential to improve diagnostic accuracy and patient outcomes for a wide range of cardiovascular and thoracic diseases. As research continues to evolve, we can expect to see even more sophisticated imaging tools and techniques that may greatly benefit patients and radiologists alike.
Authors declared no funding for this work.
Disclosures of conflicts of interest: D.M. Grants or contracts from the National Institute of Biomedical Imaging and Bioengineering (no. 5T32EB009035); consulting fees from Segmed; stock or stock options in Segmed; member of Radiology: Cardiothoracic Imaging trainee editorial board. G.J.A. Member of Radiology: Cardiothoracic Imaging trainee editorial board. K.G.O. Payment or honoraria from Grand Rounds for lectures, presentations, speakers bureaus, manuscript writing, or educational events; president of the Society of Cardiovascular Magnetic Resonance; associate editor for Radiology: Cardiothoracic Imaging. D.V. Treasurer of the North American Society for Cardiovascular Imaging; member of Radiology: Cardiothoracic Imaging editorial board; mentor for Radiology: Cardiothoracic Imaging trainee editorial board. D.F. Deputy editor for Radiology: Cardiothoracic Imaging. S.A. Royalties from Elsevier for textbook authorship; member of the board of directors of the Society of Cardiovascular Computed Tomography; editor of Radiology: Cardiothoracic Imaging. K.H. Payment or honoraria from Sanofi Genzyme for lectures, presentations, speakers bureaus, manuscript writing, or educational events; associate editor and trainee editorial board lead for Radiology: Cardiothoracic Imaging.
Abbreviations:
- CAD
- coronary artery disease
- CAD-RADS
- Coronary Artery Disease Reporting and Data System
- CCTA
- coronary CT angiography
- EID
- energy-integrating dectector
- LGE
- late gadolinium enhancement
- MAPCA
- major aortopulmonary collateral artery
- MBF
- myocardial blood flow
- MBFCT
- CT-derived MBF
- MBFPET
- PET-derived MBF
- MI
- myocardial infarction
- PCD CT
- photon-counting detector CT
- PREFUL
- phase-resolved functional lung
- TAVR
- transcatheter aortic valve replacement
References
- 1. Gulati M , Levy PD , Mukherjee D , et al . 2021 AHA/ACC/ASE/CHEST/SAEM/SCCT/SCMR Guideline for the Evaluation and Diagnosis of Chest Pain: Executive Summary: A Report of the American College of Cardiology/American Heart Association Joint Committee on Clinical Practice Guidelines . Circulation 2021. ; 144 ( 22 ): e368 – e454 . [DOI] [PubMed] [Google Scholar]
- 2. Cury RC , Leipsic J , Abbara S , et al . CAD-RADS™ 2.0 - 2022 Coronary Artery Disease - Reporting and Data System An Expert Consensus Document of the Society of Cardiovascular Computed Tomography (SCCT), the American College of Cardiology (ACC), the American College of Radiology (ACR) and the North America Society of Cardiovascular Imaging (NASCI) . Radiol Cardiothorac Imaging 2022. ; 4 ( 5 ): e220183 . [DOI] [PMC free article] [PubMed] [Google Scholar]
- 3. DeFilippis AP , Chapman AR , Mills NL , et al . Assessment and treatment of patients with type 2 myocardial infarction and acute nonischemic myocardial injury . Circulation 2019. ; 140 ( 20 ): 1661 – 1678 . [DOI] [PMC free article] [PubMed] [Google Scholar]
- 4. Cappellini LA , Eberhard M , Templin C , Vogt PR , Manka R , Alkadhi H . Iatrogenic aortic root injury from coronary interventions: early and follow-up CT imaging findings . Radiol Cardiothorac Imaging 2021. ; 3 ( 6 ): e210241 . [DOI] [PMC free article] [PubMed] [Google Scholar]
- 5. Meah MN , Bularga A , Tzolos E , et al . Distinguishing type 1 from type 2 myocardial infarction by using CT coronary angiography . Radiol Cardiothorac Imaging 2022. ; 4 ( 5 ): e220081 . [DOI] [PMC free article] [PubMed] [Google Scholar]
- 6. Indraratna P , Naoum C , Ben Zekry S , et al . Aspirin and statin therapy for nonobstructive coronary artery disease: five-year outcomes from the CONFIRM Registry . Radiol Cardiothorac Imaging 2022. ; 4 ( 2 ): e210225 . [DOI] [PMC free article] [PubMed] [Google Scholar]
- 7. Aquino GJ , Decker JA , Schoepf UJ , et al . Feasibility of coronary CT angiography-derived left ventricular long-axis shortening as an early marker of ventricular dysfunction in transcatheter aortic valve replacement . Radiol Cardiothorac Imaging 2022. ; 4 ( 3 ): e210205 . [DOI] [PMC free article] [PubMed] [Google Scholar]
- 8. Tzimas G , Gulsin GS , Takagi H , et al . Coronary CT angiography to guide percutaneous coronary intervention . Radiol Cardiothorac Imaging 2022. ; 4 ( 1 ): e210171 . [DOI] [PMC free article] [PubMed] [Google Scholar]
- 9. Bom MJ , van Diemen PA , Driessen RS , et al . Prognostic value of [15O]H2O positron emission tomography-derived global and regional myocardial perfusion . Eur Heart J Cardiovasc Imaging 2020. ; 21 ( 7 ): 777 – 786 . [DOI] [PubMed] [Google Scholar]
- 10. Patel AR , Salerno M , Kwong RY , Singh A , Heydari B , Kramer CM . Stress cardiac magnetic resonance myocardial perfusion imaging: JACC review topic of the week . J Am Coll Cardiol 2021. ; 78 ( 16 ): 1655 – 1668 . [DOI] [PMC free article] [PubMed] [Google Scholar]
- 11. Kitagawa K , Nakamura S , Ota H , et al . Diagnostic performance of dynamic myocardial perfusion imaging using dual-source computed tomography . J Am Coll Cardiol 2021. ; 78 ( 20 ): 1937 – 1949 . [DOI] [PubMed] [Google Scholar]
- 12. Takafuji M , Kitagawa K , Ishida M , et al . Clinical validation of the accuracy of absolute myocardial blood flow quantification with dual-source CT using 15O-Water PET . Radiol Cardiothorac Imaging 2021. ; 3 ( 5 ): e210060 . [DOI] [PMC free article] [PubMed] [Google Scholar]
- 13. Si-Mohamed SA , Boccalini S , Lacombe H , et al . Coronary CT angiography with photon-counting CT: first-in-human results . Radiology 2022. ; 303 ( 2 ): 303 – 313 . [DOI] [PubMed] [Google Scholar]
- 14. Willemink MJ , Persson M , Pourmorteza A , Pelc NJ , Fleischmann D . Photon-counting CT: technical principles and clinical prospects . Radiology 2018. ; 289 ( 2 ): 293 – 312 . [DOI] [PubMed] [Google Scholar]
- 15. Rajagopal JR , Farhadi F , Richards T , et al . Evaluation of coronary plaques and stents with conventional and photon-counting CT: benefits of high-resolution photon-counting CT . Radiol Cardiothorac Imaging 2021. ; 3 ( 5 ): e210102 . [DOI] [PMC free article] [PubMed] [Google Scholar]
- 16. Decker JA , O’Doherty J , Schoepf UJ , et al . Stent imaging on a clinical dual-source photon-counting detector CT system-impact of luminal attenuation and sharp kernels on lumen visibility . Eur Radiol 2023. ; 33 ( 4 ): 2469 – 2477 . [DOI] [PubMed] [Google Scholar]
- 17. Alex A , Ayyappan A , Valakkada J , Kramadhari H , Sasikumar D , Menon S . Major aortopulmonary collateral arteries . Radiol Cardiothorac Imaging 2022. ; 4 ( 1 ): e210157 . [DOI] [PMC free article] [PubMed] [Google Scholar]
- 18. Puricelli F , Voges I , Gatehouse P , et al . Performance of cardiac MRI in pediatric and adult patients with fontan circulation . Radiol Cardiothorac Imaging 2022. ; 4 ( 3 ): e210235 . [DOI] [PMC free article] [PubMed] [Google Scholar]
- 19. Lam CZ , David D , Acosta Izquierdo L , et al . MRI phase-contrast blood flow in fasting pediatric patients with Fontan circulation correlates with exercise capacity . Radiol Cardiothorac Imaging 2022. ; 4 ( 2 ): e210303 . [DOI] [PMC free article] [PubMed] [Google Scholar]
- 20. Raimondi F , Martins D , Coenen R , et al . Prevalence of venovenous shunting and high-output state quantified with 4D flow MRI in patients with Fontan circulation . Radiol Cardiothorac Imaging 2021. ; 3 ( 6 ): e210161 . [DOI] [PMC free article] [PubMed] [Google Scholar]
- 21. Warnica W , Al-Arnawoot A , Stanimirovic A , et al . Clinical impact of cardiac MRI T1 and T2 parametric mapping in patients with suspected cardiomyopathy . Radiology 2022. ; 305 ( 2 ): 319 – 326 . [DOI] [PubMed] [Google Scholar]
- 22. François CJ , Barton GP , Corrado PA , et al . Diffuse myocardial fibrosis at cardiac MRI in young adults born prematurely: a cross-sectional cohort study . Radiol Cardiothorac Imaging 2022. ; 4 ( 3 ): e210224 . [DOI] [PMC free article] [PubMed] [Google Scholar]
- 23. Hopman LHGA , Bhagirath P , Mulder MJ , et al . Extent of left atrial fibrosis correlates with descending aorta proximity at 3D late gadolinium enhancement cardiac MRI in patients with atrial fibrillation . Radiol Cardiothorac Imaging 2022. ; 4 ( 1 ): e210192 . [DOI] [PMC free article] [PubMed] [Google Scholar]
- 24. Isaak A , Kravchenko D , Mesropyan N , et al . Layer-specific strain analysis with cardiac MRI feature tracking in acute myocarditis . Radiol Cardiothorac Imaging 2022. ; 4 ( 3 ): e210318 . [DOI] [PMC free article] [PubMed] [Google Scholar]
- 25. Simpson S , Kay FU , Abbara S , et al . Radiological Society of North America Expert Consensus Document on Reporting Chest CT Findings Related to COVID-19: Endorsed by the Society of Thoracic Radiology, the American College of Radiology, and RSNA . Radiol Cardiothorac Imaging 2020. ; 2 ( 2 ): e200152 . [DOI] [PMC free article] [PubMed] [Google Scholar]
- 26. Yang R , Li X , Liu H , et al . Chest CT severity score: an imaging tool for assessing severe COVID-19 . Radiol Cardiothorac Imaging 2020. ; 2 ( 2 ): e200047 . [DOI] [PMC free article] [PubMed] [Google Scholar]
- 27. Wassenaar JW , Clark DE , Dixon DD , et al . Reduced circumferential strain in athletes with prior COVID-19 . Radiol Cardiothorac Imaging 2022. ; 4 ( 4 ): e210310 . [DOI] [PMC free article] [PubMed] [Google Scholar]
- 28. Hanneman K , Houbois C , Schoffel A , et al . Combined cardiac fluorodeoxyglucose-positron emission tomography/magnetic resonance imaging assessment of myocardial injury in patients who recently recovered from COVID-19 . JAMA Cardiol 2022. ; 7 ( 3 ): 298 – 308 . [DOI] [PMC free article] [PubMed] [Google Scholar]
- 29. Sanchez Tijmes F , Thavendiranathan P , Udell JA , Seidman MA , Hanneman K . Cardiac MRI assessment of nonischemic myocardial inflammation: state of the art review and update on myocarditis associated with COVID-19 vaccination . Radiol Cardiothorac Imaging 2021. ; 3 ( 6 ): e210252 . [DOI] [PMC free article] [PubMed] [Google Scholar]
- 30. Fronza M , Thavendiranathan P , Chan V , et al . Myocardial injury pattern at MRI in COVID-19 vaccine-associated myocarditis . Radiology 2022. ; 304 ( 3 ): 553 – 562 . [DOI] [PMC free article] [PubMed] [Google Scholar]
- 31. Sanchez Tijmes F , Zamorano A , Thavendiranathan P , Hanneman K . Imaging of myocarditis following mRNA COVID-19 booster vaccination . Radiol Cardiothorac Imaging 2022. ; 4 ( 2 ): e220019 . [DOI] [PMC free article] [PubMed] [Google Scholar]
- 32. Fronza M , Thavendiranathan P , Karur GR , et al . Cardiac MRI and clinical follow-up in COVID-19 vaccine-associated myocarditis . Radiology 2022. ; 304 ( 3 ): E48 – E49 . [DOI] [PMC free article] [PubMed] [Google Scholar]
- 33. Patel YR , Shah NR , Lombardi K , et al . Cardiac MRI findings in male patients with acute myocarditis in the presence or absence of COVID-19 vaccination . Radiol Cardiothorac Imaging 2022. ; 4 ( 3 ): e220008 . [DOI] [PMC free article] [PubMed] [Google Scholar]
- 34. Fleischmann D , Afifi RO , Casanegra AI , et al . Imaging and surveillance of chronic aortic dissection: a scientific statement from the American Heart Association . Circ Cardiovasc Imaging 2022. ; 15 ( 3 ): e000075 . [DOI] [PubMed] [Google Scholar]
- 35. Shen J , Mastrodicasa D , Al Bulushi Y , et al . Thoracic endovascular aortic repair for chronic type B aortic dissection: pre- and postprocedural imaging . RadioGraphics 2022. ; 42 ( 6 ): 1638 – 1653 . [DOI] [PubMed] [Google Scholar]
- 36. Cuellar-Calabria H , Burcet G , Roque A , et al . Differences in the area of proximal and distal entry tears at CT angiography predict long-term clinical outcomes in aortic dissection . Radiol Cardiothorac Imaging 2021. ; 3 ( 6 ): e210029 . [DOI] [PMC free article] [PubMed] [Google Scholar]
- 37. Mastrodicasa D , Willemink MJ , Turner VL , et al . Registry of Aortic Diseases to Model Adverse Events and Progression (ROADMAP) in Uncomplicated Type B Aortic Dissection: Study Design and Rationale . Radiol Cardiothorac Imaging 2022. ; 4 ( 6 ): e220039 . [DOI] [PMC free article] [PubMed] [Google Scholar]
- 38. Ropp A , Frazier AA , Gelfand B , Jeudy J . The Dean effect: an aortic arch flow artifact mimicking dissection . Radiol Cardiothorac Imaging 2022. ; 4 ( 1 ): e210229 . [DOI] [PMC free article] [PubMed] [Google Scholar]
- 39. Hanneman K , Chan FP , Mitchell RS , Miller DC , Fleischmann D . Pre- and postoperative imaging of the aortic root . RadioGraphics 2016. ; 36 ( 1 ): 19 – 37 . [DOI] [PMC free article] [PubMed] [Google Scholar]
- 40. Rodrigues JCL , Pierre AF , Hanneman K , et al . CT-guided microcoil pulmonary nodule localization prior to video-assisted thoracoscopic surgery: diagnostic utility and recurrence-free survival . Radiology 2019. ; 291 ( 1 ): 214 – 222 . [DOI] [PubMed] [Google Scholar]
- 41. McDermott S , Frenk NE , Fintelmann FJ , et al . Preoperative CT-guided fiducial marker placement for surgical localization of pulmonary nodules . Radiol Cardiothorac Imaging 2022. ; 4 ( 1 ): e210194 . [DOI] [PMC free article] [PubMed] [Google Scholar]
- 42. Voskrebenzev A , Kaireit TF , Klimeš F , et al . PREFUL MRI depicts dual bronchodilator changes in COPD: a retrospective analysis of a randomized controlled trial . Radiol Cardiothorac Imaging 2022. ; 4 ( 2 ): e210147 . [DOI] [PMC free article] [PubMed] [Google Scholar]
- 43. Ananthakrishnan L , Kay FU , Zeikus EA , et al . What the baby formula and medical contrast material shortages have in common: insights and recommendations for managing the iodinated contrast media shortage . Radiol Cardiothorac Imaging 2022. ; 4 ( 3 ): e220101 . [DOI] [PMC free article] [PubMed] [Google Scholar]
- 44. Emrich T , O’Doherty J , Schoepf UJ , et al . Reduced iodinated contrast media administration in coronary CT angiography on a clinical photon-counting detector CT system: a phantom study using a dynamic circulation model . Invest Radiol 2023. ; 58 ( 2 ): 148 – 155 . [DOI] [PubMed] [Google Scholar]
- 45. Reeves RA , Halpern EJ , Rao VM . Cardiac imaging trends from 2010 to 2019 in the medicare population . Radiol Cardiothorac Imaging 2021. ; 3 ( 5 ): e210156 . [DOI] [PMC free article] [PubMed] [Google Scholar]
- 46. Koetzier LR , Mastrodicasa D , Szczykutowicz TP , et al . Deep learning image reconstruction for CT: technical principles and clinical prospects . Radiology 2023. ; 306 ( 3 ): e221257 . [DOI] [PMC free article] [PubMed] [Google Scholar]
- 47. Aquino GJ , O’Doherty J , Schoepf UJ , et al . Myocardial characterization with extracellular volume mapping with a first-generation photon-counting detector CT with MRI reference . Radiology 2023. ; 307 ( 2 ): e222030 . [DOI] [PubMed] [Google Scholar]
- 48. Higashigaito K , Mergen V , Eberhard M , et al . CT angiography of the aorta using photon-counting detector CT with reduced contrast media volume . Radiol Cardiothorac Imaging 2023. ; 5 ( 1 ): e220140 . [DOI] [PMC free article] [PubMed] [Google Scholar]


