

Abstract
Multiplexed protein detection is critical for improving the drug and biomarkers screening efficiency. Here we show that multiplexed protein detection and parallel protein interaction analysis can be realized by evanescent scattering microscopy (ESM). ESM enables binding kinetics measurement with label-free digital single-molecule counting. We implemented an automatic single-molecule counting strategy with high temporal resolution to precisely determine the binding time, which improves the counting efficiency and accuracy. We show that digital single-molecule counting can recognize proteins with different molecular weights, thus making it possible to monitor the protein binding processes in the solution by real time tracking the numbers of free and bound proteins landing on the sensor surface. Furthermore, we show that this strategy can simultaneously analyze the kinetics of two different protein interaction processes on the surface and in the solution. This work may pave a way to investigate complicated protein interactions, such as the competition of biomarker-antibody binding in biofluid with biomarker-protein binding on the cellular membrane.
Graphical Abstract
Introduction
Protein plays a key role in the structures and activities of living systems. Determining the proteins and their interactions is critical for drug screening1,2, clinical biomarker analysis3,4, and understanding the biological processes at the molecular level5,6. Diverse technologies have been developed for protein analysis, including mass spectrometry7, enzyme-linked immunosorbent assay8, western blot9, and surface plasmon resonance (SPR)10,11. However, these traditional techniques usually only provide ensemble measurement results and lack the capability to analyze the highly heterogeneous proteins at a level of detail. In the recent decade, label-free single-molecule imaging approaches have been developed to push beyond ensemble averages and conduct the statistical analysis of intrinsic protein properties such as molecular weight and binding processes. These techniques include interferometric scattering microscopy (iSCAT)12–18, photothermal microscopy19,20, and recently developed plasmonic scattering microscopy (PSM)21–24 and evanescent scattering microscopy (ESM)25. Among these technologies, the ESM presents distinct advantages. In contrast to iSCAT and photothermal microscopy, which employ conventional illuminations, the ESM utilizes evanescent illuminations for enhanced light-analyte interactions and is immune to the interference of molecules and impurities in the bulk solution. ESM does not rely on the excitation of plasmonic waves on noble metal films, such as gold film, as do other types of evanescent detection methods, such as PSM. This eliminates the need for costly consumables and the strong heating effect that gold produces under high incident intensity, both of which are required to achieve the necessary signal-to-noise ratio in single molecule detection.
In our previous work, we measured single pair protein-protein binding kinetics and single molecule effective spring constant to the surface using ESM25. To discover the weak single-molecule signal, we remove the strong but static backgrounds with differential processing, which is performed by subtracting or dividing one frame by the previous frame. Averaging of multiple frames over a hundred millisecond time interval prior to the differential step is required to suppress the shot noise at the same time. However, since the molecular binding events are randomly distributed in time, the differential signal depends on the temporal location of the event within the averaged frames. An error will be introduced when we select the wrong frames for averaging and differential. For example, if one molecule binds to the surface in the middle of an average period, the extracted binding signal will be reduced to half. This data processing error limits the system precision in recognizing the proteins with different molecular weights in a mixed sample and in analyzing the kinetics of binding processes, which relies on digitally counting of the binding events over time.
Here, we present an automatic single-molecule counting algorithm for ESM that uses moving average and time tracking approaches to determine the time point of binding events with the temporal resolution of the camera exposure time. It has been shown that the moving average is important for obtaining the single-molecule signals precisely in iSCAT12,26,27. By processing the same experimental data, this algorithm shows that it misses few events and provides more precise image intensity than the classical algorithm. Next, we show that this algorithm can recognize proteins with different molecular weights, thus allowing for monitoring the kinetics of protein binding in solution phase by tracking the numbers of free protein and bound protein complex hitting on the sensor surface, providing one approach for multiplexed protein analysis. Furthermore, we show that this strategy can simultaneously analyze the kinetics of two protein interaction processes on the surface and in the solutions, providing one approach for parallel binding kinetics analysis.
Results
Algorithm principle.
ESM system is employed in this study. The 450 nm laser is conditioned to illuminate one indium tin oxide (ITO) coated cover glass with an incident angle of ~65° through a 60x objective. The incident angle is larger than the critical angle to excite evanescent waves on the surface (Figure 1a)25. A 50x objective is placed on the top of ITO-coated cover glass to collect the evanescent waves scattered by proteins and surface roughness to form the ESM images.
Figure 1. System and image processing principles.
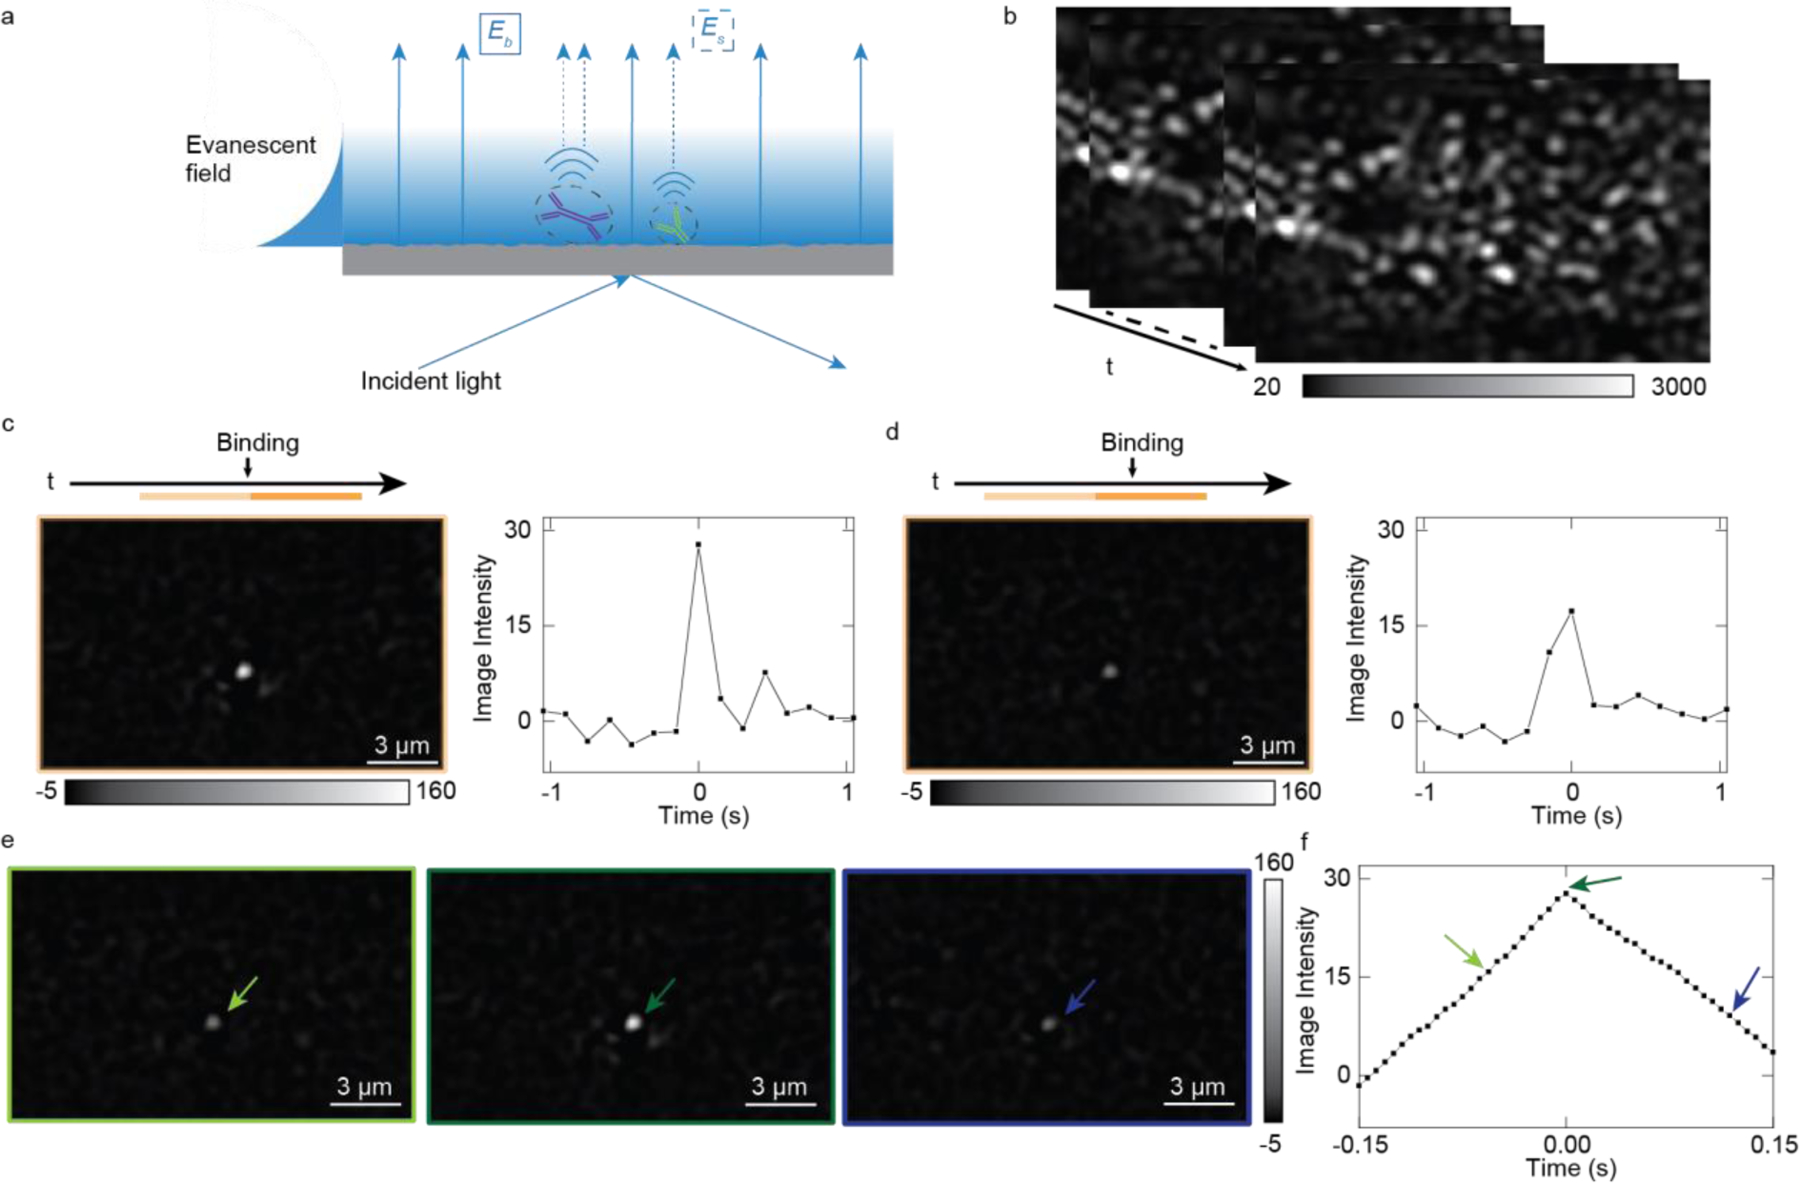
(a) The ESM schematic, incident light creates an evanescent field on the surface, and scattering light of protein (Es) and glass surface (Eb) are collected by the top-mounted objective (not shown). (b) ESM raw image sequence. (c) Single protein image after data processing with the correct estimation of the protein binding time in (b), where the light and dark, orange-colored bar above the image indicate the selected time zone for the single protein analysis. The binding time is in the middle of two image stacks. The differential between averaged images from the dark zone and light zone reveals the protein binding. (d) Single protein image after data processing with the wrong estimation of the protein binding time, leading to miscalculation of image intensity. By moving-average the raw image sequence with single frame steps, a protein binding event obtained from the differential of the two averaged images will have an intensity profile that firstly increases and then decreases (e, f), arrows in the (f) correspond to the images in the (e) with the same color.
To suppress the shot noise, the raw images recorded at 160 frames per second (fps) are firstly averaged over time, where the average period is configured to be ~150 ms (Figure S2). Traditionally, the binding image was obtained by implementing a differential process subtracting the previous frame from the present frame, where a binding event appears as a bright spot (Figure 1c). When a protein bind to the surface, all pixel values within the Airy disk pattern are summed up at the binding site as the image intensity22. However, this approach is usually accompanied with image intensity fluctuations over binding time because the protein binding event usually does not ideally happen in the middle of two consecutive averaging stacks, leading to inaccurate estimation of the single-molecule signal intensities (Figure 1d).
To determine the single-molecule signal more accurately, we scan the binding event in the raw image sequence with a 150 ms moving average window at a single frame step (6.25 ms) to precisely estimate the binding time. This frame step is fixed for the following experiments except else mentioned. Starting with the first frame, we average the two sequential image stacks (frames 1 to n and frames n+1 to 2n) without image overlapping to generate two averaged images. The averaging is performed for each pixel in the time domain with an average period of 150 ms. Next, we subtract the first averaged image from the second averaged one, obtaining the differential image. The signal change, such as a binding or unbinding event, will be shown in a differential image as a bright or dark spot, respectively. Finally, we repeat the above steps sequentially on every subsequent frame in the raw image sequence. For a protein binding to the surface event, the moving-averaging-and-differential process will generate an increase-then-decrease intensity profile in the binding site (Figure 1e, f) with temporal resolution equal to the duration of single frame exposure time. The maximum intensity in the middle of the intensity profile is the true protein intensity, which exactly locates the binding time in the middle of two averaging stacks.
System Calibration.
IgG (150kDa), IgA (385kDa), and IgM (950kDa) were measured separately in the experiment to calibrate the ESM system. Protein in phosphate-buffered saline (PBS) buffer was flowed over the chip. The raw image sequence was recorded over time for each measurement. In order to distinguish between each binding event, we set the protein concentration to be no more than 10 nM so that the protein binding events are sparse in space and time (Method). Under this condition, we can differentiate two binding events occurring simultaneously if their distance exceeds the system resolution, which is 536 nm (Note S1). If the distance between two binding locations is smaller than 536 nm, two binding events still can be identified if their binding time interval is higher than 150ms average time. If two molecules bind onto the surface simultaneously with the distance smaller than 536 nm, they produce one bright spot with the binding intensity that is twice as intense as single-molecule binding. In this case, we cannot resolve the individual binding events, however, this is a rare case with 10 nM or lower concentration17. Figure 2a–c shows protein binding images after moving-averaging and differential data processing. We constructed the histograms by tracking each protein binding event and obtained each protein intensity. Gaussian fitting was applied to the histogram to obtain the mean intensity of the protein. We received 867 binding events with ~21% higher protein intensities and ~125% more binding numbers than data processing without time-scanning (Figure S3). After getting the mean intensity of each protein type, a calibration curve of protein mass versus image intensity was made. As expected, the calibration curve reveals a linear relationship between protein mass and image intensity.
Figure 2. System calibration.
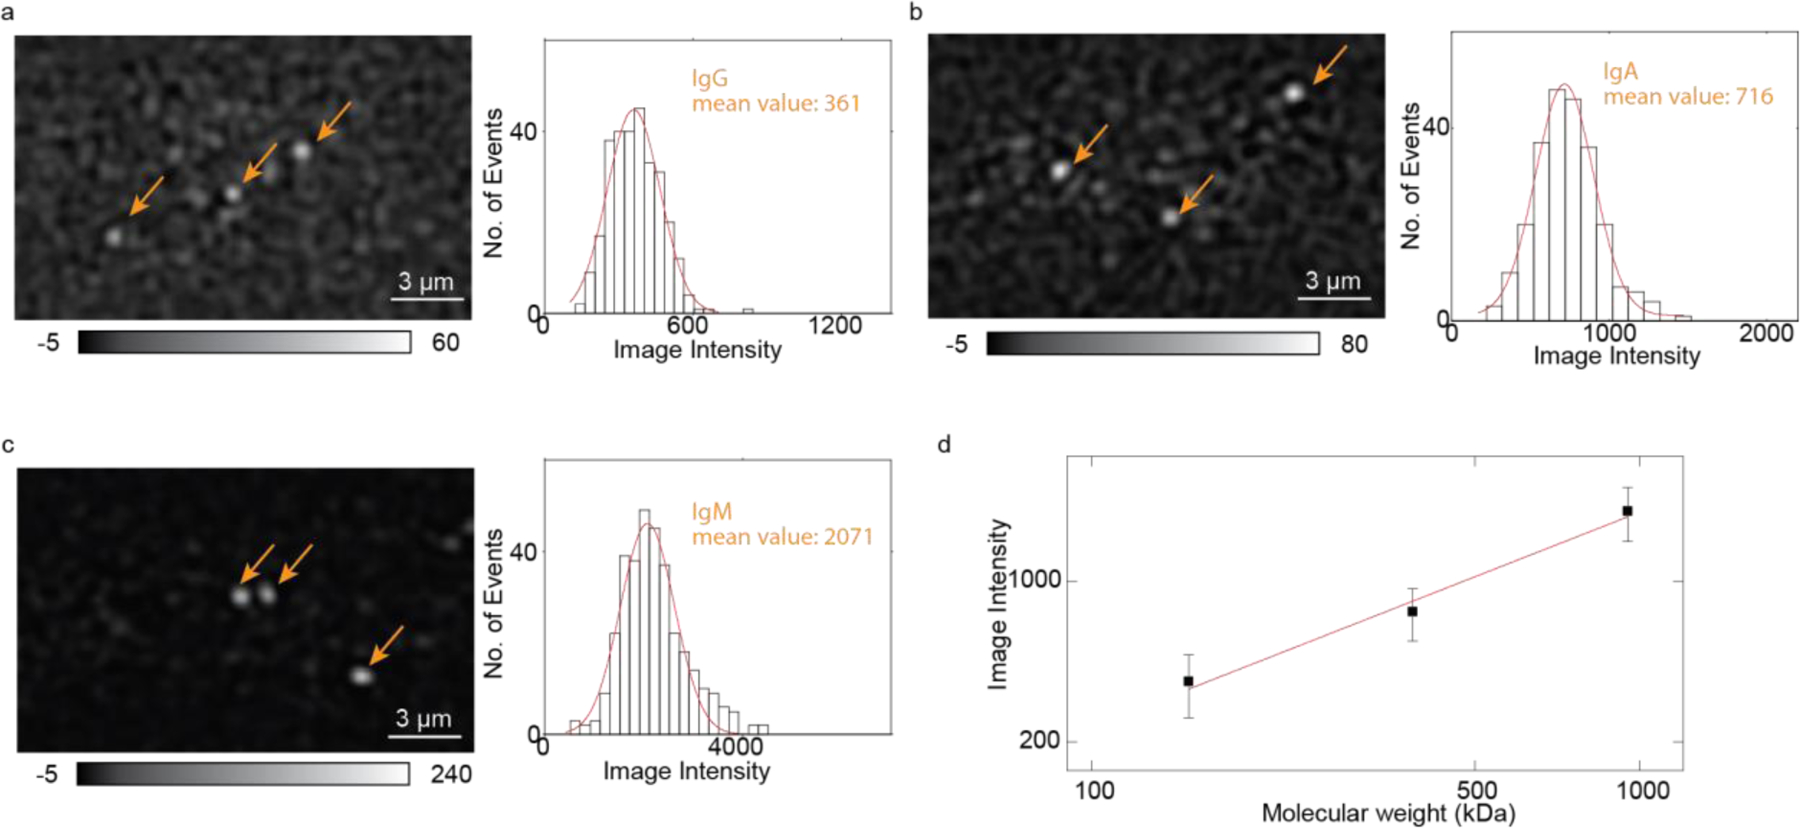
(a-c) IgG, IgA, and IgM images (after image processing) and intensity histogram. Orange arrows indicate the binding spots. The red curve is the Gaussian fitting. (d) ESM intensity versus protein mass. The image intensities are obtained from the histograms of each protein in (b-d). The error bars indicate the standard deviation of Gaussian fitting.
Binding kinetics of IgM to anti-IgM on the surface.
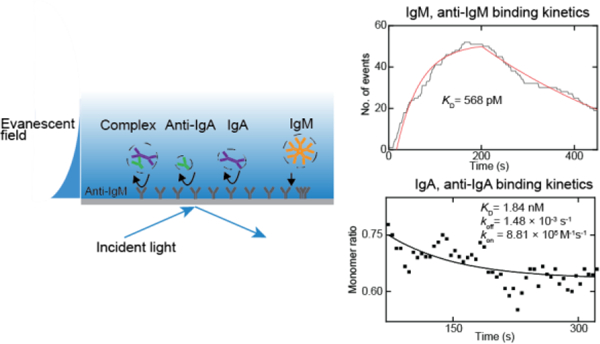
To demonstrate the capability of ESM measuring protein binding kinetics with antibodies surface-immobilized approach, we performed IgM and anti-IgM binding kinetics measurement with anti-IgM modified on the surface. The specific binding between anti-IgM and IgM is confirmed by ensemble SPR measurement (Figure S4). We first flowed 2.5 nM IgM solution over the chip for IgM association with the antibodies immobilized on the surface, then flowed PBS buffer over the surface to allow the dissociation of IgM. We tracked the binding and unbinding events of the IgM in real time and plotted the bound IgM numbers versus time to form the binding kinetics curves21,22 (Figure 3b). The fitting of the curves with the first-order binding kinetics model determines the association (kon) and dissociation (koff) rate constants, which are 1.66 × 10⁶ M−1 s−1 and 9.46 × 10⁻⁴ s−1, respectively. From kon and koff, the equilibrium dissociation constant (KD = koff / kon) is determined to be 570 pM. These values are in good agreement with the results measured with the ensemble SPR (Figure S4). We collected individual protein binding intensity and made the histogram. The mean intensity of binding proteins is consistent with what we obtained in the calibration experiment (Figure 3c), confirming the single IgM detection.
Figure 3. Analysis of IgM binding to anti-IgM on the surface.
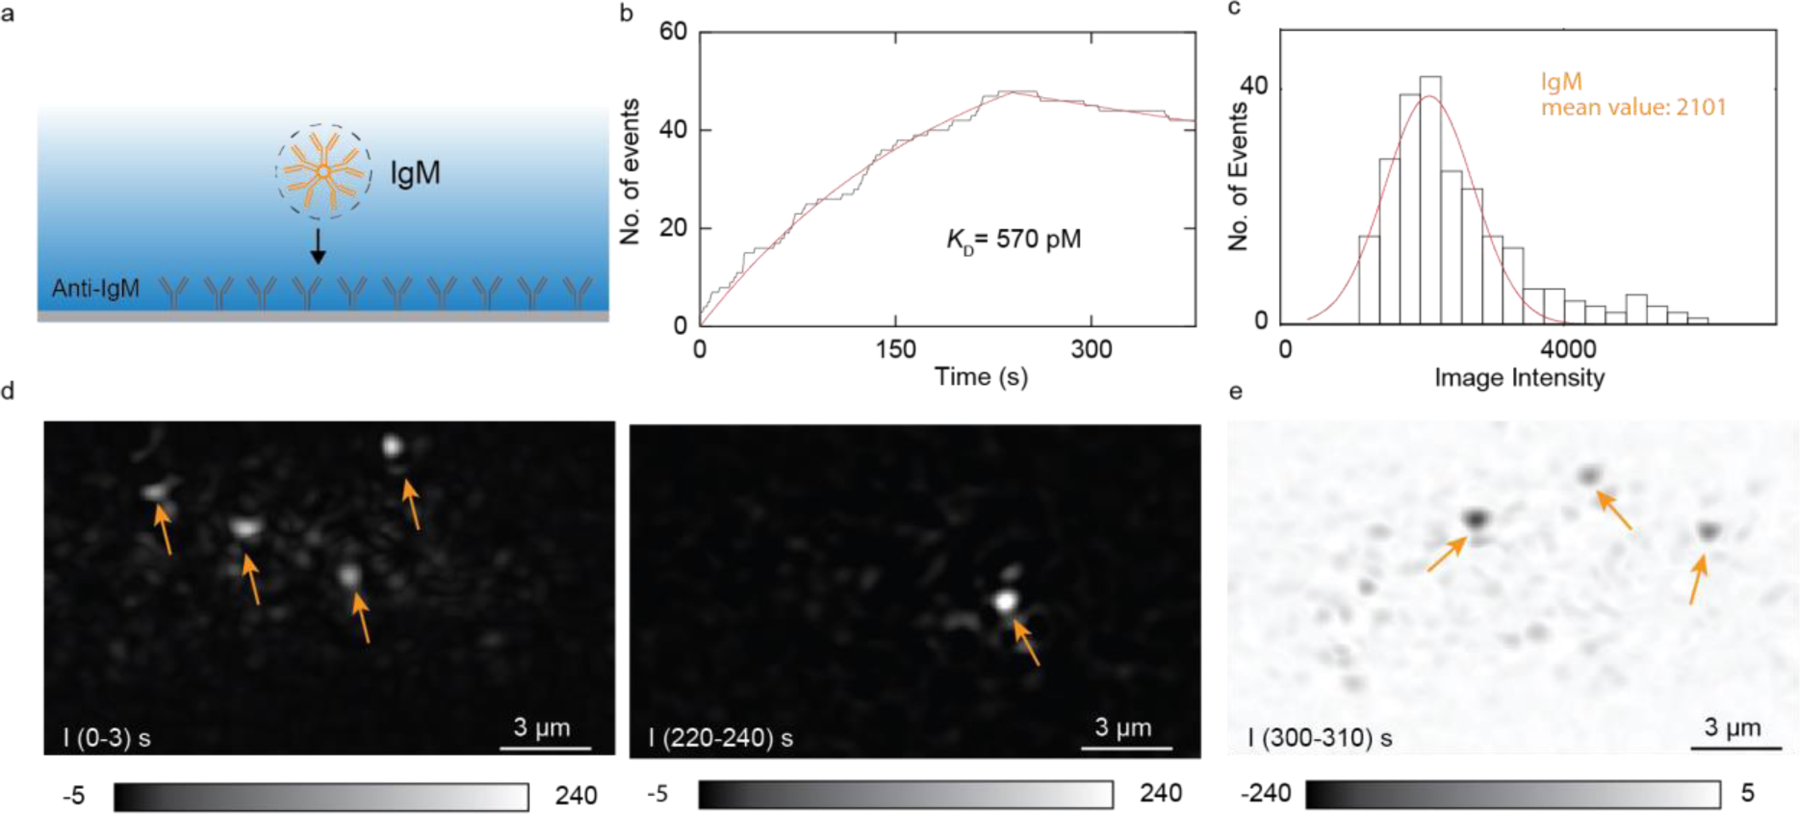
(a) Schematic of the experiment. (b) Accumulated counts of bound IgM molecules (black line) and first-order binding kinetic fitting (red line). (c) Histogram of IgM binding intensity. Gaussian fitting (red curve) shows the distribution and mean intensity. The histogram is obtained from 3 experiments. (d) Differential images show IgM binds to the surface at two different times. Arrows point to binding IgM spots. (e) IgM unbinds from the surface. Arrows point to unbinding spots.
Binding kinetics of IgA to anti-IgA in free solution.
We demonstrate that ESM can measure free solution protein-protein interaction through counting the protein landing events to the sensor surface. Considering the process of two monomer species forming the complex in the solution, over time, the concentration of monomers will decrease, and the concentration of the complex will increase. By simultaneously counting the random landing events of the monomer and the complex to the surface, we disclosed the free monomer ratio as a function of time in the solution and calculated the binding kinetics. In the experiment, we modified the ITO surface with bovine serum albumin (BSA), which is a commonly used surface blocker. In this way, the probability of protein landing on the surface scales with the concentration of the protein in the solution. The protein solution was prepared with 5 nM anti-IgA mixed with 5 nM IgA. Then the protein solution was flowed over the BSA chip immediately after the mixing. We tracked the protein landing events in real time. Anti-IgA, IgA, and complex are distinguished based on their image intensity, and their counts are accumulated over time separately. The IgA monomer solution abundance was calculated from the protein counting numbers (Method). During the experiment, few complexes were detected in the first minute (Figure 4c), and the monomer ratio was close to one. In the third minute, more complexes were detected, and the monomer ratio was close to 0.5 (Figure 4d). We chose a one-minute time window for accumulating the count number and a five-second moving step. The solution abundance of IgA monomer was calculated as a function of time based on counts. The ratio of monomer IgA versus time is shown in Figure 4e. The solid curve shows the fitting result of the monomer ratio decay (Method). We obtained KD = 839 pM from the fitting, which is in good agreement with our previous experiment21, with koff = 1.73 × 10⁻³ s−1 and kon = 2.18 × 10⁶ M−1s−1.
Figure 4. Detection of anti-IgA and IgA interaction in the free solution through surface nonspecific bindings.
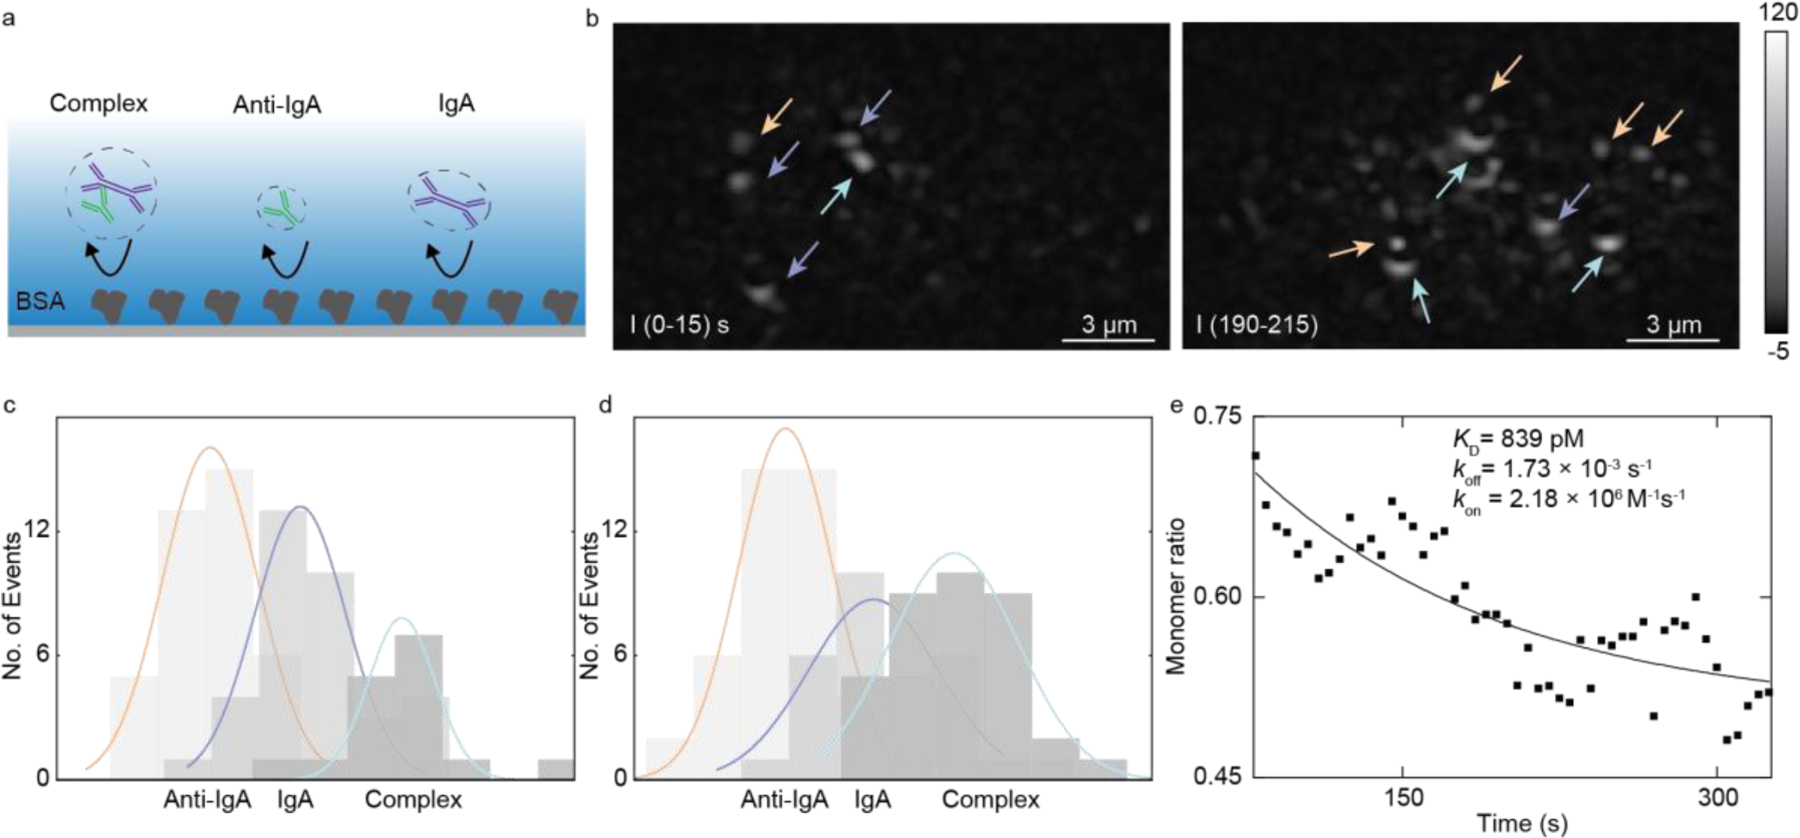
(a) Schematic of nonspecific binding of anti-IgA, IgA and their binding complex, the surface is modified with BSA. (b) Protein binding image of anti-IgA (orange arrow), IgA (purple arrow), and complex (light green arrow) at different times. Histograms of the first minute (c) and the third minute (d) protein counts accumulated in one minute. Gaussian fitting colors correspond with those in (b). (e) IgA monomer ratio (XIgA) as the function of time, the solid line is the exponential decay fitting result. Each data point is the ratio in a one-minute time window and separated by five seconds.
Parallel binding kinetics analysis.
The previous sections show that measuring protein-protein interaction is possible either by immobilizing one of the binding antibodies on the surface or by detecting solution protein abundance changes using ESM. Here, we demonstrate that these two methods are compatible in ESM measurement. We simultaneously measured two pairs of protein interactions (anti-IgA to IgA, anti-IgM to IgM) from a protein mixture. Anti-IgA, IgA, and IgM were mixed with 2.5 nM final concentration for each protein in PBS and immediately flowed over the chip. The ITO chip was pre-modified with anti-IgM on the surface. Anti-IgA, IgA and the complex have different molecule weights from the IgM. They bind to the surface nonspecifically, which can be distinguished from the image intensities. Furthermore, the control experiment shows that specific bindings have much more binding events than nonspecific bindings, because nonspecific bindings have a significantly shorter residence time. Figure 5b shows IgM bound numbers along the time. IgM dissociates from the surface, providing bound number decay in Figure 5b after PBS was flowed over the chip surface. The fitting of the curves with the first-order binding kinetics model determines the association (kon) and dissociation (koff) rate constants, which are 5.21 × 10⁶ M−1 s−1 and 2.96 × 10⁻³ s−1, respectively. From kon and koff, the equilibrium dissociation constant (KD = koff/kon) is determined to be 568 pM. These values are in good agreement with the stand-alone ESM results shown in Figure 3. At the same time, Anti-IgA, IgA, and their complex hit the surface nonspecifically. We counted protein collision events in real time and calculated the monomer ratio as the function of time (Method). Figure 5c shows the monomer IgA ratio versus time during the experiment. At the start of the protein detection, we had the highest monomer ratio, and in the following three minutes this ratio decreased, which is the same as Figure 4. The fitting result of ratio decay is shown in a solid line obtaining koff = 1.48 × 10⁻³ s−1 and kon = 8.81 × 10⁵ M−1s−1, which leads to KD = 1.84 nM.
Figure 5. Parallel binding kinetics analysis of anti-IgA, IgA, anti-IgM, and IgM.
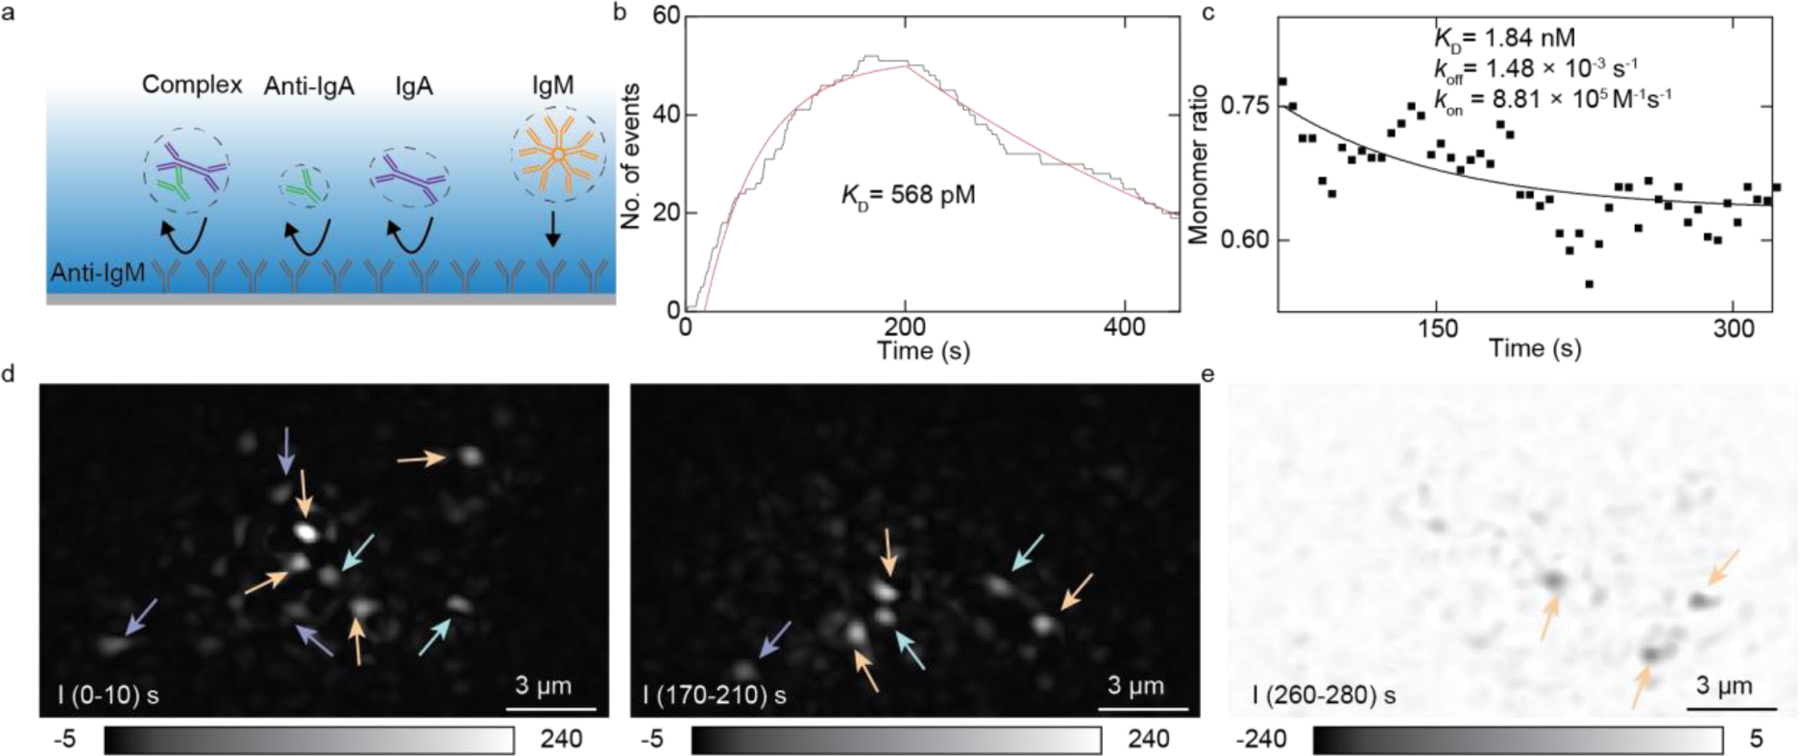
(a) Schematic of protein binding onto the surface. Anti-IgA, IgA, and their complex bind to the surface nonspecifically. IgM bind to the surface specifically. (b) Count-based anti-IgM and IgM binding interaction measurement, the red curve is the fitting result. (c) The solid line is the monomer decay fitting result of anti-IgA and IgA interaction measurement. (d) IgA (purple arrow), complex (light green arrow), and IgM (orange arrow) bind to the surface at different times. (e) IgM unbinds from the surface. Arrows indicate the unbinding spots.
Discussion
The single-molecule imaging systems can measure single protein size and number separately, which is a distinct advantage over ensemble molecular interaction analysis. The ensemble approaches only give the integrated results of both quantities, which are not only sensitive to impurity but also impossible to measure multiple protein species at the same time without spatial separation. However, the single-molecule signal is usually weak and challenging to be precisely achieved with conventional approaches. One of the issues is that traditional average-and-differential image processing for shot noise reduction also sacrifices the temporal resolution needed to locate the timing of single molecule binding events. To overcome this issue, we use a moving-average of the images with a single frame step to find the accurate binding time of each protein. In this way, we can count more single protein binding events and determine the single-molecule signals more precisely. Although we use ESM to show the capability of this improved image processing method, the method should be also applicable to PSM and other imaging-based methods that need the average-and-differential image processing approach for shot noise reduction and background subtraction.
To demonstrate the advantage of this improved data processing method, we show that we can track single protein landing events on the surface and distinguish anti-IgA, IgA, and the binding complex based on proteins spot intensities. By counting the ratio of IgA in the total landing events (IgA + complex), we can track the decay of free monomer IgA abundance in the solution during the binding process and obtain the free solution binding kinetics by fitting the decay curve. Furthermore, we can simultaneously count multiple molecules distinct by their intensities to simultaneously analyze the kinetics of binding processes in the solution and on the surface. We can divide proteins based on size and apply dual binding kinetics to a protein mixture thanks to the new algorithm ability to disclose more binding events and enable more accurate measurement. In contrast to label-based tools like fluorescence, which only have the end point detection capability, ESM supports long time measurement without signal quenching for binding kinetics analysis, giving more details about the dynamics of molecular interactions. This may make it easier to distinguish between specific binding and nonspecific binding17,21,28,29. In the future, we anticipate this capability can help quantitatively estimate the competition between the analyte-protein interaction on the membrane and analyte-antibody binding in the solution.
Materials and methods
Materials.
ITO chips were purchased from SPI Supplies. Human plasma IgM (Catalog No.16-16-090713) and Human colostrum IgA (Catalog No. 16-13-090701) were purchased from Athens Research and Technology. Anti-IgA (Catalog No. STAR141) was purchased from BIO-RAD. Anti-IgM (Catalog No. 10759) were purchased from Sigma Aldrich. Proteins were purified by the company. Phosphate-buffered saline (PBS) was purchased from Corning (Catalog No. 21-040). PBS was filtered with 0.22 um filters (Millex) before usage. N-ethyl-N’-(dimethylaminopropyl) carbodiimide (EDC) (Catalog No.22980) and N-hydroxysulfosuccinimide (Sulfo-NHS) (Catalog No.24510) were purchased from Thermo Fisher Scientific. 99.5% Isopropyl Alcohol (IPA) was purchased from Oakwood chemical.
Experimental Setup.
An 80 mW 450 nm laser diode (PL450B, Thorlabs, Newton, NJ, US) is used for creating an evanescent wave in the experiment. The laser diode is mounted to a temperature-controlled mount (LDM38, Thorlabs) and driven by a benchtop diode current controller (LDC205C, Thorlabs) and a temperature controller (TED200C, Thorlabs). Light from the laser diode is conditioned by an achromatic doublet lens group and focused at the back focal plane of a 60x Objective (Olympus APO N 60x Oil TIRF, NA 1.49). The light incident onto the ITO chip with an angle of ~65° adjusted by a translation stage (XR25P-K2, Thorlabs). The ×50 imaging objective (NA, 0.42) is top-mounted collecting surface, and protein scattered light. A camera (MQ003MG-CM, XIMEA, Münster, Germany) connected to the imaging objective is used to record the scattering images at 160 fps (Figure S1). The image is recorded with a ~8×10 µm2 field of view. The power density is 60 kW/cm2 for single protein imaging. A flow cell for sample delivery is constructed as previously reported21,22.
Protein binding analysis.
To track the protein binding and extract each protein binding intensity, we use the Trackmate30 plugin in the ImageJ app and a homemade Matlab code with the following settings: 1) In Trackmate, a Laplacian of Gaussian Filter with 8 pixels diameter is set as determined by setup resolution and camera pixel size. 2) A threshold provides a spot with a larger than three signal-to-noise-ratio is set. Here we use 1.5 as the quality threshold in Trackmate. 3) As a result of moving-averaging-differential processing, a binding event will show as a still bright spot with a first-increase-then-decrease intensity profile in a temporal differential image sequence (Figure 1f). Trackmate is used to track the binding intensity temporal changes. A gap tolerance is set to 1 frame, and linking distance is set to 1 pixel for tracking one protein binding. We use Matlab to do the following steps. 4) Extract track information from the Trackmate. Filter out tracks with less than 300 ms residence time. This step effectively removes tracks from the background noise. 5) A frame containing more than 40 spots is also filtered out, which usually originated from one or more large impurity particles miss identified by Trackmate as multiple binding spots. 6) For each track, we use the maximum intensity and the Trackmate quality for protein identification. 7) Separate quality thresholds are determined for different protein species relying on binding quality from Trackmate. We have threshold ranges for anti-IgA (1.5–2.8), IgA (2.8–3.2), and IgM (4.8–10), which are determined in the calibration experiments. The threshold range for the complex is 3.2–4.8.
IgA and anti-IgA binding kinetics analysis.
We have anti-IgA and IgA landing counts as the function of time. The fraction of monomer IgA counts equal to the mole fraction of the solution monomer:
| (1) |
Where [IgA] and [Complex] are the concentration of the IgA and the complex. The sum of IgA and complex concentration is a constant, which is the initial concentration of IgA. We consider the first-order reaction of anti-IgA and IgA association experiment11,31,32. According to the derivative equation, kon and koff can be obtained by fitting the IgA concentration decay:
| (2) |
| (3) |
Where kon and koff are the rate constants, and KD is the equilibrium dissociation constant. IgA and complex counts are used here because they have a better signal-to-noise ratio than anti-IgA due to their larger size.
The code is available at https://doi.org/10.5281/zenodo.6583374.
Surface Functionalization and Surface Immobilization.
To measure the nonspecific landing of single proteins, ITO chips were modified with carboxyl groups by the following steps. 1) Incubated the ITO chip in NH3, H2O2, and H2O mixture with a 1:1:5 volume ratio for 1 h. Dropping water became a layer on the hydrophilic chip surface. 2) Ultrasonically cleaned the chip and container with water, rinsed the chip with water, and dried it with nitrogen gas. 3) Incubated the chip in 1% APTES in IPA for 2 hours. This step functionalizes the surface with the amine group. 4) Ultrasonically cleaned the chip and container with IPA, rinsed the chip with water, and dried it with nitrogen gas. 5) Incubated the chip in 10 g/L succinic anhydride for 3 hours. The solution pH should be between 7.5–8. 6) Cleaned the chip and container with water ultrasonically, rinsed the chip with water, and dried it with nitrogen gas. Store the chips in the water for further usage. In the experiment, 0.05 M NHS and 0.2 M EDC were mixed and incubated on the chip surface for 15 minutes to activate the surface. The EDC/NHS solution was filtered with a 0.22 μm filter before usage. After activation, the surface was rinsed with PBS. In the calibration experiment, 10 nM IgG or 5 nM IgA in PBS was flowed onto the surface for single protein calibration. In IgM calibration measurement, 20 nM anti-IgM was incubated on the surface for 1 h after EDC/NHS activation. Then, the surface was rinsed with PBS. Finally, 20 nM IgM solution was flowed onto the surface for measurement. In free solution IgA and anti-IgA binding kinetics measurement, 100 nM BSA was incubated on the surface for 1h after EDC/NHS activation. 2.5 nM anti-IgA and 2.5 nM IgA was flowed over the surface. In IgM and anti-IgM binding kinetics experiment, 20 nM anti-IgM was incubated on the surface for 1h after EDC/NHS activation. 2.5 nM IgM solution was flowed onto the surface for measurement. In parallel binding kinetics measurement, 20 nM anti-IgM was incubated on the surface for 1h after EDC/NHS activation. Anti-IgA, IgA, and IgM with a final 2.5 nM concentration for each protein were flowed onto the surface.
Supplementary Material
Funding:
We thank the financial support from National Institutes of Health Grants R01GM107165 and R01GM140193.
Footnotes
Supporting Information
ESM imaging setup; Shot noise estimation; Calibration result with non-moving average data processing; SPR measurement of IgM binding to anti-IgM; IgA and IgM residence time on anti-IgM chip; Spatial resolution calculation.
References:
- (1).Moffat JG; Vincent F; Lee JA; Eder J; Prunotto M Opportunities and Challenges in Phenotypic Drug Discovery: An Industry Perspective. Nat. Rev. Drug. Discov 2017, 16 (8), 531–543. [DOI] [PubMed] [Google Scholar]
- (2).Sadelain M; Rivière I; Riddell S Therapeutic T Cell Engineering. Nature 2017, 545 (7655), 423–431. [DOI] [PMC free article] [PubMed] [Google Scholar]
- (3).Im H; Shao H; Park YI; Peterson VM; Castro CM; Weissleder R; Lee H Label-Free Detection and Molecular Profiling of Exosomes with a Nano-Plasmonic Sensor. Nat. Biotechnol 2014, 32 (5), 490–495. [DOI] [PMC free article] [PubMed] [Google Scholar]
- (4).Aćimović SS; Ortega MA; Sanz V; Berthelot J; Garcia-Cordero JL; Renger J; Maerkl SJ; Kreuzer MP; Quidant R LSPR Chip for Parallel, Rapid, and Sensitive Detection of Cancer Markers in Serum. Nano Lett 2014, 14 (5), 2636–2641. [DOI] [PubMed] [Google Scholar]
- (5).Wee P; Wang Z Epidermal Growth Factor Receptor Cell Proliferation Signaling Pathways. Cancers 2017, 9 (5), 52. [DOI] [PMC free article] [PubMed] [Google Scholar]
- (6).Dibble CC; Cantley LC Regulation of MTORC1 by PI3K Signaling. Trends in Cell Biology 2015, 25 (9), 545–555. [DOI] [PMC free article] [PubMed] [Google Scholar]
- (7).Gingras A-C; Gstaiger M; Raught B; Aebersold R Analysis of Protein Complexes Using Mass Spectrometry. Nat. Rev. Mol. Cell. Biol 2007, 8 (8), 645–654. [DOI] [PubMed] [Google Scholar]
- (8).Jain A; Liu R; Ramani B; Arauz E; Ishitsuka Y; Ragunathan K; Park J; Chen J; Xiang YK; Ha T Probing Cellular Protein Complexes Using Single-Molecule Pull-Down. Nature 2011, 473 (7348), 484–488. [DOI] [PMC free article] [PubMed] [Google Scholar]
- (9).Barrios-Rodiles M; Brown KR; Ozdamar B; Bose R; Liu Z; Donovan RS; Shinjo F; Liu Y; Dembowy J; Taylor IW; Luga V; Przulj N; Robinson M; Suzuki H; Hayashizaki Y; Jurisica I; Wrana JL High-Throughput Mapping of a Dynamic Signaling Network in Mammalian Cells. Science 2005, 307 (5715), 1621–1625. [DOI] [PubMed] [Google Scholar]
- (10).Campbell C; Kim G SPR Microscopy and Its Applications to High-Throughput Analyses of Biomolecular Binding Events and Their Kinetics. Biomaterials 2007, 28 (15), 2380–2392. [DOI] [PubMed] [Google Scholar]
- (11).Schasfoort RB Handbook of Surface Plasmon Resonance; Royal Society of Chemistry, 2017. [Google Scholar]
- (12).Young G; Hundt N; Cole D; Fineberg A; Andrecka J; Tyler A; Olerinyova A; Ansari A; Marklund EG; Collier MP; Chandler SA; Tkachenko O; Allen J; Crispin M; Billington N; Takagi Y; Sellers JR; Eichmann C; Selenko P; Frey L; Riek R; Galpin MR; Struwe WB; Benesch JLP; Kukura P Quantitative Mass Imaging of Single Biological Macromolecules. Science 2018, 360 (6387), 423–427. [DOI] [PMC free article] [PubMed] [Google Scholar]
- (13).Piliarik M; Sandoghdar V Direct Optical Sensing of Single Unlabelled Proteins and Super-Resolution Imaging of Their Binding Sites. Nat. Commun 2014, 5 (1), 4495. [DOI] [PubMed] [Google Scholar]
- (14).Soltermann F; Foley EDB; Pagnoni V; Galpin M; Benesch JLP; Kukura P; Struwe WB Quantifying Protein–Protein Interactions by Molecular Counting with Mass Photometry. Angew. Chem 2020, 132 (27), 10866–10871. [DOI] [PMC free article] [PubMed] [Google Scholar]
- (15).Vala M; Bujak Ł; García Marín A; Holanová K; Henrichs V; Braun M; Lánský Z; Piliarik M Nanoscopic Structural Fluctuations of Disassembling Microtubules Revealed by Label‐Free Super‐Resolution Microscopy. Small Methods 2021, 5 (4), 2000985. [DOI] [PubMed] [Google Scholar]
- (16).de Wit G; Danial JSH; Kukura P; Wallace MI Dynamic Label-Free Imaging of Lipid Nanodomains. Proc. Natl. Acad. Sci. U.S.A 2015, 112 (40), 12299–12303. [DOI] [PMC free article] [PubMed] [Google Scholar]
- (17).Taylor RW; Sandoghdar V Interferometric Scattering Microscopy: Seeing Single Nanoparticles and Molecules via Rayleigh Scattering. Nano Lett 2019, 19 (8), 4827–4835. [DOI] [PMC free article] [PubMed] [Google Scholar]
- (18).Priest L; Peters JS; Kukura P Scattering-Based Light Microscopy: From Metal Nanoparticles to Single Proteins. Chem. Rev 2021, 121 (19), 11937–11970. [DOI] [PMC free article] [PubMed] [Google Scholar]
- (19).Boyer D; Tamarat P; Maali A; Lounis B; Orrit M Photothermal Imaging of Nanometer-Sized Metal Particles Among Scatterers. Science 2002, 297 (5584), 1160–1163. [DOI] [PubMed] [Google Scholar]
- (20).Selmke M; Braun M; Cichos F Photothermal Single-Particle Microscopy: Detection of a Nanolens. ACS Nano 2012, 6 (3), 2741–2749. [DOI] [PubMed] [Google Scholar]
- (21).Zhang P; Ma G; Dong W; Wan Z; Wang S; Tao N Plasmonic Scattering Imaging of Single Proteins and Binding Kinetics. Nat. Methods 2020, 17 (10), 1010–1017. [DOI] [PMC free article] [PubMed] [Google Scholar]
- (22).Zhang P; Ma G; Wan Z; Wang S Quantification of Single-Molecule Protein Binding Kinetics in Complex Media with Prism-Coupled Plasmonic Scattering Imaging. ACS Sens 2021, 6 (3), 1357–1366. [DOI] [PMC free article] [PubMed] [Google Scholar]
- (23).Zhang P; Zhou X; Wang R; Jiang J; Wan Z; Wang S Label-Free Imaging of Nanoscale Displacements and Free-Energy Profiles of Focal Adhesions with Plasmonic Scattering Microscopy. ACS Sens 2021, 6 (11), 4244–4254. [DOI] [PMC free article] [PubMed] [Google Scholar]
- (24).Zhang P; Wang S Real-Time Analysis of Exosome Secretion of Single Cells with Single Molecule Imaging. BIOCELL 2021, 45 (6), 1449–1451. [DOI] [PMC free article] [PubMed] [Google Scholar]
- (25).Zhang P; Zhou L; Wang R; Zhou X; Jiang J; Wan Z; Wang S Evanescent Scattering Imaging of Single Protein Binding Kinetics and DNA Conformation Changes. Nat. Commun 2022, 13 (1), 2298. [DOI] [PMC free article] [PubMed] [Google Scholar]
- (26).Cole D; Young G; Weigel A; Sebesta A; Kukura P Label-Free Single-Molecule Imaging with Numerical-Aperture-Shaped Interferometric Scattering Microscopy. ACS Photonics 2017, 4 (2), 211–216. [DOI] [PMC free article] [PubMed] [Google Scholar]
- (27).Li Y; Struwe WB; Kukura P Single Molecule Mass Photometry of Nucleic Acids. Nucleic Acids Research 2020, 48 (17), e97–e97. [DOI] [PMC free article] [PubMed] [Google Scholar]
- (28).Foley EDB; Kushwah MS; Young G; Kukura P Mass Photometry Enables Label-Free Tracking and Mass Measurement of Single Proteins on Lipid Bilayers. Nat. Methods 2021, 18 (10), 1247–1252. [DOI] [PMC free article] [PubMed] [Google Scholar]
- (29).Heermann T; Steiert F; Ramm B; Hundt N; Schwille P Mass-Sensitive Particle Tracking to Elucidate the Membrane-Associated MinDE Reaction Cycle. Nat. Methods 2021, 18 (10), 1239–1246. [DOI] [PMC free article] [PubMed] [Google Scholar]
- (30).Tinevez J-Y; Perry N; Schindelin J; Hoopes GM; Reynolds GD; Laplantine E; Bednarek SY; Shorte SL; Eliceiri KW TrackMate: An Open and Extensible Platform for Single-Particle Tracking. Methods 2017, 115, 80–90. [DOI] [PubMed] [Google Scholar]
- (31).Bernetti M; Masetti M; Rocchia W; Cavalli A Kinetics of Drug Binding and Residence Time. Annu. Rev. Phys. Chem 2019, 70 (1), 143–171. [DOI] [PubMed] [Google Scholar]
- (32).Vauquelin G Effects of Target Binding Kinetics on in Vivo Drug Efficacy: K off, k on and Rebinding: Exploring Drug Rebinding in Vivo. British Journal of Pharmacology 2016, 173 (15), 2319–2334. [DOI] [PMC free article] [PubMed] [Google Scholar]
Associated Data
This section collects any data citations, data availability statements, or supplementary materials included in this article.