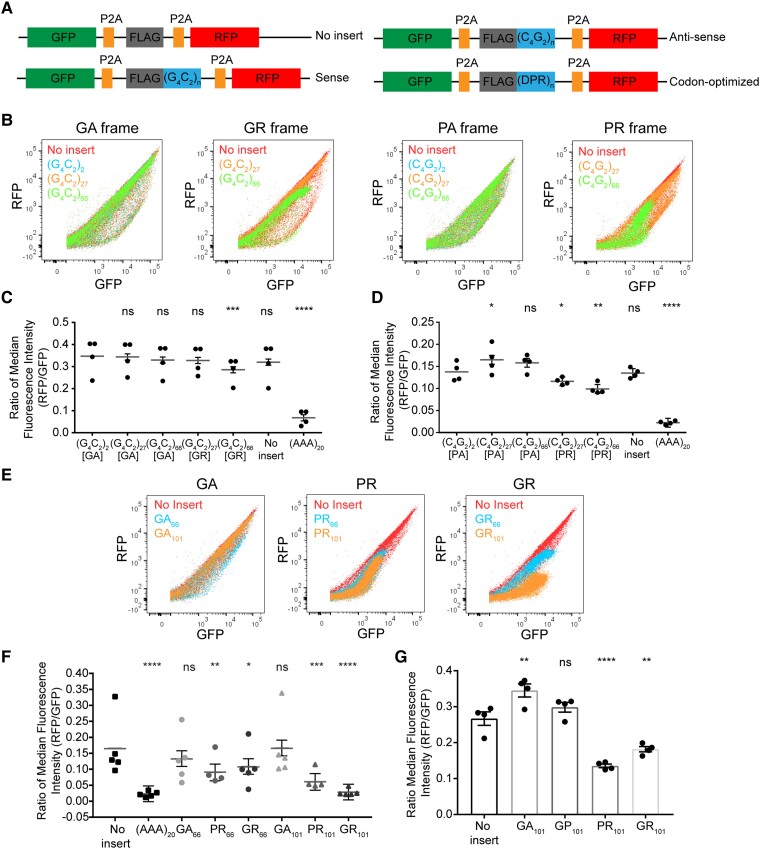
Figure 3.
Arginine-rich DPR proteins induce ribosomal stalling in cells. (A) Schematic of stalling reporters with C9orf72-associated sequences [(G4C2) n = 2, 27 or 66, (C4G2) n = 2, 27 or 66 and codon-optimized n = 66 or 101]. (B) Dot plot of GFP and RFP expression profile for stalling reporters with C9orf72 repeats in different reading frames. (C) Ratio of median fluorescence intensity of RFP to GFP of C9orf72-associated repeats in the sense orientation for four biological replicates shows stalling in GR reading frame at 66 units. Ratio is shown as β (grey line) with all data points and error bars represent standard error [mixed effects model, n = 4, (G4C2)27-GA P = 0.8254, (G4C2)66-GA P = 0.2318, (G4C2)27-GR P = 0.1890, (G4C2)66-GR P = 0.0004, no insert P = 0.0705, (AAA)20P < 0.0001]. (D) Ratio of median fluorescence intensity of RFP to GFP of C9orf72-associated repeats in the antisense orientation for four biological replicates shows stalling in PR reading frame at 66 units. Ratio is shown as β (grey line) with all data points and error bars represent standard error [mixed effects model, n = 4, (C4G2)27-PA P = 0.0135, (C4G2)66-PA P = 0.0553, (C4G2)27-PR P = 0.0466, (C4G2)66-PR P = 0.0011, no insert P = 0.7911, (AAA)20 P < 0.0001]. (E) Expression profile of GFP and RFP for stalling reporters with codon-optimized DPR protein sequences expressed in HEK 293T cells. (F) Ratio of RFP to GFP median fluorescence intensity of five biological replicates of codon-optimized stalling reporters expressed in HEK 293T cells shows stalling in PR and GR-encoding sequences. Ratio is shown as β (grey line) with all data points and error bars represent standard error [mixed effects model, n = 5, GA66P = 0.1972, PR66P = 0.0076, GR66P = 0.0271, GA101P = 0.9730, PR101P = 0.0004, GR101P < 0.0001, (AAA)20P < 0.0001]. (G) Ratio of RFP to GFP median fluorescence intensity of four biological replicates of codon-optimized stalling reporters expressed in induced neuronal cells. Ratio is shown as mean ± SEM with all data points (Dunnett’s multiple comparisons test, n = 4, GA101P = 0.0039, GP101P = 0.3361, PR101P = 0.0001, GR101P = 0.0019).

