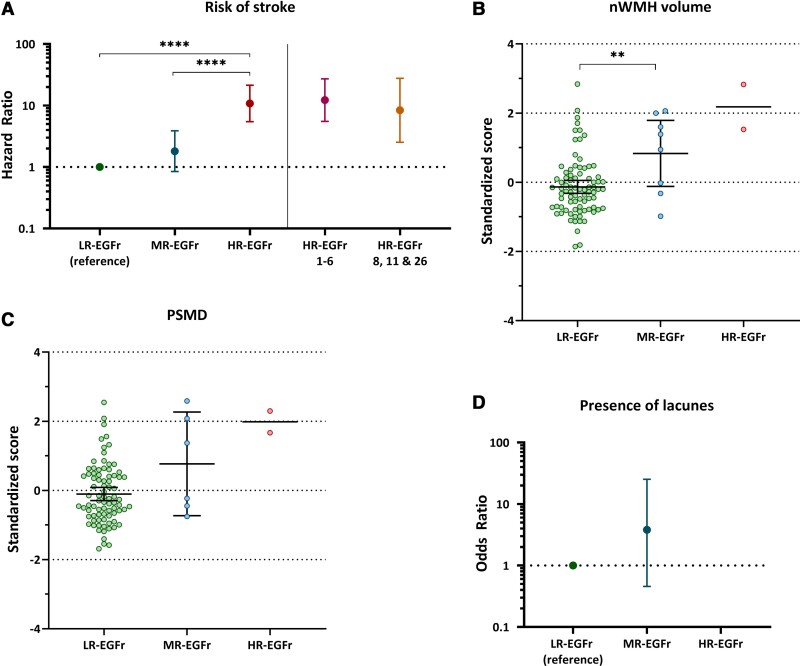
Figure 5.
Association between small vessel disease imaging marker load and risk of stroke between EGFr risk categories in the population genotype–phenotype data set. Two scatterplots and two interval plots showing the risk of stroke, nWMHv, PSMD and nLV stratified per EGFr risk category in the population genotype–phenotype data set after correction for cardiovascular risk factors and sex. Error bars indicate 95% confidence intervals of the group means. (A) HR-EGFr individuals had a significantly higher risk of stroke than MR-EGFr (P = 1.5 × 10⁻⁴) and LR-EGFr individuals (P = 8.1 × 10⁻¹²). There was a trend to a higher risk of stroke for MR-EGFr individuals compared to LR-EGFr individuals (P = 0.13). Both HR-EGFr 1–6 and HR-EGFr 8, 11, 26 individuals had a much higher risk of stroke than MR-EGFr (P = 2.2 × 10⁻⁴ and P = 0.025, respectively) and LR-EGFr individuals (P = 7.4 × 10⁻¹⁰ and P = 5.0 × 10⁻⁴, respectively). (B and C) MR-EGFr individuals had a significantly higher nWMHv (P = 0.005) and PSMD (P = 0.035) than LR-EGFr individuals. Only two individuals in the population with a brain MRI harboured an HR-EGFr variant and both had a much higher mean nWMHv and PSMD than MR-EGFr and LR-EGFr individuals. (D) Only 15 of the 102 (14.7%) individuals with a brain MRI had lacunes on brain MRI. There was no significant difference in the presence of lacunes between MR-EGFr and LR-EGFr individuals (P = 0.16). As the two HR-EGFr individuals had no lacunes on brain MRI, the odds ratio for the presence of lacunes could not be calculated. Statistical significance after correction for multiple testing: *P < 0.05, **P < 0.01, ***P < 0.001, ****P < 0.0001.

